. 2017 Feb;56(2):160-167.
doi: 10.1165/rcmb.2016-0083MA.

Ablation of Pericyte-Like Cells in Lungs by Oropharyngeal Aspiration of Diphtheria Toxin

Affiliations

Ablation of Pericyte-Like Cells in Lungs by Oropharyngeal Aspiration of Diphtheria Toxin

Chi F Hung et al. Am J Respir Cell Mol Biol. 2017 Feb.

Abstract

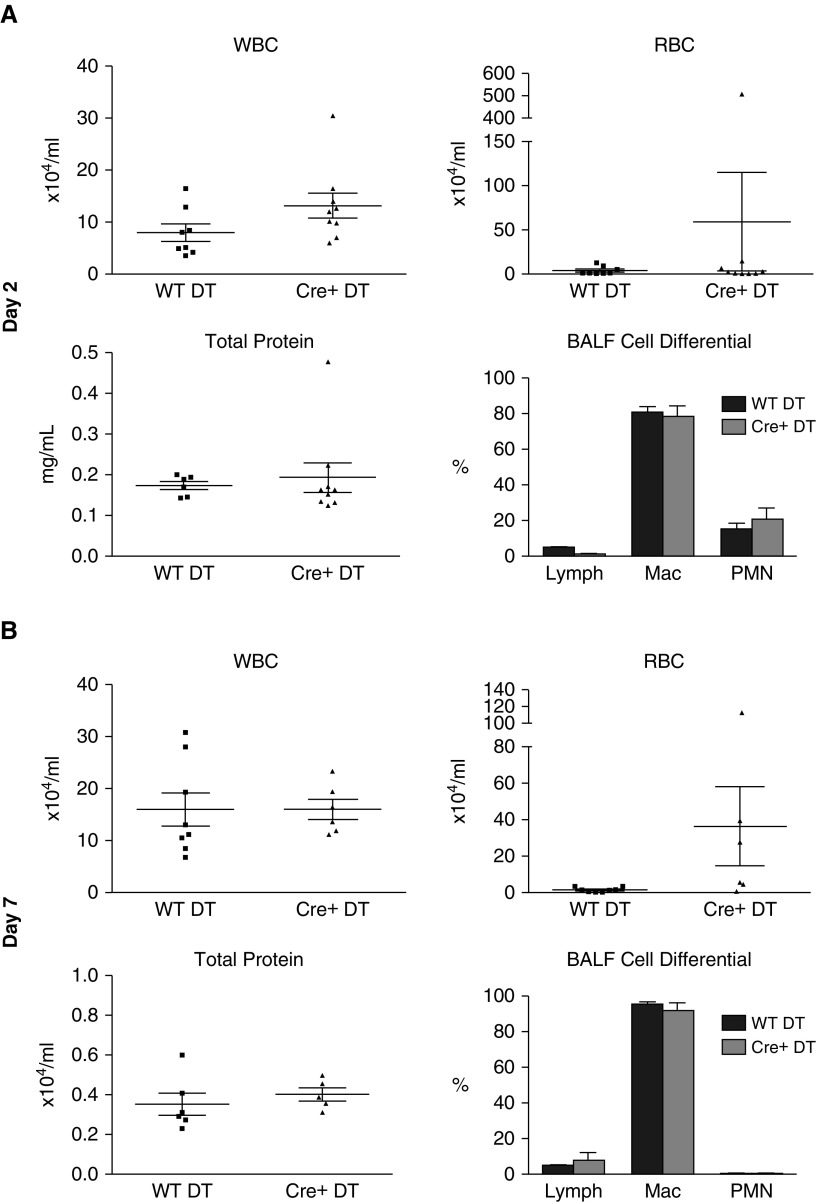
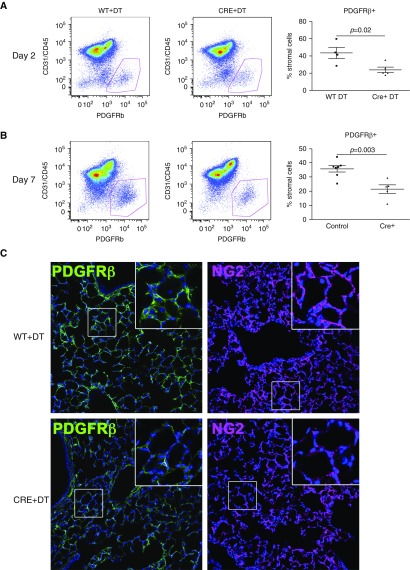
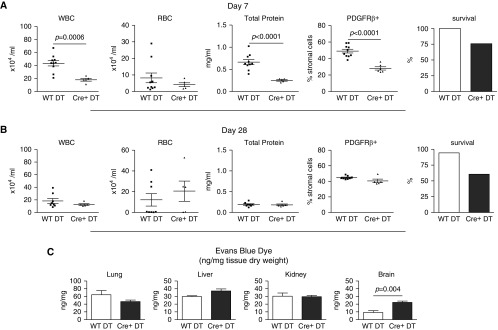
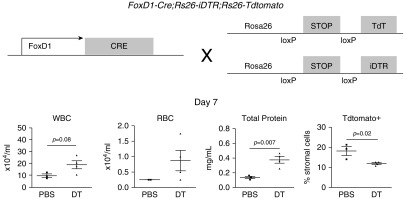
We demonstrated previously that FoxD1-derived cells in the lung are enriched in pericyte-like cells in mouse lung. These cells express the common pericyte markers and are located adjacent to endothelial cells. In this study, we demonstrate the feasibility of administering diphtheria toxin (DT) by oropharyngeal aspiration as an approach to ablating FoxD1-derived cells. We crossed mice expressing Cre-recombinase under the FoxD1 promoter to Rosa26-loxP-STOP-loxP-iDTR mice and generated a bitransgenic line (FoxD1-Cre;Rs26-iDTR) in which FoxD1-derived cells heritably express simian or human diphtheria toxin receptor and are sensitive to DT. We delivered low-dose (0.5 ng/g) and high-dose (1ng/g × 2) to FoxD1-Cre;Rs26-iDTR mice and littermate control mice by oropharyngeal aspiration and evaluated ablation by flow cytometry and immunohistochemistry. FoxD1-Cre mice showed a 40-50% reduction in PDGFRβ+ cells by flow cytometry at Days 2 and 7 after DT administration, with a return of PDGFRβ+ cells at Day 28. Confocal microscopy revealed an observable reduction in pericyte markers. Bronchoalveolar lavage fluid analysis revealed no significant differences in total protein, bronchoalveolar lavage fluid red blood cell, or white blood cell counts at low dose. However, at high-dose DT, there was a proinflammatory effect in the control mice and increased mortality associated with systemic toxicity in Cre+ mice. Low-dose DT reduced lung PDGFRβ+ stromal cells in the FoxD1-Cre;iDTR transgenic model without a differential effect on lung inflammation in DT-sensitive and DT-insensitive animals. Low-dose DT is a viable method for transient lineage-specific stromal cell ablation in the lung that minimizes systemic toxicity.

Keywords: FoxD1; ablation; diphtheria toxin; pericytes; platelet-derived growth factor receptor β.


Figures

Figure 1.
Figure 1.
(A) BALF collected at Day 2 after DT administration in WT DT and Cre+ DT animals. BALF WBC in the WT DT group was 7.9 ± 1.6 × 104/ml versus 13.1 ± 2.4 × 104/ml in the Cre+ DT group (mean ± SEM, P = 0.1, n ≥ 8). BALF RBC in the WT DT group was 3.9 ± 1.7 × 104/ml versus 55.4 ± 59.9 × 104/ml in the Cre+ DT group (mean ± SEM, P = 0.37, n ≥ 8). BALF total protein in the WT DT group was 173.8 ± 10.1 μg/ml versus 193.4 ± 36.9 μg/ml in the Cre+ DT group (mean ± SEM, P = 0.68, n ≥ 6). Cell differential of BALF showed predominantly macrophages (80.4 ± 3.4% WT DT versus 78.3 ± 6.2% Cre+ DT) with slight neutrophilia (14.8 ± 3.9% WT DT versus 20.7 ± 6.3%) (mean ± SEM, n ≥ 6). (B) At Day 7 after DT administration, BALF WBC in in the WT DT group was 16 ± 3.2 × 104/ml versus 16 ± 1.9 × 104/ml in the Cre+ DT group (mean ± SEM, P = 0.998, n ≥ 6). BALF RBC in the WT DT group was 1.5 ± 0.5 × 104/ml versus 36.3 ± 21.7 × 104/ml in the Cre+ DT group (mean ± SEM, P = 0.08, n ≥ 6). No difference was observed in BALF total protein between the two groups (352.3 ± 55.1 μg/ml WT DT versus 401.8 ± 33.8 μg/ml Cre+ DT, P = 0.49, n ≥ 5). Cell differential of BALF at Day 7 showed predominantly macrophages (95.4 ± 1.1% WT DT versus 91.7 ± 4.3% Cre+ DT) without significant difference in cell differential (mean ± SEM, n ≥ 6). BALF, bronchoalveolar lavage fluid; Cre+ DT, FoxD1-Cre;Rs26-iDTR; DT, diphtheria toxin; Lymph, lymphocytes; Mac, macrophages; PMN, polymorphonuclear cells; RBC, red blood cells; WBC, white blood cells; WT DT, control.
Figure 2.
Figure 2.
(A) Gating of PDGFRβ+ stromal populations in lung single-cell preparations from WT DT and Cre+ DT groups harvested on Day 2. Graph represents PDGFRβ+ cells as a percentage of stromal cells in WT DT and Cre+ DT groups at Day 2 (44 ± 6% versus 24 ± 3%, respectively, mean ± SEM, P= 0.02, n ≥ 4). (B) Gating of PDGFRβ+ stromal population at Day 7 after DT administration. Graph represents PDGFRβ+ cells as a percentage of stromal cells in WT DT and Cre+ DT groups at Day 7 (36 ± 2% versus 22 ± 3%, respectively, mean ± SEM, P= 0.003, n ≥ 5). (C) Immunostaining for PDGFRβ+ cells (green) and NG2 (purple) in lung sections from WT DT (top two panels) and Cre+ DT (bottom two panels) mice at Day 7 (nuclei represented by blue 4′,6-diamidino-2-phenylindole staining). Cre+ DT mice display patchy PDGFRβ and NG2 immunostaining. (Inset) Magnified views of normal PDGFRβ and NG2 staining in several alveoli from WT DT mice in contrast to areas with diminished immunostaining in Cre+ DT mice. NG2, neural/glial antigen 2; PDGFRβ, platelet-derived growth factor receptor-β.
Figure 3.
Figure 3.
Characterization of high-dose DT. (A) BALF analysis at Day 7 after DT exposure. BALF WBC in the WT DT group was 18.2 ± 3.8 × 104/ml versus 12.6 ± 1.4 × 104/ml in the Cre+ DT group (mean ± SEM, P = 0.3, n ≥ 5). BALF RBC in the WT DT group was 12.2 ± 6 × 104/ml versus 20.7 ± 10.7 × 104/ml in the Cre+ DT group (mean ± SEM, P = 0.45, n ≥ 5). BALF total protein in the WT DT group was 664.5 ± 56.1 μg/ml versus 254.2 ± 16.4 μg/ml in the Cre+ DT group (mean ± SEM, P = 0.0002, n ≥ 5). All mice in the WT DT group survived to Day 7, compared with only 75% of mice in the Cre+ DT group. (B) BALF analysis at Day 28 after DT exposure. BALF WBC in the WT DT group was 43.5 ± 4 × 104/ml versus 18.1 ± 2.1 × 104/ml in the Cre+ DT group (mean ± SEM, P = 0.001, n ≥ 5). BALF RBC in the WT DT group was 8.2 ± 3 × 104/ml versus 4.1 ± 1.2 × 104/ml in the Cre+ DT group (mean ± SEM, P = 0.37, n ≥ 5). BALF total protein in the WT DT group was 195.5 ± 17.5 μg/ml versus 187.2 ± 22.5 μg/ml in the Cre+ DT group (mean ± SEM, P = 0.78, n ≥ 5). All mice in the WT DT group survived to Day 28, compared with only 63% of mice in the Cre+ DT group. (C) Evans blue dye (EBD) extravasation in four organs 48 hours after high-dose DT exposure. Graphs represent total EBD (nanograms) normalized to tissue dry weight (milligrams) (mean ± SEM). The brain showed significantly elevated EBD extravasation in the Cre+ DT group compared with WT DT (22.3 ± 1.7 ng/mg versus 9.4 ± 2.2 ng/mg, respectively, P = 0.004, n ≥ 3).
Figure 4.
Figure 4.
(Top) Diagram of triple-transgenic animal in which FoxD1-Cre controls the expression of Rs26-iDTR and Rs26-tdTomato transgenes. (Bottom) Triple-transgenic mice were exposed to PBS (control group) or DT in triple-transgenic mice. Graphs represent mean ± SEM. BALF WBC in the PBS group was 9.9 ± 1.4 × 104/ml versus 19 ± 3.3 × 104/ml in the DT group (P = 0.08, n ≥ 3). BALF RBC was 0.25 × 104/ml in the PBS group and 0.9 ± 0.3 × 104/ml in the DT group (P = 0.3, n ≥ 3). BALF total protein in the PBS group was 137 ± 16 μg/ml versus 376.3 ± 44.7 μg/ml in the DT group (P = 0.007, n ≥ 3). By flow cytometry, 18.2 ± 2.2% of stromal cells were tdTomato+ (FoxD1-lineage) in the control group (PBS), whereas only 11.9 ± 0.4% of stromal cells were tdTomato+ in the DT group (P= 0.02, n ≥ 3). iDTR, human diphtheria toxin receptor; TdT, tdTomato.

Similar articles

Cited by

References

    1. Armulik A, Genové G, Betsholtz C. Pericytes: developmental, physiological, and pathological perspectives, problems, and promises. Dev Cell. 2011;21:193–215. - PubMed
    1. Smith SW, Chand S, Savage CO. Biology of the renal pericyte. Nephrol Dial Transplant. 2012;27:2149–2155. - PubMed
    1. von Tell D, Armulik A, Betsholtz C. Pericytes and vascular stability. Exp Cell Res. 2006;312:623–629. - PubMed
    1. Stapor PC, Sweat RS, Dashti DC, Betancourt AM, Murfee WL. Pericyte dynamics during angiogenesis: new insights from new identities. J Vasc Res. 2014;51:163–174. - PMC - PubMed
    1. Stark K, Eckart A, Haidari S, Tirniceriu A, Lorenz M, von Brühl ML, Gärtner F, Khandoga AG, Legate KR, Pless R, et al. Capillary and arteriolar pericytes attract innate leukocytes exiting through venules and ‘instruct’ them with pattern-recognition and motility programs. Nat Immunol. 2013;14:41–51. - PubMed

Substances

LinkOut - more resources