

Two New FRET Imaging Measures: Linearly Proportional to and Highly Contrasting the Fraction of Active Molecules
- PMID: 27780260
- PMCID: PMC5079603
- DOI: 10.1371/journal.pone.0164254
Two New FRET Imaging Measures: Linearly Proportional to and Highly Contrasting the Fraction of Active Molecules
Abstract
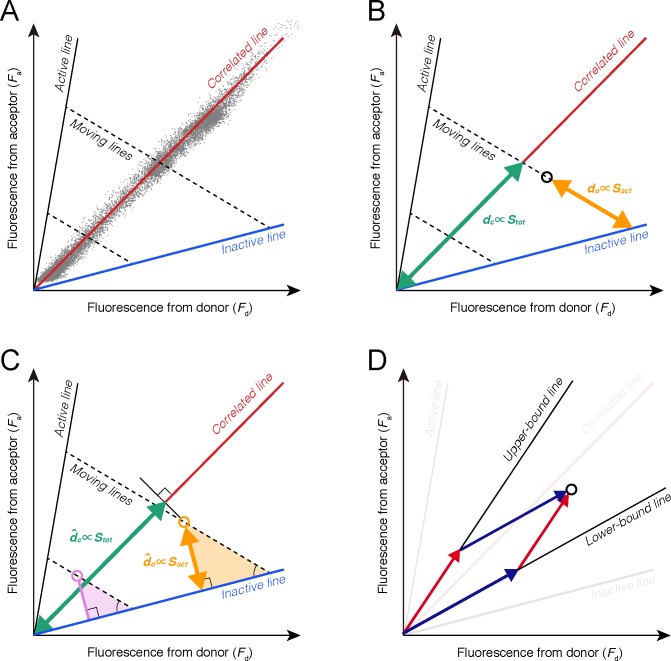
We developed two new FRET imaging measures for intramolecular FRET biosensors, called linearly proportional (LP) and highly contrasting (HC) measures, which can be easily calculated by the fluorescence intensities of donor and acceptor as a ratio between their weighted sums. As an alternative to the conventional ratiometric measure, which non-linearly depends on the fraction of active molecule, we first developed the LP measure, which is linearly proportional to the fraction of active molecules. The LP measure inherently unmixes bleed-through signals and is robust against fluorescence noise. By extending the LP measure, we furthermore designed the HC measure, which provides highly contrasting images of the molecular activity, more than the ratiometric measure. In addition to their advantages, these measures are insensitive to the biosensor expression level, which is a fundamental property of the ratiometric measure. Using artificial data and FRET imaging data, we showed that the LP measure effectively represents the fraction of active molecules and that the HC measure improves visual interpretability by providing high contrast images of molecular activity. Therefore, the LP and HC measures allow us to gain more quantitative and qualitative insights from FRET imaging than the ratiometric measure.
Conflict of interest statement
The authors have declared that no competing interests exist.
Figures


Similar articles
-
Quantitative Imaging of FRET-Based Biosensors for Cell- and Organelle-Specific Analyses in Plants.Microsc Microanal. 2016 Apr;22(2):300-10. doi: 10.1017/S143192761600012X. Epub 2016 Feb 16. Microsc Microanal. 2016. PMID: 26879593
-
Genetically encoded FRET-based biosensors for multiparameter fluorescence imaging.Curr Opin Biotechnol. 2009 Feb;20(1):19-27. doi: 10.1016/j.copbio.2009.01.003. Epub 2009 Feb 14. Curr Opin Biotechnol. 2009. PMID: 19223167
-
Fluorescent protein FRET pairs for ratiometric imaging of dual biosensors.Nat Methods. 2008 May;5(5):401-3. doi: 10.1038/nmeth.1207. Epub 2008 Apr 20. Nat Methods. 2008. PMID: 18425137
-
Fluorescence resonance energy transfer (FRET)-based biosensors: visualizing cellular dynamics and bioenergetics.Appl Microbiol Biotechnol. 2012 Nov;96(4):895-902. doi: 10.1007/s00253-012-4449-6. Epub 2012 Oct 6. Appl Microbiol Biotechnol. 2012. PMID: 23053099 Review.
-
Opportunities for bioprocess monitoring using FRET biosensors.Biochem Soc Trans. 2013 Oct;41(5):1146-51. doi: 10.1042/BST20130103. Biochem Soc Trans. 2013. PMID: 24059500 Review.
Cited by
-
Monitoring Cellular Energy Balance in Single Cells Using Fluorescent Biosensors for AMPK.Methods Mol Biol. 2025;2882:47-79. doi: 10.1007/978-1-0716-4284-9_3. Methods Mol Biol. 2025. PMID: 39992504 Free PMC article.
-
Machine learning-guided reconstruction of cytoskeleton network from live-cell AFM images.iScience. 2024 Sep 10;27(10):110907. doi: 10.1016/j.isci.2024.110907. eCollection 2024 Oct 18. iScience. 2024. PMID: 39391724 Free PMC article.
-
Live imaging of apoptotic signaling flow using tunable combinatorial FRET-based bioprobes for cell population analysis of caspase cascades.Sci Rep. 2022 Dec 7;12(1):21160. doi: 10.1038/s41598-022-25286-z. Sci Rep. 2022. PMID: 36476686 Free PMC article.
-
Optimal inference of molecular interaction dynamics in FRET microscopy.Proc Natl Acad Sci U S A. 2023 Apr 11;120(15):e2211807120. doi: 10.1073/pnas.2211807120. Epub 2023 Apr 4. Proc Natl Acad Sci U S A. 2023. PMID: 37014867 Free PMC article.
-
Au nano-urchins enabled localized surface plasmon resonance sensing of beta amyloid fibrillation.Nanoscale Adv. 2020 Mar 17;2(7):2693-2698. doi: 10.1039/d0na00164c. eCollection 2020 Jul 14. Nanoscale Adv. 2020. PMID: 36132375 Free PMC article.
References
MeSH terms
LinkOut - more resources
Full Text Sources
Other Literature Sources
Research Materials
