. 2017 May 15;23(10):2506-2515.
doi: 10.1158/1078-0432.CCR-16-1996. Epub 2016 Oct 25.

T-cell Receptor Signaling Activates an ITK/NF-κB/GATA-3 axis in T-cell Lymphomas Facilitating Resistance to Chemotherapy

Affiliations

T-cell Receptor Signaling Activates an ITK/NF-κB/GATA-3 axis in T-cell Lymphomas Facilitating Resistance to Chemotherapy

Tianjiao Wang et al. Clin Cancer Res. .

Erratum in

Abstract

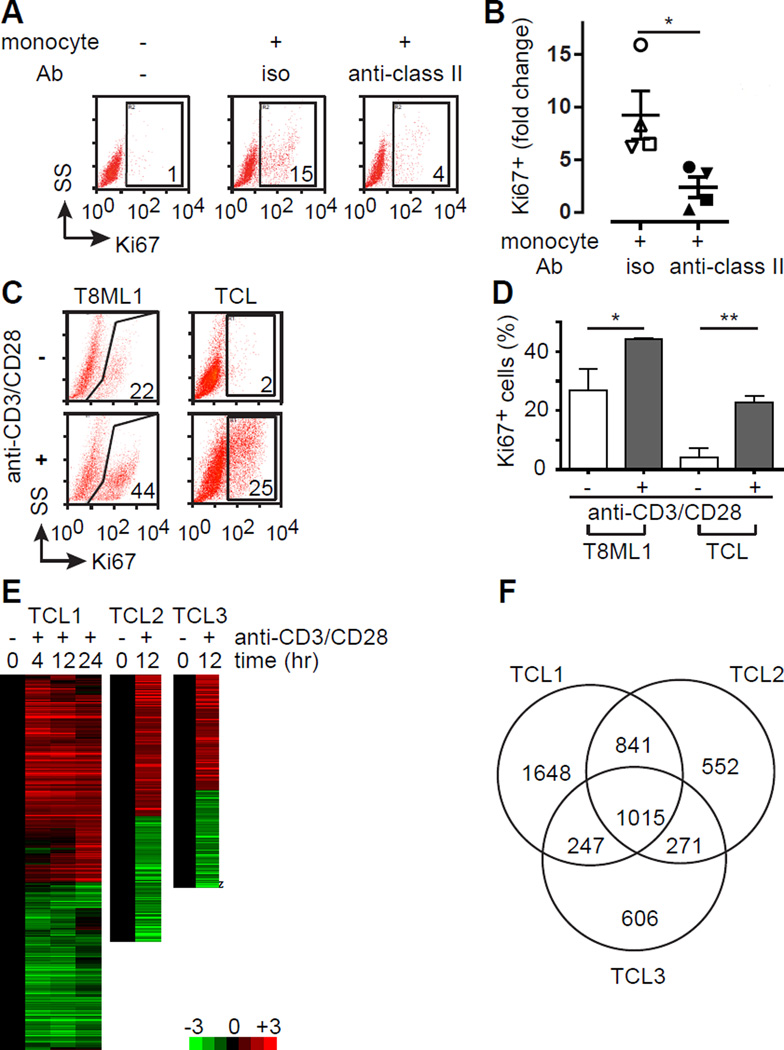
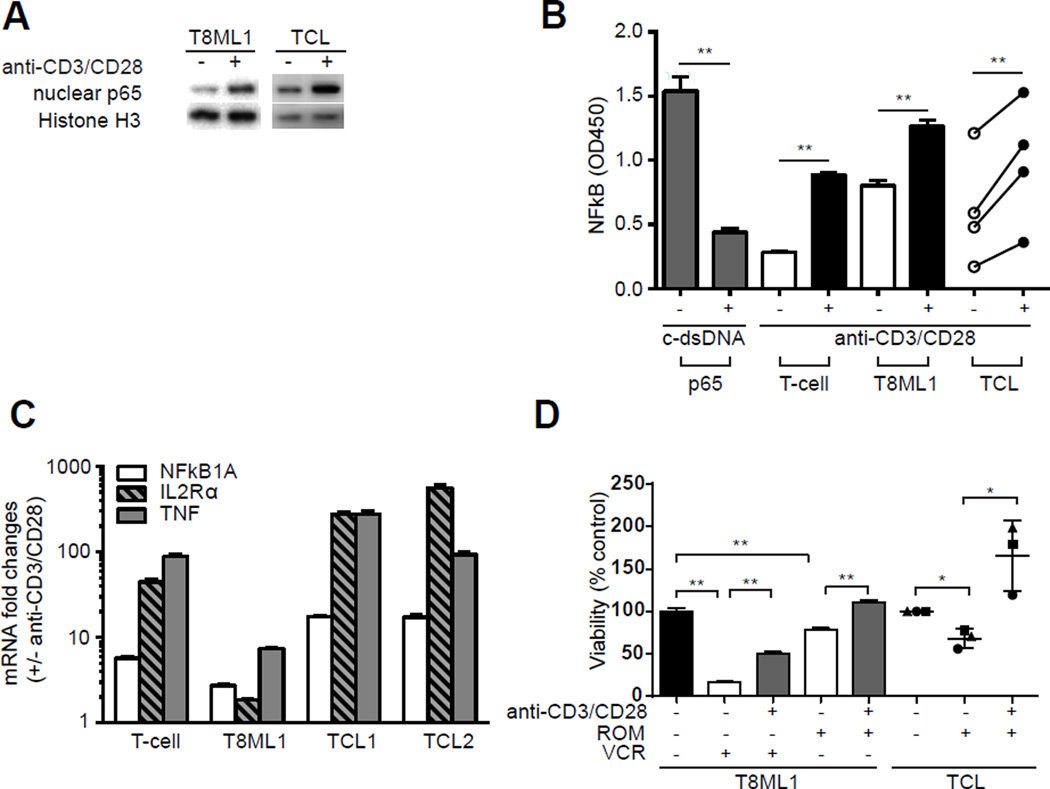
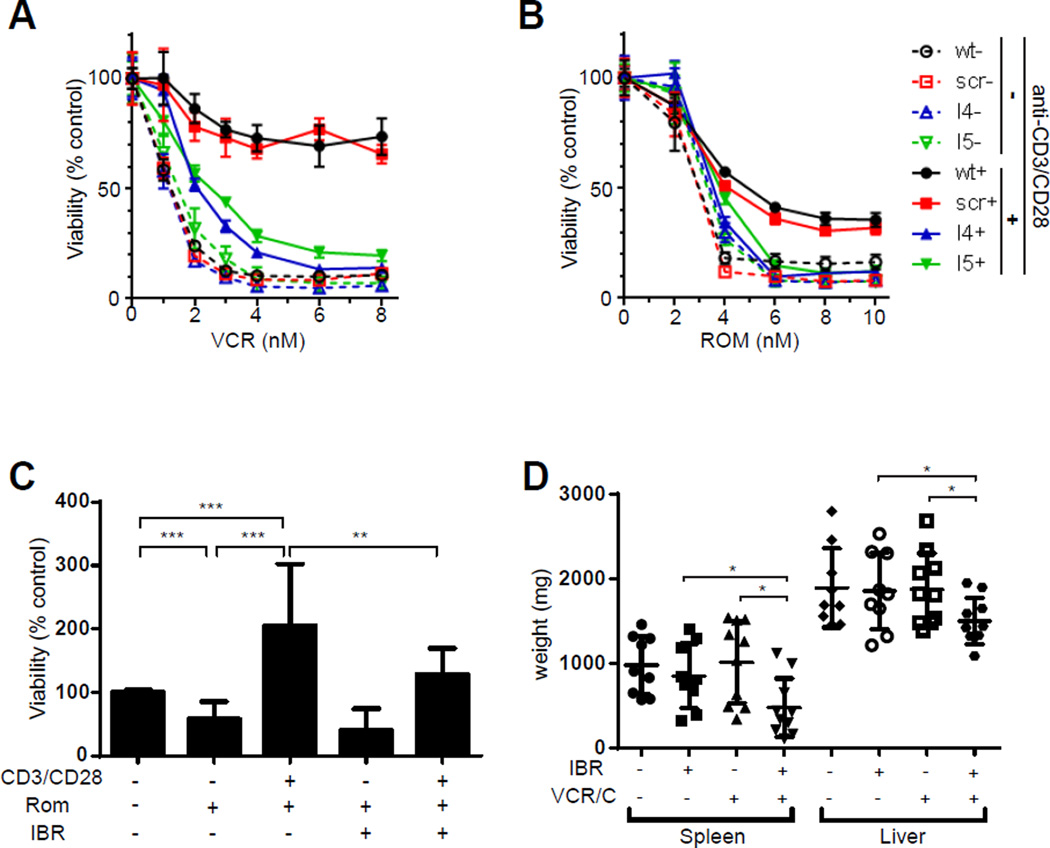
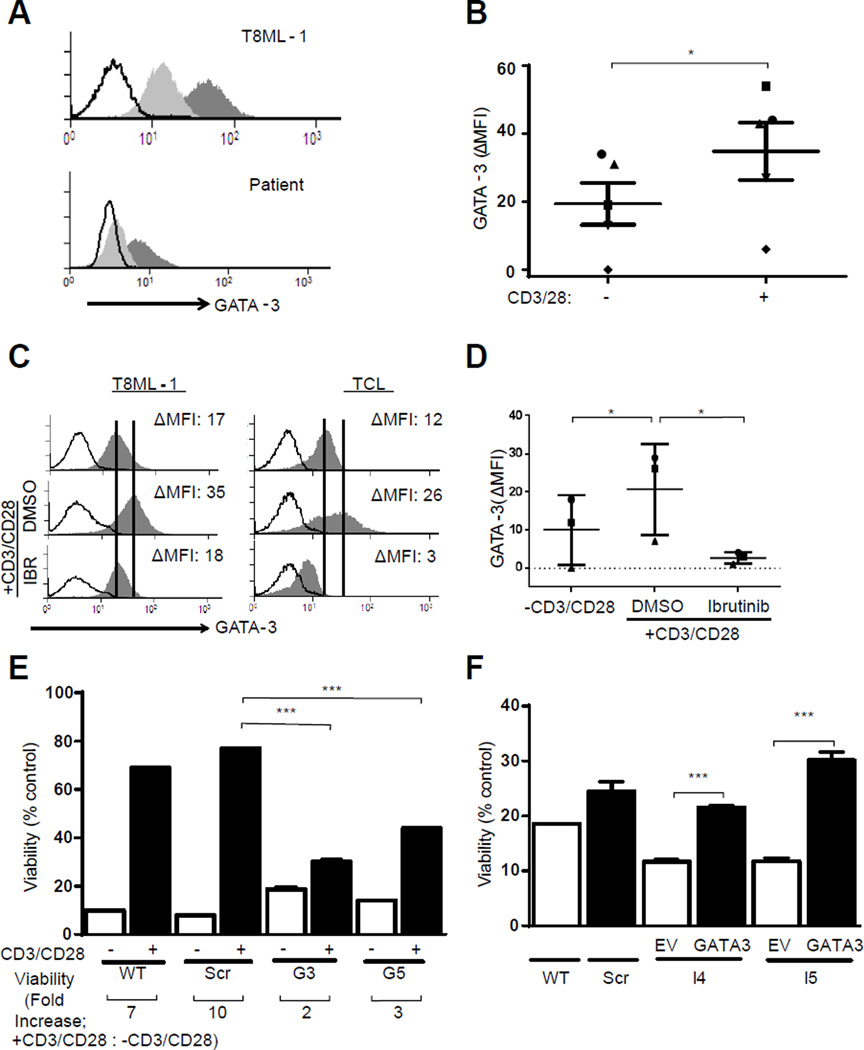
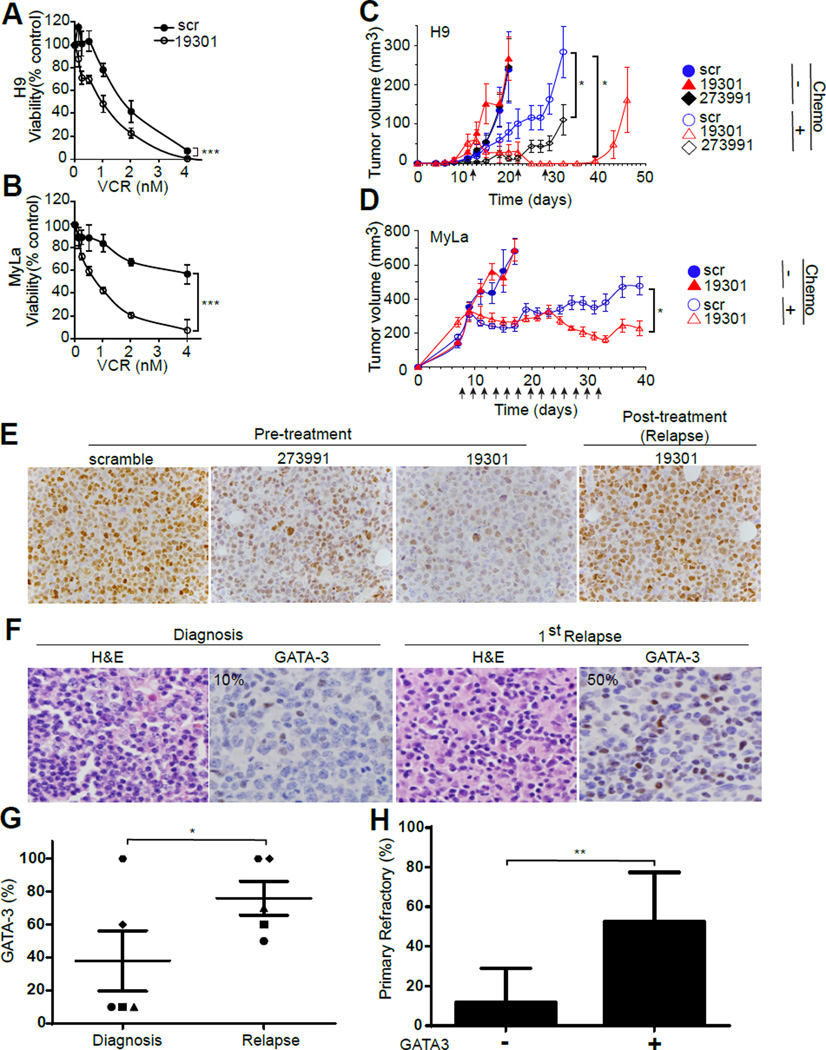
Purpose: T-cell lymphomas are a molecularly heterogeneous group of non-Hodgkin lymphomas (NHL) that account for a disproportionate number of NHL disease-related deaths due to their inherent and acquired resistance to standard multiagent chemotherapy regimens. Despite their molecular heterogeneity and frequent loss of various T cell-specific receptors, the T-cell antigen receptor is retained in the majority of these lymphomas. As T-cell receptor (TCR) engagement activates a number of signaling pathways and transcription factors that regulate T-cell growth and survival, we examined the TCR's role in mediating resistance to chemotherapy.Experimental Design: Genetic and pharmacologic strategies were utilized to determine the contribution of tyrosine kinases and transcription factors activated in conventional T cells following TCR engagement in acquired chemotherapy resistance in primary T-cell lymphoma cells and patient-derived cell lines.Results: Here, we report that TCR signaling activates a signaling axis that includes ITK, NF-κB, and GATA-3 and promotes chemotherapy resistance.Conclusions: These observations have significant therapeutic implications, as pharmacologic inhibition of ITK prevented the activation of this signaling axis and overcame chemotherapy resistance. Clin Cancer Res; 23(10); 2506-15. ©2016 AACR.


Conflict of interest statement

Conflict-of-interest disclosure: The authors declare no conflict of interest.

Figures

Figure 1
Figure 1
The TCR stimulates proliferation and activates gene expression in T-cell lymphomas. (A) Primary TCL cells were cultured for 7 days in the presence or absence of autologous monocytes with an isotype control (iso) or blocking MHC class II antibody (anti-class II), as indicated. TCL proliferation was determined by Ki67 expression, and the percentage of CD4+CD7 TCL cells that were Ki67+ is indicated in the gates shown in a representative FACS analysis (SS, side scatter). (B) TCL proliferation in the presence of autologous monocytes was independently determined (n=4) and was expressed as the fold increase in Ki67 expression compared with TCL cells cultured alone (mean ± s.e.m.). (C) The primary TCL cell line T8ML-1 and primary TCL cells were cultured in the presence (1:1 ratio) or absence of anti-CD3/CD28 beads and proliferation determined by Ki67 expression, as indicated in the representative examples shown. (D) The percentage of Ki67+ TCL cells (mean ± s.e.m.) cultured alone (open histogram) or with beads (gray histogram) is shown for T8ML-1 (in technical replicates) and for primary TCL cells (n=3). (E) Unsupervised hierarchical clustering highlighting changes (log2 transformed fold-change) in gene expression over time upon bead stimulation is shown for 3 TCL patients (Sezary syndrome=2, PTCL, NOS=1). (F) Venn diagram showing substantial overlap in differentially expressed genes among the 3 TCL patients examined. (*p<0.05, **p<0.01, ***p<0.001)
Figure 2
Figure 2
TCR engagement activates NF-κB and confers resistance to chemotherapy in T-cell lymphomas. (A) NF-κB (p65) was examined in nuclear extracts following bead stimulation in T8ML-1 and primary TCL cells. Representative western blots are shown. (B) Nuclear NF-κB (p65) DNA binding was determined following bead stimulation by ELISA in conventional T-cells (“T-cell”), in T8ML-1 and in primary TCL cells (n=4). (C) Expression of selected NF-κB target genes (NFκB1A, IL2Rα, TNF) was examined by qRT-PCR following bead stimulation. The relative increase (compared with unstimulated cells) in mRNA for normal T cells, T8ML-1, and primary TCL cells (n=2) is shown. (D) T8ML-1 cells and primary TCL specimens (n=3) were cultured with romidepsin (2 nM) or vincristine (6 nM) in the presence or absence of CD3/CD28 beads, as indicated, and cell viability determined 48 hours later in a standard MTT assay and reported as relative to control cells (neither treated with CD3/CD28 beads nor chemotherapy). (*p<0.05, **p<0.01, ***p<0.001)
Figure 3
Figure 3
Chemotherapy resistance following TCR engagement is ITK dependent. (A, B) T8ML-1 cells (wt) were lentivirally transduced with either nontargeting (scr) or ITK specific shRNA (I4, I5). Cells were cultured in the presence (solid line) or absence (dashed line) of beads in the presence of vincristine (A) or romidepsin (B) and viability determined 48 hours later (mean ± s.e.m.). (C) Primary TCL cells were cultured with beads, romidepsin (2 nM), and/or ibrutinib (1 µM), as indicated, and viability determined 48 hours later. Pooled data from 5 independent patients is shown. (D) T8–28 cells were adoptively transferred into Balb/c recipient mice and lymphoma-bearing mice treated with cyclophosphamide, vincristine, and ibrutinib or vehicle control, as indicated, and spleen and liver weights determined. Pooled data from two independent experiments is shown. (*p<0.05, **p<0.01, ***p<0.001)
Figure 4
Figure 4
TCR-mediated chemotherapy resistance is GATA-3 dependent. (A, B) T8ML-1 and primary TCL cells were activated with beads for 24 hours and GATA-3 expression in unstimulated (light gray histogram) and bead stimulated (dark gray histogram) cells determined by FACS analysis (isotype control, open histogram). Representative examples are shown in (A), and data obtained from 5 TCL patients summarized in (B). (C, D) TCL cells were activated in the presence of ibrutinib (1 µM) or vehicle control (DMSO) and GATA-3 expression determined in resting and bead stimulated cells. Representative examples are shown in (C) and data from 3 TCL patients summarized in (D). (E) T8ML-1 cells (wt) were transduced with either nontargeting (scr) or GATA-3 specific shRNA (G3, G5). Cells were cultured with or without beads, as indicated, in the presence of vincristine (6 nM). Cell viability was determined 48 hours later, and is reported relative to cells cultured without vincristine. The fold increase in viability between unstimulated and bead stimulated cells is shown below the x-axis. (F) GATA-3 was overexpressed in T8ML-1 transduced with ITK-targeting shRNA (I4, I5) following transduction with a vector containing full-length GATA-3 (GATA-3) or an empty vector (EV) control. Cells were cultured alone, or in the presence of vincristine (6 nM), and viability determined 48 hours later. Viability is reported relative to cells cultured without vincristine. (*p<0.05, **p<0.01, ***p<0.001 in unpaired two-sided Student t-test)
Figure 5
Figure 5
GATA-3 confers resistance to chemotherapy in T-cell lymphomas. (A, B) The CTCL cell lines H9 and MyLa were transduced with nontargeting (scr) or GATA-3-targeting shRNA (19301). H9 (in A) and MyLa (in B) were cultured with or without vincristine (VCR) and cell viability (reported as a percent of untreated cells) determined 48 hours later. (C) H9 transduced with nontargeting (scr, ○/●) or GATA-3-targeting shRNA’s 273991 (◊/♦) or 19301 (△/▲), were injected subcutaneously into the shoulders and flanks of NSG mice. Following tumor engraftment, mice were either untreated (closed symbols) or treated with weekly cyclophosphamide and vincristine (as indicated by the arrows) and tumor volumes determined (n=12). (D) In a similar fashion, NSG mice were engrafted with MyLa cells transduced with nontargeting (scr, ○/●) or GATA-3-targeting shRNA 19301 (△/▲) and either untreated (closed symbols) or treated with single-agent vincristine (as indicated by the arrows) and tumor volumes determined. (E) H9 19301 tumors previously treated with cyclophosphamide/vincristine subsequently relapsed (shown in C) and were analyzed for GATA-3 expression by immunohistochemistry (“post-treatment”). For comparison, GATA-3 expression in established H9 scramble, 273991, and 19301 tumors (“pre-treatment”) is shown at left. (F, G) The extent of GATA-3 expression was determined by immunohistochemistry in serial patient biopsies obtained at the time of diagnosis and at the time of relapse after treatment (representative example shown in F). GATA-3 expression, as a percentage of total TCL cells, in paired samples (n=5) is shown (G). (H) PTCL, NOS patients treated with CHOP or CHOEP were stratified by GATA-3 expression, and the rate of primary refractory disease reported (mean ± 95% CI is shown). (*p<0.05, **p<0.01, ***p<0.001)

References

    1. Vose J, Armitage J, Weisenburger D. International peripheral T-cell and natural killer/T-cell lymphoma study: pathology findings and clinical outcomes. J Clin Oncol. 2008;26:4124–4130. - PubMed
    1. Briski R, Feldman AL, Bailey NG, Lim MS, Ristow K, Habermann TM, et al. The role of front-line anthracycline-containing chemotherapy regimens in peripheral T-cell lymphomas. Blood Cancer J. 2014;4:e214. - PMC - PubMed
    1. Briski R, Feldman AL, Bailey NG, Lim MS, Ristow K, Habermann TM, et al. Survival in Patients with Limited-stage Peripheral T-cell Lymphomas. Leuk Lymphoma. 2014:1–17. - PMC - PubMed
    1. Mak V, Hamm J, Chhanabhai M, Shenkier T, Klasa R, Sehn LH, et al. Survival of patients with peripheral T-cell lymphoma after first relapse or progression: spectrum of disease and rare long-term survivors. J Clin Oncol. 2013;31:1970–1976. - PubMed
    1. Wilcox RA, Wada DA, Ziesmer SC, Elsawa SF, Comfere NI, Dietz AB, et al. Monocytes promote tumor cell survival in T-cell lymphoproliferative disorders and are impaired in their ability to differentiate into mature dendritic cells. Blood. 2009;114:2936–2944. - PMC - PubMed

MeSH terms