. 2017 Jan;37(1):52-68.
doi: 10.1177/0271678X16671146. Epub 2016 Oct 10.

The capillary bed offers the largest hemodynamic resistance to the cortical blood supply

Affiliations

The capillary bed offers the largest hemodynamic resistance to the cortical blood supply

Ian Gopal Gould et al. J Cereb Blood Flow Metab. 2017 Jan.

Abstract

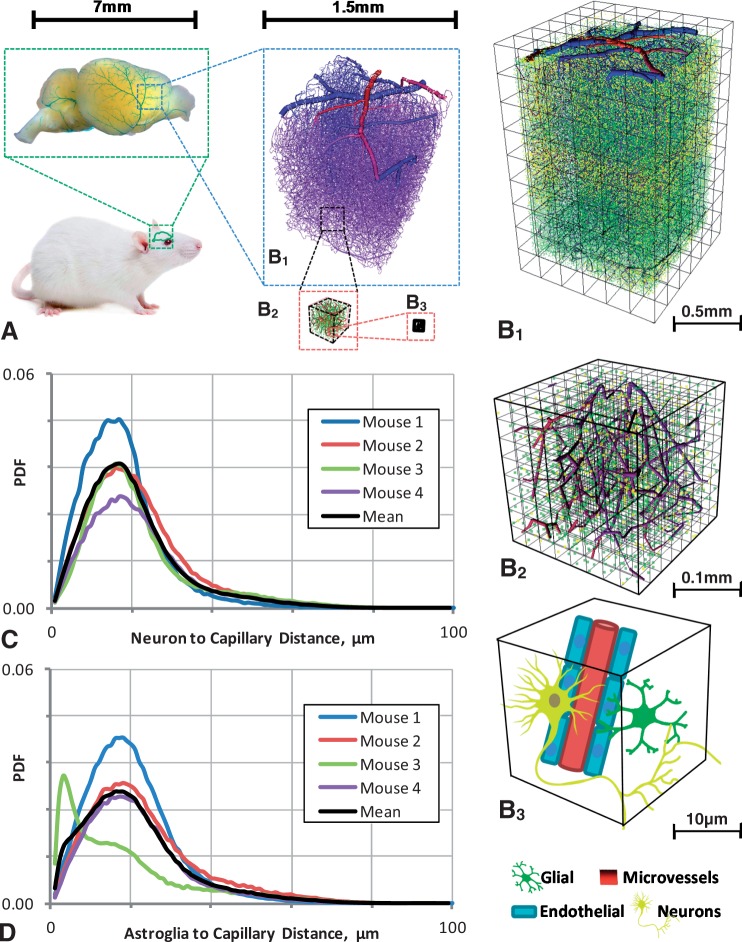
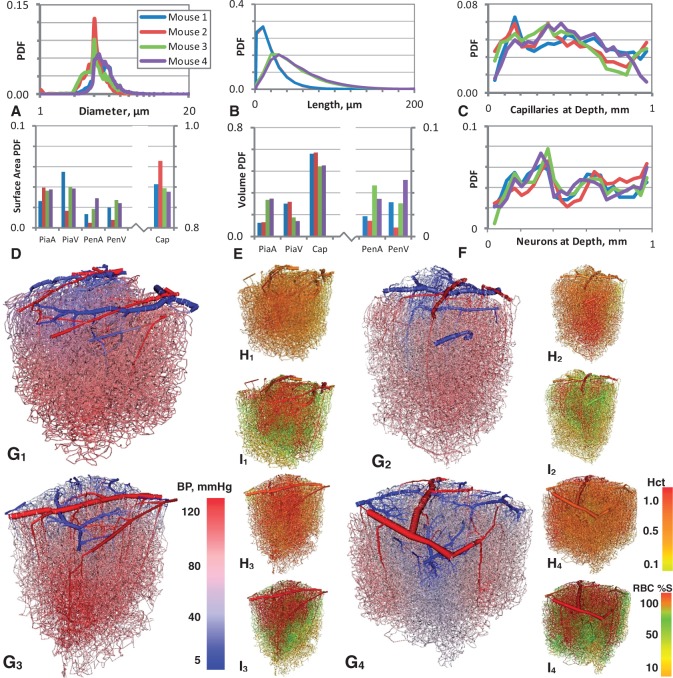
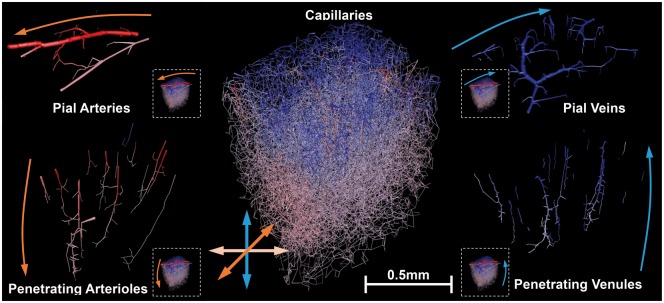
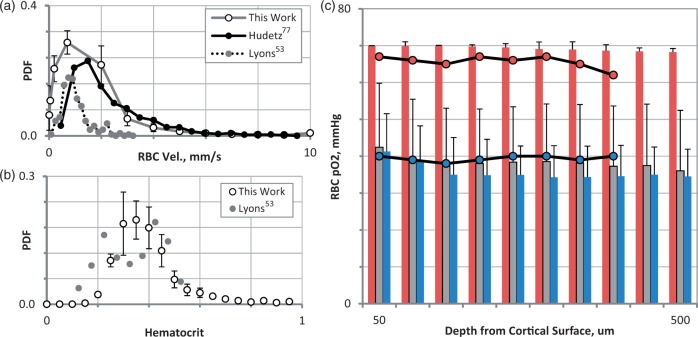
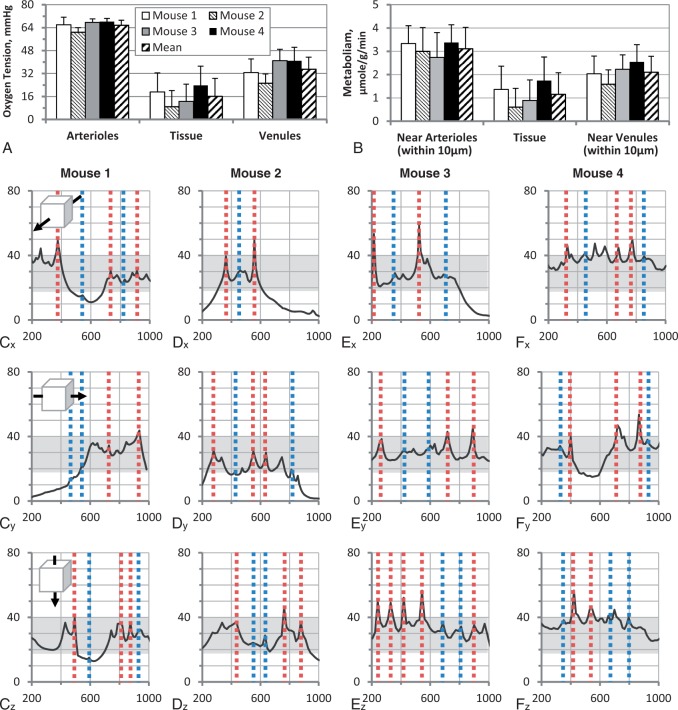
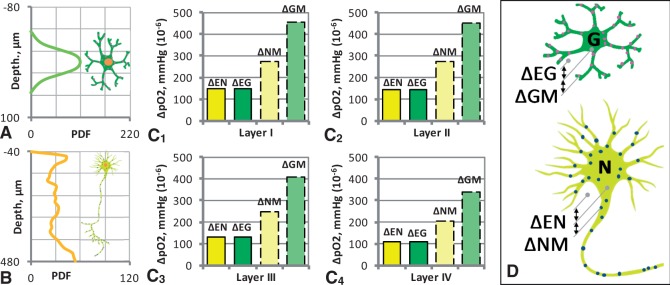
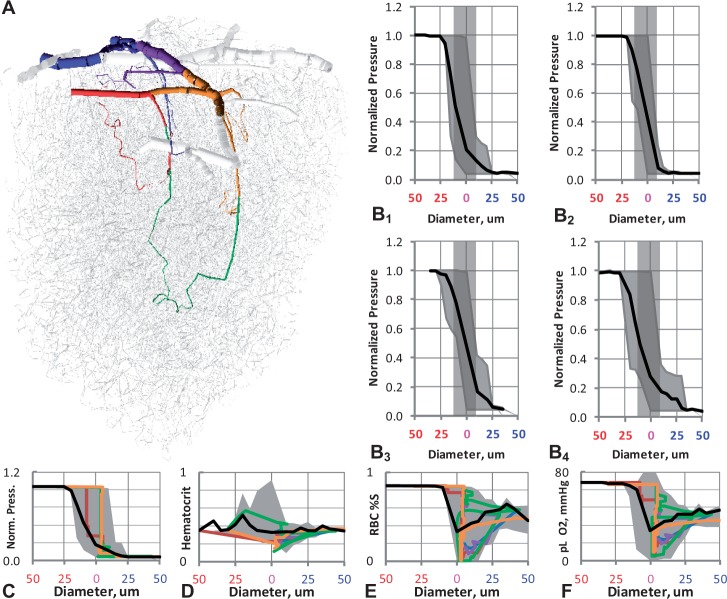
The cortical angioarchitecture is a key factor in controlling cerebral blood flow and oxygen metabolism. Difficulties in imaging the complex microanatomy of the cortex have so far restricted insight about blood flow distribution in the microcirculation. A new methodology combining advanced microscopy data with large scale hemodynamic simulations enabled us to quantify the effect of the angioarchitecture on the cerebral microcirculation. High-resolution images of the mouse primary somatosensory cortex were input into with a comprehensive computational model of cerebral perfusion and oxygen supply ranging from the pial vessels to individual brain cells. Simulations of blood flow, hematocrit and oxygen tension show that the wide variation of hemodynamic states in the tortuous, randomly organized capillary bed is responsible for relatively uniform cortical tissue perfusion and oxygenation. Computational analysis of microcirculatory blood flow and pressure drops further indicates that the capillary bed, including capillaries adjacent to feeding arterioles (d < 10 µm), are the largest contributors to hydraulic resistance.

Keywords: Mathematical modelling; blood–brain barrier; cerebral blood flow; cerebral hemodynamics; microcirculation.


Figures

Figure 1.
Figure 1.
Vectorized data of the multi-scale vascular and cellular morphology of the mouse cerebral cortex. (a) Illustration of the multi-scale resolution of the murine cerebral vasculature from the cortical surface vessels down to the cellular level. (whole brain snapshot taken from the NIH supported KOMP Phenotyping Pilot project). (b) Full view of the microvascular network with cerebral arterioles in red, draining veins in blue, and capillaries in purple. Neuronal cells are displayed in yellow and glial cells in green at the 0.5 mm resolution. (Frames B1 to B3 show data in increasing magnification B1. 1.0 mm × 1.0 mm × 1.2 mm, B2. 200 µm × 200 µm × 200 µm, and B3. 25 µm × 25 µm × 25 µm. At the finest resolution in B3, cell bodies of neurons and glial cells were added for clarity). Histogram of cell to capillary distance for (c) neurons and (d) glial cells.
Figure 2.
Figure 2.
Statistical analysis of the four primary somatosensory cortical mouse data sets with superimposed hemodynamic simulation results. Probability density functions of anatomical parameters: (a) vessel diameter, (b) vessel length, and (c) the number of capillaries located at a given depth. Distributions for pial arteries (PiaA), pial veins (PiaV), penetrating arterioles (PenA), penetrating venules (PenV) and capillaries (Cap) with respect to (d) surface area, and (e) lumen volume fraction. (f) Probability density function of neuronal density at a given depth. (g-i) Computational results for blood pressure, hematocrit, and RBC saturation. Color-coding for (g) blood pressure from red (120 mmHg) to blue (5 mmHg), (h) hematocrit from orange (0.99) to green (0.11), and (i) RBC saturation from red (90%) to orange (10%).
Figure 3.
Figure 3.
Depiction of the anatomical hierarchy of arterial, venous, and capillary microvessels in the primary somatosensory cortex for the first data set. Vessels are painted in colors corresponding to the blood pressure depicting arteries in red and veins in blue. Large surface pial vessels distribute blood along the surface of the cortex, and feed penetrating arterioles. Penetrating arterioles divert blood into deeper cortical layers. The capillary bed distributes blood uniformly in all directions. Venules collect the blood from the capillary bed and return it to the cortical surface. Pial veins convey the venous blood from the surface to the sinuses.
Figure 4.
Figure 4.
Comparison of predicted hematocrit distribution, RBC velocity, and RBC oxygen tension to measured data. (a) The predicted capillary RBC velocity matches measurements acquired with high-speed camera laser-scanning confocal microscopy. Both simulation and experiment show that more than 88% of RBCs travel at speeds below 2 mm/s. (b) The PDF for capillary hematocrit shows that the majority of capillaries have a hematocrit between 0.25 and 0.50 comparing well to two-photon measurements. (c) Mean RBC oxygen tension at different depths from the cortical surface (50-500 µm). Bars indicate arterial (red), capillary (gray), and venous (blue) RBC oxygen tension compared to measured data drawn as lines with connected dots in red for arteries and veins in blue.
Figure 5.
Figure 5.
Oxygen tension in the murine cortical tissue. (a)Average oxygen tension in the arterioles, tissue, and venules in all four data sets, standard deviation as capped lines. The tissue is an oxygen sink and therefore lowers than both arteries and veins. (b) Oxygen metabolism as a function of proximity to penetrating vessel. Oxygen tension along a ray passing through the center of each of the four data sets (c–f) in the x-direction, y-direction, and z-direction. Dotted vertical lines illustrate the position of penetrating arterioles (red) and penetrating venules (blue), gray box indicates experimentally measured oxygen tension in the murine cortex (18–40 mmHg).
Figure 6.
Figure 6.
Predicted tissue, cellular, and intercellular oxygen gradients. Mitochondria were spatially distributed to different location with the respect to the cell nucleus according to a cell-specific PDF: (a) PDF for mitochondria location around glial nucleus (x = 0 mm) (b) PDF of mitochondria in neurons. C1-C4. Oxygen tension gradient between ECS and neuronal cytoplasm (ΔEN), neuronal cytoplasm and mitochondria (ΔNM), ECS and glial cell cytoplasm (ΔEG), and glial cell cytoplasm to glial mitochondria (ΔGM) are reported for cortical layers I-IV. (d) Illustration of the differences between the ECS, neuronal cell cytoplasm (N), glial cell cytoplasm (G), and mitochondrial oxygen tension.
Figure 7.
Figure 7.
Path analysis in a representative data set (mouse one). (a)Anatomy of the cortical microcirculation with five typical flow paths. Each path follows the blood flow from an inlet pial artery through the capillary bed returning to the surface via draining venules. B1–B4. Mean pressure paths and range of microcirculatory blood pressure shown for all four data sets. Light gray shaded box indicates the capillary bed (vessels with diameter < 10 µm), where the main pressure drop occurs. This shaded region includes pre-capillary arterioles, capillaries, and post-capillary venules. (c-f) The computed hemodynamic trajectory of each flow path is reported for (c) blood pressure, (d) discharge hematocrit, (e) RBC saturation, and (f) plasma pO2. Upper and lower ranges of all paths (only five individual paths are shown) are drawn as a gray shaded region, illustrating the heterogeneity of the capillary bed. Averages of all paths are drawn as a black line. Note that averages do not well characterize the wide variety of hemodynamic state transitions that occur in the capillary bed.
None
None
None

References

    1. Devor A, Sakadzic S, Saisan PA, et al. “Overshoot” of O(2) is required to maintain baseline tissue oxygenation at locations distal to blood vessels. J Neurosci 2011; 31: 13676–13681. - PMC - PubMed
    1. Hudetz AG. Blood flow in the cerebral capillary network: a review emphasizing observations with intravital microscopy. Microcirculation 1997; 4: 233–252. - PubMed
    1. Boas DA, Jones SR, Devor A, et al. A vascular anatomical network model of the spatio-temporal response to brain activation. Neuroimage 2008; 40: 1116–1129. - PMC - PubMed
    1. Kaufmann AM, Firlik AD, Fukui MB, et al. Ischemic core and penumbra in human stroke. Stroke 1999; 30: 93–99. - PubMed
    1. Nishimura N, Schaffer CB, Friedman B, et al. Penetrating arterioles are a bottleneck in the perfusion of neocortex. Proc Natl Acad Sci U S A 2007; 104: 365–370. - PMC - PubMed

Publication types