. 2016 Nov 22;7(47):77749-77763.
doi: 10.18632/oncotarget.12793.

The somite-secreted factor Maeg promotes zebrafish embryonic angiogenesis

Affiliations

The somite-secreted factor Maeg promotes zebrafish embryonic angiogenesis

Xin Wang et al. Oncotarget. .

Abstract

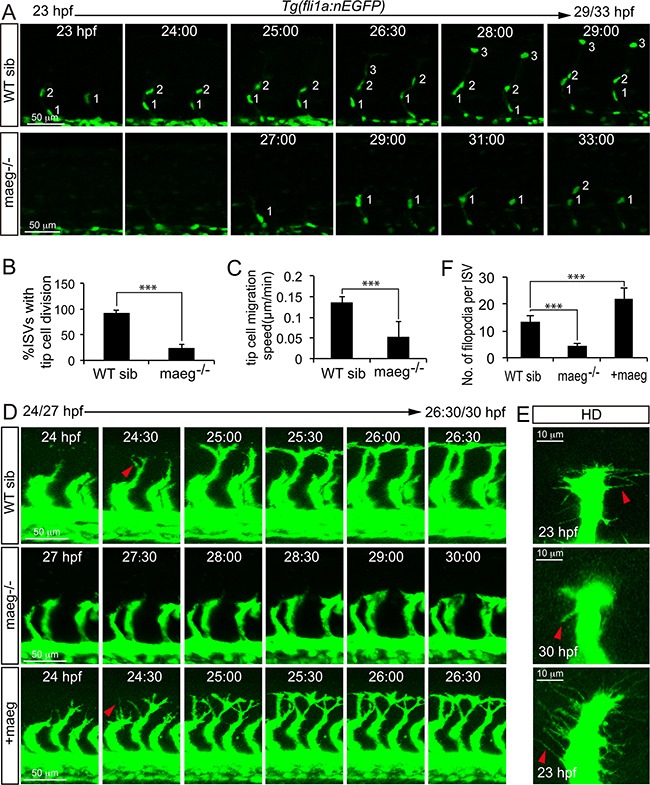
MAM and EGF containing gene (MAEG), also called Epidermal Growth Factor-like domain multiple 6 (EGFL6), belongs to the epidermal growth factor repeat superfamily. The role of Maeg in zebrafish angiogenesis remains unclear. It was demonstrated that maeg was dynamically expressed in zebrafish developing somite during a time window encompassing many key steps in embryonic angiogenesis. Maeg loss-of-function embryos showed reduced endothelial cell number and filopodia extensions of intersegmental vessels (ISVs). Maeg gain-of-function induced ectopic sprouting evolving into a hyperbranched and functional perfused vasculature. Mechanistically we demonstrate that Maeg promotes angiogenesis dependent on RGD domain and stimulates activation of Akt and Erk signaling in vivo. Loss of Maeg or Itgb1, augmented expression of Notch receptors, and inhibiting Notch signaling or Dll4 partially rescued angiogenic phenotypes suggesting that Notch acts downstream of Itgb1. We conclude that Maeg acts as a positive regulator of angiogenic cell behavior and formation of functional vessels.

Keywords: Maeg; Notch; angiogenesis; integrin; zebrafish.


Conflict of interest statement

CONFLICTS OF INTEREST

The authors declare that they have no conflict of interest.

Figures

Figure 1
Figure 1. Maeg dynamically expressed in zebrafish developing somite
Expression of maeg was analyzed by whole mount in situ hybridization and whole mount antibody staining. A. 1-cell, lateral view, no staining. B. 30% epiboly, lateral view, no staining. C. 10 hpf, lateral view, no staining. D. 12 hpf, lateral view, arrow indicates somite. D’. 12 hpf, lateral view, arrows indicate somite. E. 15 hpf, lateral view, arrow indicates somite. F. 22 hpf, lateral view, arrow indicates somite. G. 26 hpf, lateral view, arrow indicates somite, square in dash line indicates the magnified region in G’. red line indicates the section position G’’, G’’’. 26 hpf, dorsal view, arrows indicate myotomes. H. 30 hpf, lateral view, arrow indicates somite, square in dash line indicates the magnified region in H’, I. 48 hpf, lateral view, arrow indicates somite, square in dash line indicates the magnified region in I’, J. 60 hpf, lateral view, arrow indicates somite. K. 26 hpf, lateral view, arrowheads indicate somites, arrows indicate somite borders.
Figure 2
Figure 2. Generation of zebrafish maeg mutant using TALENs
A. Schematic diagram showing TALEN targeting site on the first exon of maeg gene. Starting codon (ATG) site is indicated by arrow. The left and right TALEN targeting sites are highlighted in purple. B. Mutation pattern of TALEN-injecting embryos. Numbers in the brackets show the number of nucleotides were deleted (−) or inserted (+). Inserted nucleotide is in red. WT, wild-type. C. Three heritable mutants were identified by screening. F0 founder fish were out-crossed with WT fish to produce F1, and the DNA extracted from tail fins of F1 adults were used for identification of heritable mutants by sequencing. D. Schematic diagram showing the predicted proteins encoded by the three mutated alleles. The mutants are reading frameshift mutations that result in truncated proteins. The gray rectangles indicate the wrong coded amino acid sequences.
Figure 3
Figure 3. maeg loss of function results in the blood vessel morphogenesis defects in zebrafish embryos
A. Confocal imaging analysis of trunk vascular and somital morphology in WT, maeg−/− and maeg morphants Tg(kdrl:EGFP) embryos at 30 hpf. Red and white square brackets indicate the lumen of the DA and PCV, respectively. DA, dorsal aorta; PCV, posterior cardinal vein; and DLAV, dorsal longitudinal anastomotic vessel. B. The statistics of ISV length in WT, maeg−/− and maeg morphants. One-Way ANOVA; ***,P<0.001. C. The statistics of DA and PCV lumen size at 30 hpf. Error bars indicate stdev.
Figure 4
Figure 4. Maeg overexpression causes excessive branching
A. Confocal imaging analysis of trunk vascular morphology in control and maeg/mCherry mRNA mixture injected Tg(kdrl:EGFP) embryos at 48 hpf. Yellow arrowhead indicates the aberrant vessel connected two adjacent ISVs. Blue arrowheads indicate Y-shaped ISVs. B. The statistics of hyperbranching sprouts in maeg up-regulated embryos. C-E. The statistics of ISV, DA and PCV lumen size at 48 hpf. Error bars indicate s.e.m. F. Morphology of subintestinal vessel (SIVs) in 72 hpf Tg(fli1a:EGFP) embryos injected with control mRNA or maeg mRNA. G. The statistics of branch point number. Student's t-test; ***,P<0.001. H. Quantification of ECs nuclei number in SIVs. Student's t-test; ***,P<0.001. I. Confocal imaging analysis of ISVs morphology in control and maeg mRNA injected Tg(kdrl:EGFP) embryos at 48 hpf. Red arrowheads indicate knot-like structures. Blue arrowheads indicate angiogenic sprouts.
Figure 5
Figure 5. Maeg regulates ISV tip cell behaviors
A. Still images from in vivo time-lapse imaging analysis of WT and maeg−/−Tg(fli1a:nEGFP) embryos. Time (hpf) is noted in the top. Nuclei of ISVs are numbered. B. Percentage of ISVs with tip cell division in control embryos and maeg−/− embryos. Student's t-test; ***,P<0.001. C. Migration speed of ISV tip cells. Mann Whitney U-test; ***,P<0.001. D. Still images from in vivo time-lapse imaging analysis of ISV tip cell filopodia in Tg(kdrl:EGFP) embryos. Time (hpf) is noted in the bottom. Red arrowheads indicate filopodia extensions. E. Confocal imaging analysis of ISV tip cell filopodia in Tg(kdrl:EGFP) embryos with HD detection setting. Red arrowheads indicate filopodia extensions. F. ISV tip cell filopodia number in per ISVs. One-Way ANOVA; ***, P<0.001.
Figure 6
Figure 6. Maeg regulates angiogenesis dependent on RGD domain
A. The diagram of Maeg protein with RGD domain and Maeg protein with RGD domain mutated to RGE domain (MaegΔRGD). B. Confocal images of ISVs in control embryos, maeg morphants, maeg morphants treated with DAPT, and maeg morphants coinjected with dll4 MO using Tg(kdrl:EGFP) transgenic embryos. C. Percentage of embryos with ISV defect in each group. χ2 test; ***, P<0.001. D, E. Phosphorylation levels of ERK and Akt determined by Western blot analysis in maeg loss- and gain-of-function embryos. F. Confocal images of ISVs in control embryos, maeg mutants, itgb1a morphants, and itgb1a morphants coinjected with maeg mRNA using Tg(kdrl:EGFP) transgenic embryos. G. Percentage of embryos with ISV defect in each group.
Figure 7
Figure 7. The phenotype of maeg and itgb1 loss-of-function involves Notch signaling
A. Whole mount in situ hybridization analysis of zebrafish embryos using antisense notch1a, notch1b, notch2, notch3, jag1a, jag1b, and jag2b probes. 30 hpf, lateral view. Blue arrowheads indicate the notochord position. Red arrowheads indicate the trunk vessel position. B. Confocal images of ISVs in control embryos, maeg morphants, maeg morphants treated with DAPT, and maeg morphants coinjected with dll4 MO using Tg(kdrl:EGFP) transgenic embryos. The red and white dash lines indicate the position of dorsal roof and horizontal myoseptum respectively. C. The statistics of ISV length in 30 hpf control embryos, maeg morphants, maeg morphants treated with DAPT, and maeg morphants coinjected with dll4 MO. One-Way ANOVA; ***,P<0.001. D. Confocal imaging analysis of endothelial numbers of ISVs in 30 hpf control embryos, maeg morphants, maeg morphants treated with DAPT, and maeg morphants coinjected with dll4 MO using Tg(fli1a:EGFP) transgenic embryos. Nuclei of ISVs are numbered. E. Quantification of ECs nuclei number in ISV. Measurements were made from three adjacent ISVs (over yolk) per embryo from 3 independent experiments. One-Way ANOVA; ***,P<0.001. F. Confocal images of ISVs in control embryos, itgb1a morphants, and itgb1a morphants coinjected with dll4 MO using Tg(kdrl:ras-mCherry::fli1a:nEGFP) transgenic line at 30 hpf. G. Quantification of ECs nuclei number in ISV. Measurements were made from three adjacent ISVs (over yolk) per embryo from 3 independent experiments. One-Way ANOVA; ***,P<0.001. H. The statistics of ISV length. One-Way ANOVA; ***,P<0.001.
Figure 8
Figure 8. A working model for the function of Maeg in angiogenesis
Binding of Maeg to their receptors on ECs leads to activation of the PI3K/Akt and Mek/ERK signaling pathways, which are involved in angiogenesis. Maeg/Itgb1 negatively regulate Notch signaling, which inhibits angiogenesis.

References

    1. Carmeliet P, Jain RK. Angiogenesis in cancer and other diseases. Nature. 2000;407:249–257. - PubMed
    1. Hanahan D. Signaling vascular morphogenesis and maintenance. Science. 1997;277:48–50. - PubMed
    1. Carmeliet P. Mechanisms of angiogenesis and arteriogenesis. Nature medicine. 2000;6:389–395. - PubMed
    1. Buchner G, Orfanelli U, Quaderi N, Bassi MT, Andolfi G, Ballabio A, Franco B. Identification of a new EGF-repeat-containing gene from human Xp22: a candidate for developmental disorders. Genomics. 2000;65:16–23. - PubMed
    1. Appella E, Weber IT, Blasi F. Structure and function of epidermal growth factor-like regions in proteins. FEBS Lett. 1988;231:1–4. - PubMed

MeSH terms

LinkOut - more resources