

Electromechanical wave imaging (EWI) validation in all four cardiac chambers with 3D electroanatomic mapping in canines in vivo
- PMID: 27782003
- PMCID: PMC5104667
- DOI: 10.1088/0031-9155/61/22/8105
Electromechanical wave imaging (EWI) validation in all four cardiac chambers with 3D electroanatomic mapping in canines in vivo
Abstract
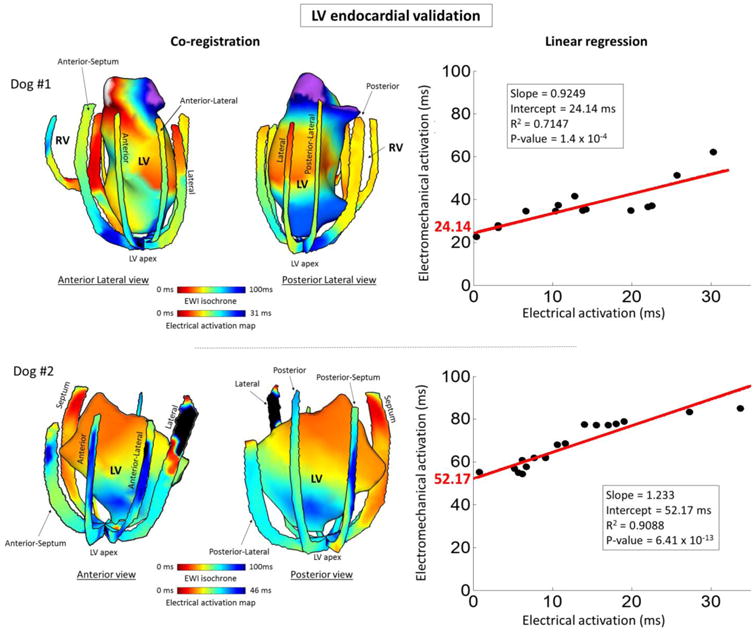
Characterization and mapping of arrhythmias is currently performed through invasive insertion and manipulation of cardiac catheters. Electromechanical wave imaging (EWI) is a non-invasive ultrasound-based imaging technique, which tracks the electromechanical activation that immediately follows electrical activation. Electrical and electromechanical activations were previously found to be linearly correlated in the left ventricle, but the relationship has not yet been investigated in the three other chambers of the heart. The objective of this study was to investigate the relationship between electrical and electromechanical activations and validate EWI in all four chambers of the heart with conventional 3D electroanatomical mapping. Six (n = 6) normal adult canines were used in this study. The electrical activation sequence was mapped in all four chambers of the heart, both endocardially and epicardially using the St Jude's EnSite 3D mapping system (St. Jude Medical, Secaucus, NJ). EWI acquisitions were performed in all four chambers during normal sinus rhythm, and during pacing in the left ventricle. Isochrones of the electromechanical activation were generated from standard echocardiographic imaging views. Electrical and electromechanical activation maps were co-registered and compared, and electrical and electromechanical activation times were plotted against each other and linear regression was performed for each pair of activation maps. Electromechanical and electrical activations were found to be directly correlated with slopes of the correlation ranging from 0.77 to 1.83, electromechanical delays between 9 and 58 ms and R 2 values from 0.71 to 0.92. The linear correlation between electrical and electromechanical activations and the agreement between the activation maps indicate that the electromechanical activation follows the pattern of propagation of the electrical activation. This suggests that EWI may be used as a novel non-invasive method to accurately characterize and localize sources of arrhythmias.
Figures


Similar articles
-
A clinical feasibility study of atrial and ventricular electromechanical wave imaging.Heart Rhythm. 2013 Jun;10(6):856-62. doi: 10.1016/j.hrthm.2013.02.028. Epub 2013 Feb 27. Heart Rhythm. 2013. PMID: 23454060 Free PMC article.
-
Validation of electromechanical wave imaging in a canine model during pacing and sinus rhythm.Heart Rhythm. 2016 Nov;13(11):2221-2227. doi: 10.1016/j.hrthm.2016.08.010. Epub 2016 Aug 4. Heart Rhythm. 2016. PMID: 27498277 Free PMC article.
-
Imaging the electromechanical activity of the heart in vivo.Proc Natl Acad Sci U S A. 2011 May 24;108(21):8565-70. doi: 10.1073/pnas.1011688108. Epub 2011 May 13. Proc Natl Acad Sci U S A. 2011. PMID: 21571641 Free PMC article.
-
Imaging the Propagation of the Electromechanical Wave in Heart Failure Patients with Cardiac Resynchronization Therapy.Pacing Clin Electrophysiol. 2017 Jan;40(1):35-45. doi: 10.1111/pace.12964. Epub 2016 Dec 2. Pacing Clin Electrophysiol. 2017. PMID: 27790723 Free PMC article. Review.
-
Endoventricular electromechanical mapping-the diagnostic and therapeutic utility of the NOGA XP Cardiac Navigation System.J Cardiovasc Transl Res. 2009 Mar;2(1):48-62. doi: 10.1007/s12265-008-9080-7. Epub 2008 Dec 10. J Cardiovasc Transl Res. 2009. PMID: 20559969 Review.
Cited by
-
Reproducibility and Angle Independence of Electromechanical Wave Imaging for the Measurement of Electromechanical Activation during Sinus Rhythm in Healthy Humans.Ultrasound Med Biol. 2017 Oct;43(10):2256-2268. doi: 10.1016/j.ultrasmedbio.2017.06.019. Epub 2017 Aug 1. Ultrasound Med Biol. 2017. PMID: 28778420 Free PMC article.
-
Biventricular electromechanical dysfunction and molecular remodeling in a rat model of advanced pulmonary arterial hypertension.J Transl Med. 2025 Jul 12;23(1):787. doi: 10.1186/s12967-025-06792-w. J Transl Med. 2025. PMID: 40652243 Free PMC article.
-
Non-invasive Characterization of Focal Arrhythmia with Electromechanical Wave Imaging in Vivo.Ultrasound Med Biol. 2018 Nov;44(11):2241-2249. doi: 10.1016/j.ultrasmedbio.2018.06.006. Epub 2018 Aug 6. Ultrasound Med Biol. 2018. PMID: 30093340 Free PMC article.
-
4D cardiac electromechanical activation imaging.Comput Biol Med. 2019 Oct;113:103382. doi: 10.1016/j.compbiomed.2019.103382. Epub 2019 Aug 6. Comput Biol Med. 2019. PMID: 31476587 Free PMC article.
-
Electromechanical Cycle Length Mapping for atrial arrhythmia detection and cardioversion success assessment.Comput Biol Med. 2023 Sep;163:107084. doi: 10.1016/j.compbiomed.2023.107084. Epub 2023 May 30. Comput Biol Med. 2023. PMID: 37302374 Free PMC article.
References
-
- Mozaffarian D, Benjamin EJ, Go AS, et al. Heart Disease and Stroke Statistics—2015 Update A Report From the American Heart Association. Circulation. 2015;131(4):e29–e322. - PubMed
-
- Fuster V, O'Rourke R, Walsh R, Poole-Wilson P. Hurst's the Heart, 12th Edition (Hurst's the Heart. 12th. McGraw-Hill Professional; 2007.
-
- Yamane T, Shah DC, Peng JT, et al. Morphological characteristics of P waves during selective pulmonary vein pacing. J Am Coll Cardiol. 2001;38(5):1505–1510. - PubMed
-
- Hatala R, Weiss C, Koschyk DH, Siebels J, Cappato R, KUCK KH. Radiofrequency catheter ablation of left atrial tachycardia originating within the pulmonary vein in a patient with dextrocardia. Pacing Clin Electrophysiol. 1996;19(6):999–1002. - PubMed
-
- Lesh MD, Hare GFV, Epstein LM, et al. Radiofrequency catheter ablation of atrial arrhythmias. Results and mechanisms. Circulation. 1994;89(3):1074–1089. - PubMed
MeSH terms
Grants and funding
LinkOut - more resources
Full Text Sources
Other Literature Sources