

Flavonoids and darkness lower PCD in senescing Vitis vinifera suspension cell cultures
- PMID: 27782806
- PMCID: PMC5080730
- DOI: 10.1186/s12870-016-0917-y
Flavonoids and darkness lower PCD in senescing Vitis vinifera suspension cell cultures
Abstract
Background: Senescence is a key developmental process occurring during the life cycle of plants that can be induced also by environmental conditions, such as starvation and/or darkness. During senescence, strict control of genes regulates ordered degradation and dismantling events, the most remarkable of which are genetically programmed cell death (PCD) and, in most cases, an upregulation of flavonoid biosynthesis in the presence of light. Flavonoids are secondary metabolites that play multiple essential roles in development, reproduction and defence of plants, partly due to their well-known antioxidant properties, which could affect also the same cell death machinery. To understand further the effect of endogenously-produced flavonoids and their interplay with different environment (light or dark) conditions, two portions (red and green) of a senescing grapevine callus were used to obtain suspension cell cultures. Red Suspension cell Cultures (RSC) and Green Suspension cell Cultures (GSC) were finally grown under either dark or light conditions for 6 days.
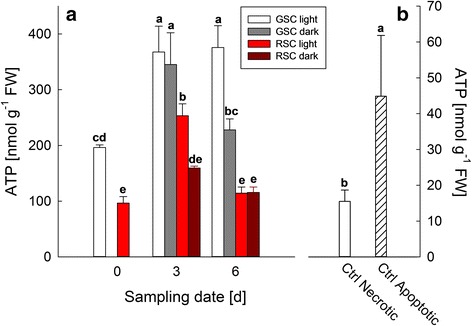
Results: Darkness enhanced cell death (mainly necrosis) in suspension cell culture, when compared to those grown under light condition. Furthermore, RSC with high flavonoid content showed a higher viability compared to GSC and were more protected toward PCD, in accordance to their high content in flavonoids, which might quench ROS, thus limiting the relative signalling cascade. Conversely, PCD was mainly occurring in GSC and further increased by light, as it was shown by cytochrome c release and TUNEL assays.
Conclusions: Endogenous flavonoids were shown to be good candidates for exploiting an efficient protection against oxidative stress and PCD induction. Light seemed to be an important environmental factor able to induce PCD, especially in GSC, which lacking of flavonoids were not capable of preventing oxidative damage and signalling leading to senescence.
Keywords: Cell cultures; Flavonoids; PCD; Senescence; Vitis vinifera.
Figures


Similar articles
-
The effect of light, phenylalanine and methyl jasmonate, alone or in combination, on growth and secondary metabolism in cell suspension cultures of Vitis vinifera.J Photochem Photobiol B. 2019 Oct;199:111625. doi: 10.1016/j.jphotobiol.2019.111625. Epub 2019 Sep 11. J Photochem Photobiol B. 2019. PMID: 31610430
-
The effect of methyl jasmonate and light irradiation treatments on the stilbenoid biosynthetic pathway in Vitis vinifera cell suspension cultures.Nat Prod Res. 2018 Apr;32(8):909-917. doi: 10.1080/14786419.2017.1367782. Epub 2017 Aug 29. Nat Prod Res. 2018. PMID: 28849673
-
Specific poly-phenolic compounds in cell culture of Vitis vinifera L. cv. Gamay Fréaux.Appl Biochem Biotechnol. 2011 May;164(2):148-161. doi: 10.1007/s12010-010-9122-x. Appl Biochem Biotechnol. 2011. PMID: 21061087
-
R2R3 MYB transcription factors: key regulators of the flavonoid biosynthetic pathway in grapevine.Protoplasma. 2012 Jun;249 Suppl 2:S109-18. doi: 10.1007/s00709-012-0380-z. Epub 2012 Feb 4. Protoplasma. 2012. PMID: 22307206 Review.
-
Plant flavonoids--biosynthesis, transport and involvement in stress responses.Int J Mol Sci. 2013 Jul 17;14(7):14950-73. doi: 10.3390/ijms140714950. Int J Mol Sci. 2013. PMID: 23867610 Free PMC article. Review.
Cited by
-
Transcriptome analysis of embryonic domains in Norway spruce reveals potential regulators of suspensor cell death.PLoS One. 2018 Mar 2;13(3):e0192945. doi: 10.1371/journal.pone.0192945. eCollection 2018. PLoS One. 2018. PMID: 29499063 Free PMC article.
-
Oxidation of polyphenols and inhibition of photosystem II under acute photooxidative stress.Planta. 2019 Nov 27;251(1):16. doi: 10.1007/s00425-019-03316-x. Planta. 2019. PMID: 31776771
-
Melatonin Delays Postharvest Senescence through Suppressing the Inhibition of BrERF2/BrERF109 on Flavonoid Biosynthesis in Flowering Chinese Cabbage.Int J Mol Sci. 2023 Feb 2;24(3):2933. doi: 10.3390/ijms24032933. Int J Mol Sci. 2023. PMID: 36769253 Free PMC article.
-
Plant Cell Cultures as a Tool to Study Programmed Cell Death.Int J Mol Sci. 2021 Feb 22;22(4):2166. doi: 10.3390/ijms22042166. Int J Mol Sci. 2021. PMID: 33671566 Free PMC article. Review.
References
-
- Buchanan-Wollaston V, Page T, Harrison E, Breeze E, Lim PO, Nam HG, Lin JF, Wu SH, Swidzinski J, Ishizaki K, et al. Comparative transcriptome analysis reveals significant differences in gene expression and signalling pathways between developmental and dark/starvation-induced senescence in Arabidopsis. Plant J. 2005;42(4):567–85. doi: 10.1111/j.1365-313X.2005.02399.x. - DOI - PubMed
-
- Guo Y, Cai Z, Gan S. Transcriptome of Arabidopsis leaf senescence. Plant Cell Environ. 2004;27(5):521–49. doi: 10.1111/j.1365-3040.2003.01158.x. - DOI
Publication types
MeSH terms
Substances
LinkOut - more resources
Full Text Sources
Other Literature Sources
Research Materials
