. 2016 Oct 26:5:e20930.
doi: 10.7554/eLife.20930.

γ-Protocadherin structural diversity and functional implications

Affiliations

γ-Protocadherin structural diversity and functional implications

Kerry Marie Goodman et al. Elife. .

Abstract

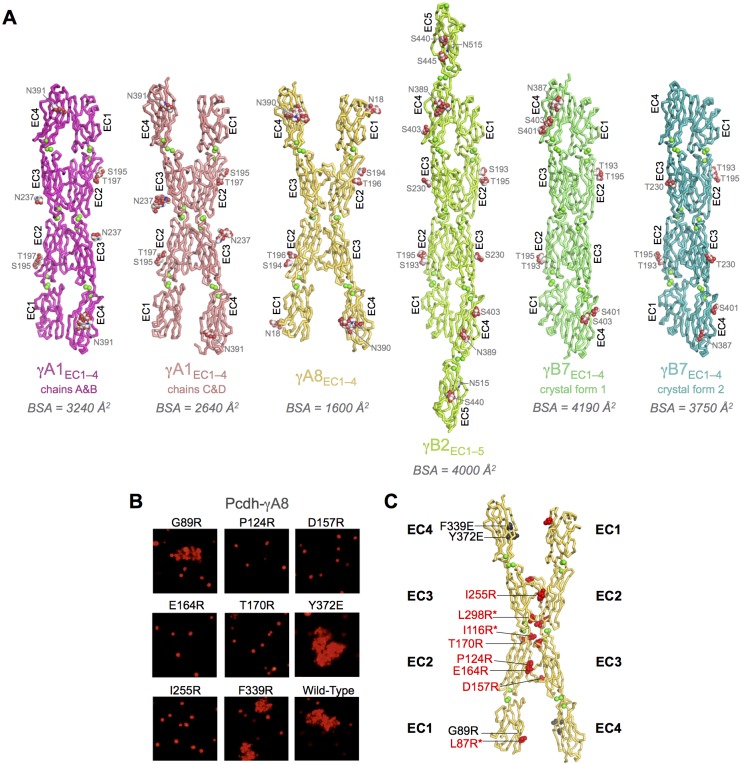
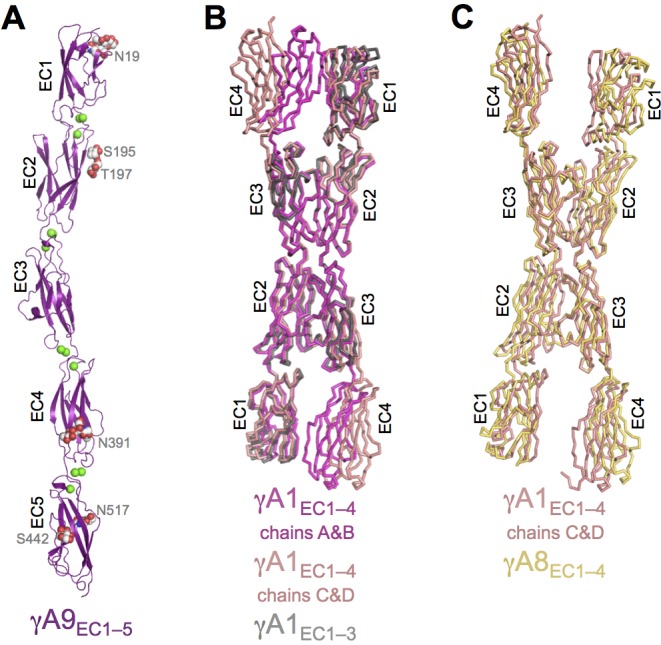
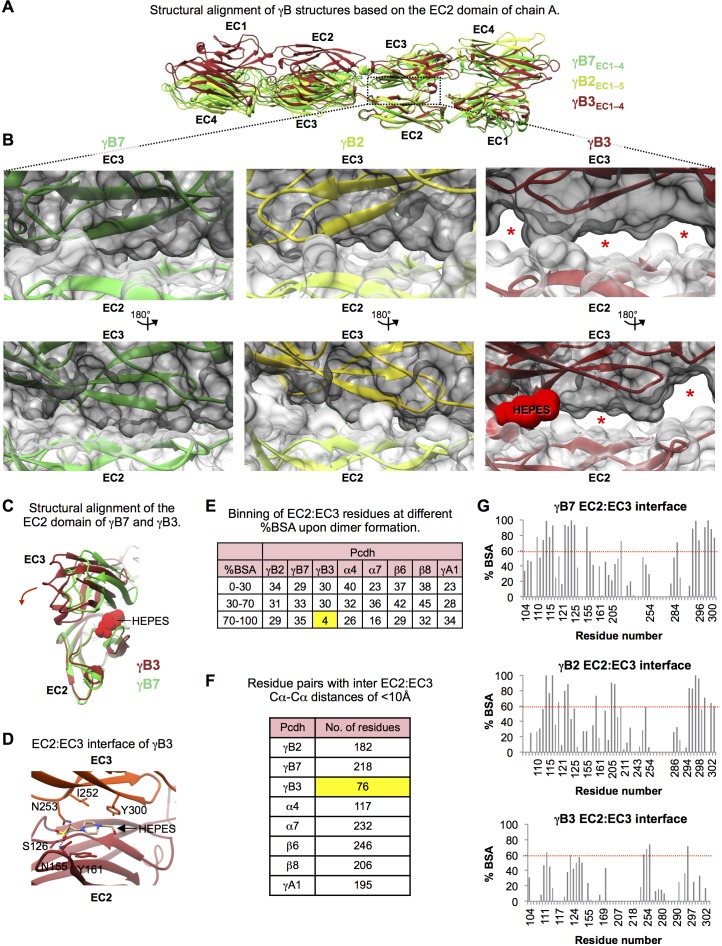
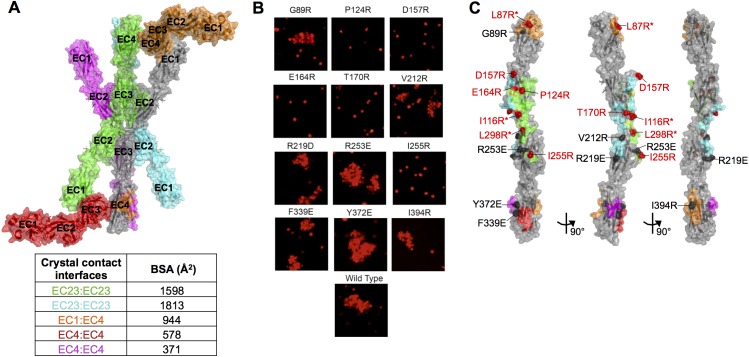
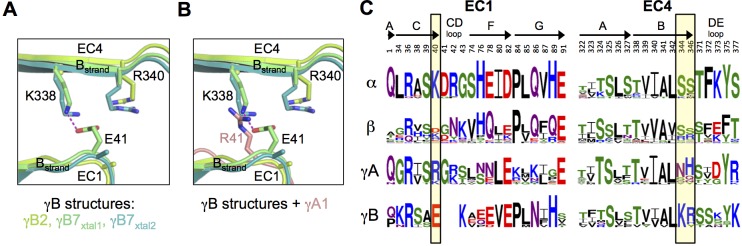
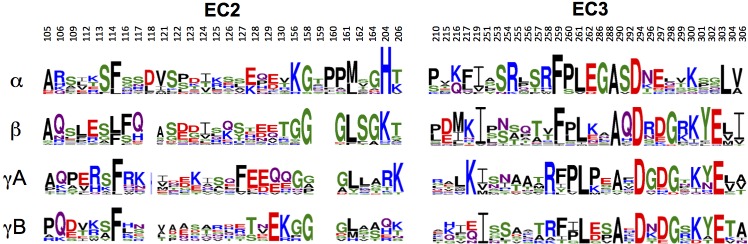
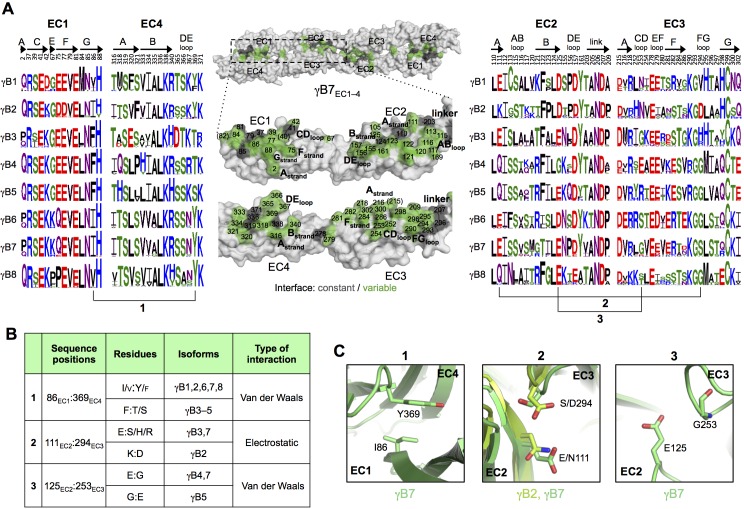
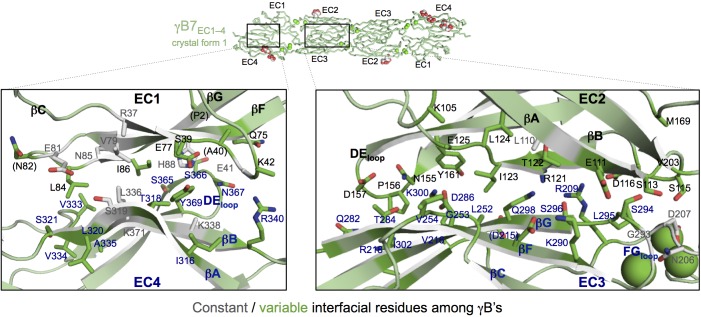
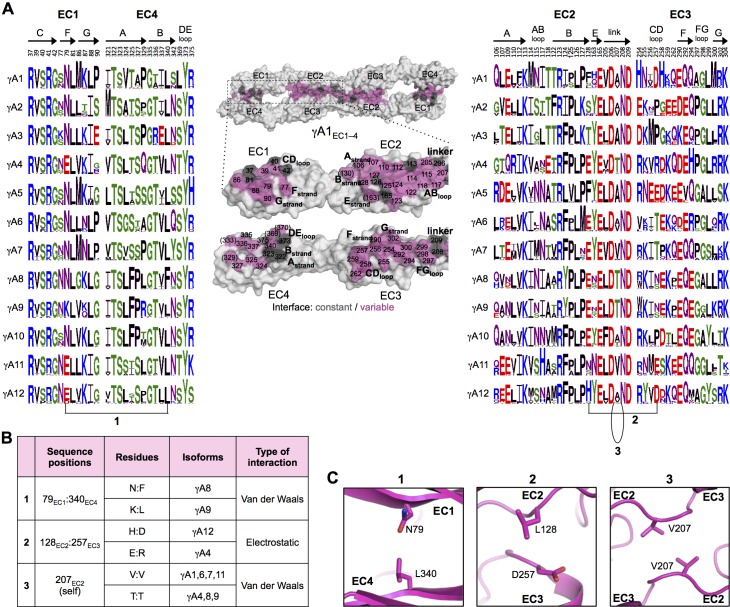
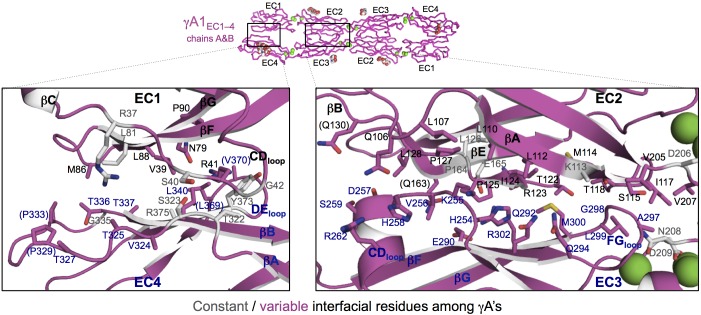
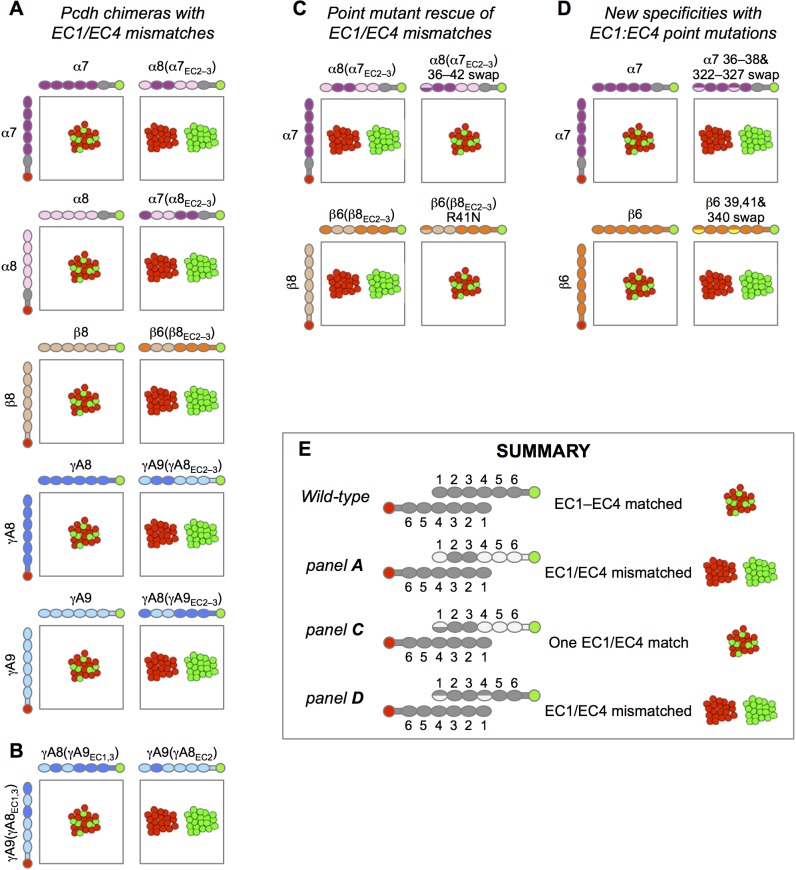
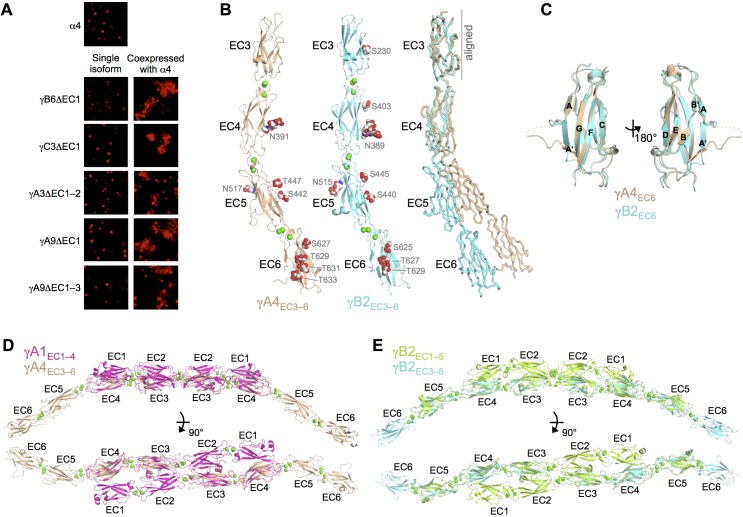
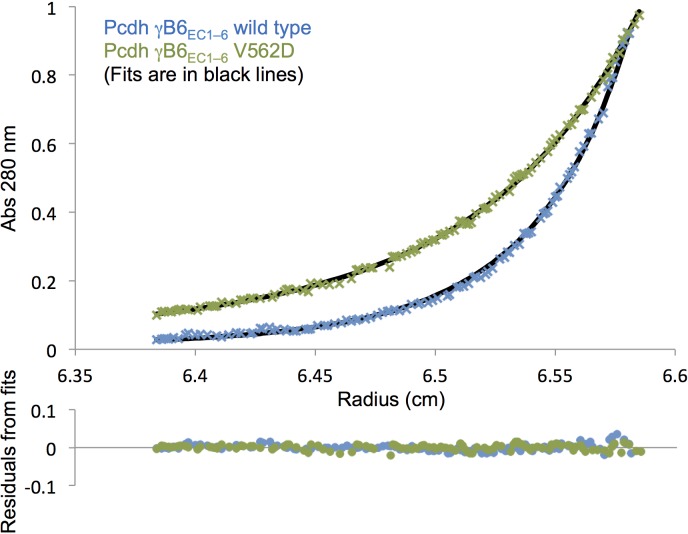
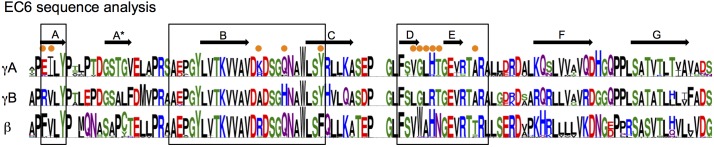
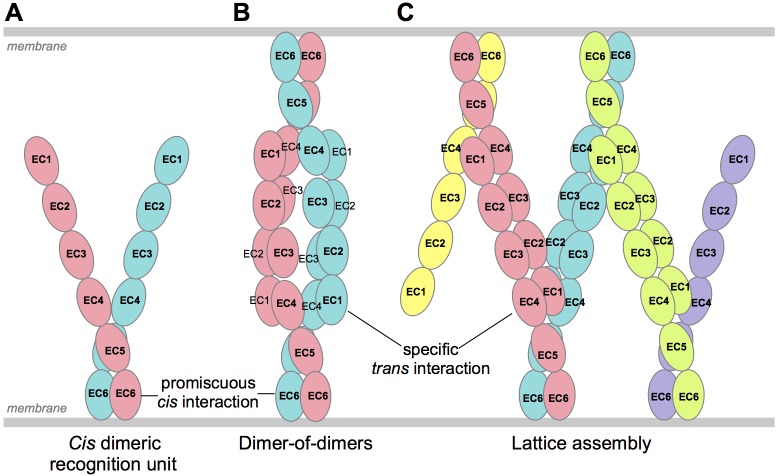
Stochastic cell-surface expression of α-, β-, and γ-clustered protocadherins (Pcdhs) provides vertebrate neurons with single-cell identities that underlie neuronal self-recognition. Here we report crystal structures of ectodomain fragments comprising cell-cell recognition regions of mouse γ-Pcdhs γA1, γA8, γB2, and γB7 revealing trans-homodimers, and of C-terminal ectodomain fragments from γ-Pcdhs γA4 and γB2, which depict cis-interacting regions in monomeric form. Together these structures span the entire γ-Pcdh ectodomain. The trans-dimer structures reveal determinants of γ-Pcdh isoform-specific homophilic recognition. We identified and structurally mapped cis-dimerization mutations to the C-terminal ectodomain structures. Biophysical studies showed that Pcdh ectodomains from γB-subfamily isoforms formed cis dimers, whereas γA isoforms did not, but both γA and γB isoforms could interact in cis with α-Pcdhs. Together, these data show how interaction specificity is distributed over all domains of the γ-Pcdh trans interface, and suggest that subfamily- or isoform-specific cis-interactions may play a role in the Pcdh-mediated neuronal self-recognition code.

Keywords: biophysics; clustered protocadherins; crystal structure; mouse; neuronal self-avoidance; neuroscience; protein diversity; protein-protein recognition; structural biology.


Conflict of interest statement

The authors declare that no competing interests exist.

Figures

Figure 1.
Figure 1.. Crystal structures of γA- and γB-Pcdh cell-cell recognition dimers.
(A) Trans-dimer structures of γA1EC1–4, γA8EC1–4, γB2EC1–5, and γB7EC1–4 fragments. The γA1EC1–4 structure contained two distinct dimers in the asymmetric unit (chain A and B in magenta and chain C and D in salmon). The structures are shown in ribbon depiction with bound calcium ions shown as green spheres. Glycosylated residues are labeled, and glycans are shown as red, white and blue spheres. The buried surface area (BSA) in each dimer (see Figure 1—source data 5), given as the change in accessible surface area over both protomers, is shown beneath each structure. (B) K562 cell aggregation assays with γA8 mutants confirm the trans-dimer interface. (C) Mutations that prevent cell aggregation are shown on the γA8 dimer structure as red spheres and those which had no effect are shown as grey spheres. *Data from Rubinstein et al. (2015). DOI: http://dx.doi.org/10.7554/eLife.20930.003
Figure 1—figure supplement 1.
Figure 1—figure supplement 1.. γA9EC1–5 monomer crystal structure and γA-Pcdh structural variability.
(A) γA9EC1–5 crystal structure with bound calciums shown as green spheres. Glycosylated residues are labeled, and the glycans are shown as red, white and blue spheres. (B) Superposition of the two γA1EC1–4 dimers in the crystal structure onto the γA1EC1–3 structure (PDB: 4ZI9) highlighting the similarity of the EC2–3 dimer region. (C) Superposition of the EC2–3 engaged γA1EC1–4 and γA8EC1–4 dimer structures. DOI: http://dx.doi.org/10.7554/eLife.20930.011
Figure 1—figure supplement 2.
Figure 1—figure supplement 2.. X-ray diffraction anisotropy of the γA9EC1–5 and γB7EC1–4 crystals.
(A) γA9EC1–5 crystal (i) UCLA Diffraction Anisotropy Server (Strong et al., 2006) output showing the data strength as measured by F/sigma along the a*, b*, and c* axes. (ii) The diffraction limits along the a*, b* and c* axes determined by three different methods: F/sigma from (i), and the correlation coefficient (CC) and I/sigma limits calculated by Aimless (Evans, 2006; Evans and Murshudov, 2013). (iii–iv) Synthetic precession photographs of the X-ray diffraction in the h = 0 plane (iii) and the l = 0 plane (iv) showing the weaker diffraction along k. (B) γB7EC1–4 crystal form 1 (i) and (ii) as above. (iii–iv) Synthetic precession photographs of the X-ray diffraction in the h = 0 plane (iii) and the k = 0 plane (iv) showing the weaker diffraction along k and h. DOI: http://dx.doi.org/10.7554/eLife.20930.012
Figure 1—figure supplement 3.
Figure 1—figure supplement 3.. Structural comparison of the EC2:EC3 interfaces observed in the γB3, γB2, and γB7 trans dimer structures.
(A) Structures of γB3 (dark red, PDB: 5K8R), γB2 (lemon), and γB7 (lime-green), superposed on their EC2 domains from one protomer. The overall head-to-tail mode of interaction is similar for all three structures, however, domain orientations within the γB3 structure are significantly different compared to both γB2 and γB7. (B) Close-up views of the EC2:EC3 interactions in the γB7 (left), γB2 (middle), and γB3 (right) structures. EC2 domains are shown in white and EC3 domains are shown in gray surface representation. Red stars highlight regions in the EC2:EC3 interface that are not in contact. These regions only appear in the γB3 structure. The HEPES molecule at the EC2:EC3 interface of γB3 is shown in red in space filling representation. (C) The relative orientations of EC2:EC3 domain interactions in γB3 (dark red) and γB7 (lime-green) are shown by superposition of their EC2 domains. The HEPES molecule at the EC2:EC3 interface of γB3 is shown in red space filling representation. The HEPES molecule contacts residues in both EC2 and EC3 of γB3. Compared to the EC3 domain of γB7, the γB3 EC3 domain is rotated as indicated by the dark red arrow. (D) Close up view of the HEPES molecule buried in the γB3 EC2:EC3 interface. The γB3 structure is shown in orange (EC3) and dark red (EC2) in cartoon representation, and the HEPES molecule is colored by element and shown in stick depiction. Side chains which interact with the bound HEPES molecule are shown. (E) EC2:EC3 interface residues from the available Pcdh trans dimer structures were binned based on their percent buried surface area (BSA) in the homodimer structures. γB3 shows a much lower number of residues with more than 70% of their surface area buried in the homophilic interaction than any other Pcdh isoform. Chains A and B were used from the γA1 structure, and the α4, α7, β6, and β8structures correspond to PDBs: 5DZW, 5DZV, 5DZX, and 5DZY. (F) Table details the number of residue pairs with a Cα-Cα distance of less than 10 Å between the bound EC2 and EC3 domains in each homodimer. γB3 shows a many fewer contacts in the EC2:EC3 interface than any other Pcdh isoform. (G) Percent buried surface area (BSA) per residue in the EC2:EC3 interfaces of the γB7, γB2, and γB3 structures. Residue numbering corresponds to γB2. Overall, similar residues are buried within all three structures. However, while for the γB2 and γB7 homodimers multiple residues bury 100% of their surface area, for the γB3 homodimer structure no residue buries more than 75% of its surface area. DOI: http://dx.doi.org/10.7554/eLife.20930.013
Figure 1—figure supplement 4.
Figure 1—figure supplement 4.. Mutagenesis experiments identifying the γA8 trans interface among the various crystal lattice contacts.
(A) Surface view of the γA8EC1–4 crystal structure showing the one molecule in the asymmetric unit (gray) with all the symmetry related molecules in the crystal. There are two distinct anti-parallel EC2–3 contacts observed between molecules in the crystal (gray:green and gray:cyan), which both have considerable buried surface areas (BSAs). The other crystal contacts are much smaller and involve EC1 and/or EC4. The EC1:EC4 interaction observed in this crystal structure (gray:orange) is distinct from the EC1:EC4 interaction observed in fully engaged Pcdh EC1–4 trans dimer structures. (B) K562 cells were transfected with PcdhγA8 mutants targeting the various crystal lattice contacts. Cell aggregation was observed for some of the mutants, indicating that they do not disrupt the PcdhγA8 recognition interface, whereas the other PcdhγA8 mutants failed to mediate cell aggregation, suggesting that the mutation was sufficient to disrupt the recognition interface. (C) Surface view of the γA8EC1–4 structure with the interfaces mediating each of the crystal lattice contacts colored to match A. Sites of mutations that disrupted the recognition interface are shown in red, and those that did not disrupt cell-cell recognition are shown in black. The mutations in EC2 and EC3 that interfered with the recognition interface were all in the green EC2–3 interface. This interacting surface matches that observed for all other Pcdh trans dimers. *Data from Rubinstein et al. (2015). DOI: http://dx.doi.org/10.7554/eLife.20930.014
Figure 2.
Figure 2.. Pcdh interfamily specificity determinants in EC1 and EC4.
(A) Close-up view of the interactions between E41, K338 and R340 (γB7 numbering) in the EC1:EC4 interface of the γB structures. (Side chains not present in the electron density maps of the respective structures were not built beyond the first carbon.) (B) Close-up view of a structural comparison between EC1 of γA1 (salmon) and γB structures. The interacting region in the γB EC4 domains are shown. While γB7 K338 forms a salt bridge with residue E41 in the γB7 homodimer, it would likely clash with γA1 R41 in a putative γA1:γB7 heterophilic complex. (C) Sequence logos of EC1:EC4 interfacial residues for each of the mouse Pcdh subfamilies excluding the divergent C-type isoforms (α, β, γA, and γB). The logos are generated from sequence alignments of all isoforms from each subfamily (see Materials and methods). Residue numbers correspond to Pcdhα7 numbering. Secondary structure elements are annotated above the logos. The black boxes highlight the sequence positions of residues participating in the γB7 EC1:EC4 salt-bridge interaction shown in A and B (E41, K338, and R340 in γB7 numbering). DOI: http://dx.doi.org/10.7554/eLife.20930.015
Figure 2—figure supplement 1.
Figure 2—figure supplement 1.. Sequence variability among Pcdh subfamilies in the interfacial regions of EC2 and EC3.
Sequence logos of EC2:EC3 interfacial residues for each of the mouse alternate isoform subfamilies (α, β, γA, and γB). The logos are generated from sequence alignments of all isoforms from each subfamily (see Materials and methods). Residue numbers correspond to Pcdhα7 numbering. DOI: http://dx.doi.org/10.7554/eLife.20930.016
Figure 3.
Figure 3.. γB-Pcdh trans-binding specificity is encoded across the entire EC1–4 interface.
(A) The central panel shows a surface view of the γB7EC1–4 dimer, with half of the two-fold symmetric interface opened out to reveal the interacting faces. Interfacial residues are labeled and colored grey if they are constant among all γB isoforms or colored green if they vary among γB isoforms. The left and right hand panels show sequence logos for interfacial residues in EC1:EC4 (left) and EC2:EC3 (right) for each of the eight γB isoforms (NB γB3 is not present in mouse). The logos are generated from sequence alignments of multiple isoform-orthologs (see Materials and methods). γB7 residue numbering and secondary structure elements are annotated above the logos. The numbered connections between residue pairs correspond to the numbered rows in B. (B) Exemplar pairs of interacting residues that show conserved differences among a subset of γB isoforms and may therefore contribute to specificity. (C) Close-up views of the three interacting residue pairs highlighted in B. Residue pairs from the γB7EC1–4 structure are shown in panels 1 and 3. Residue pairs from the γB2EC1–5 and γB7EC1–4 structure are shown in panel 2, since the identity of residues 111 and 294 varies between γB2 and γB7. DOI: http://dx.doi.org/10.7554/eLife.20930.017
Figure 3—figure supplement 1.
Figure 3—figure supplement 1.. Sequence diversity of interfacial residues among γA and γB isoforms.
Surface views of opened out γA1EC1–4 (A) and γB7EC1–4 (B) dimers with the interface residues highlighted. The majority of interfacial residues for both γA- and γB-Pcdhs vary among isoforms. γA1 EC2–3 regions are boxed since these regions are interacting in all γA1 and γA8 crystal structures. DOI: http://dx.doi.org/10.7554/eLife.20930.019
Figure 3—figure supplement 2.
Figure 3—figure supplement 2.. γB7EC1–4 dimer interface.
Close-up views of the EC1:EC4 (left) and EC2:EC3 (right) interactions in the γB7EC1–4 dimer. Interfacial residues are shown as sticks and labeled. Residues in parentheses are only marginally interfacial. Bound calcium ions are shown as green spheres. The resolution of the crystal structure is only 3.6 Å and therefore the exact positions of residues and the side chain rotamers may not be completely accurate. DOI: http://dx.doi.org/10.7554/eLife.20930.020
Figure 4.
Figure 4.. γA-Pcdh trans-binding specificity is encoded across the entire EC1–4 interface.
(A) The central panel shows a surface view of the fully engaged EC1–4 γA1 dimer, with half of the two-fold symmetric interface opened out to reveal the interacting faces. Interfacial residues are labeled and colored grey if they are constant among all γA isoforms or colored magenta if they vary among γA isoforms. The left and right hand panels show sequence logos for interfacial residues in EC1:EC4 (left) and EC2:EC3 (right) for each of the 12 mouse γA isoforms. The logos are generated from sequence alignments of multiple isoform-orthologs (see Materials and methods). Secondary structure elements are annotated above the logos. The numbered connections between residue pairs correspond to the numbered rows in B. (B) Exemplar pairs of interacting residues that show conserved differences among a subset of γA isoforms and may therefore contribute to specificity. (C) Close-up views of the three interacting residue pairs highlighted in B are shown for the γA1EC1–4 structure. DOI: http://dx.doi.org/10.7554/eLife.20930.021
Figure 4—figure supplement 1.
Figure 4—figure supplement 1.. γA1EC1–4 dimer interface.
Close-up views of the EC1:EC4 (left) and EC2:EC3 (right) interactions in the γA1EC1–4 dimer. Interfacial residues are shown as sticks and labeled. Residues in parentheses are only marginally interfacial. Bound calcium ions are shown as green spheres. The resolution of the crystal structure is only 4.2 Å and therefore the exact positions of residues and the side chain rotamers may not be completely accurate. In addition no electron density was observed for some side chains and therefore only the first carbon of the side chain was built. DOI: http://dx.doi.org/10.7554/eLife.20930.023
Figure 4—figure supplement 2.
Figure 4—figure supplement 2.. Experimental evidence for EC1:EC4 interactions contributing to Pcdh specificity.
Schematic depiction of the published results of mixed K562 cell aggregation assays. Each panel shows the results of mixing two cell populations: one expressing an mCherry-labeled Pcdh (red), and one expressing an mVenus-labeled Pcdh (green). (A) Data from Figure S3 in Rubinstein et al. (2015). When the both cell populations express the same Pcdh, mixed red/green cell aggregates form (left column). However, when a Pcdh chimera containing EC1 and EC4 from a different Pcdh is expressed, these cells no longer mix with the wild-type Pcdh (right column). (B) Data from Figure 6B in Rubinstein et al. (2015). Expression of chimeric molecules with matched EC1:EC4 and EC2:EC3 interactions results in recognition and the formation of mixed aggregates (left), whilst a mismatched EC1:EC4 interaction results in separate aggregates (right, homophilic binding preference). (C) Data from Figure 5 in Rubinstein et al. (2015). Point mutation of EC1 interfacial residues to those of the wild-type parent molecule restores binding of EC1/EC4 mismatched chimeras to the wild-type Pcdh. (D) Data from Figure 5 in Goodman et al. (2016). Point mutations in interacting EC1:EC4 residues from those in the wild-type Pcdh to those of a different Pcdh isoform from the same subfamily (α7 with α8 EC1:EC4 residues above and β6 with β5 EC1:EC4 residues below) results in generation of a new specificity with homophilic binding preferences with respect to the wild-type Pcdh. (E) Summary of the results shown in this figure. DOI: http://dx.doi.org/10.7554/eLife.20930.024
Figure 5.
Figure 5.. γA- and γB-Pcdhs can interact heterophilically in cis with α-Pcdhs and have similar cis-interaction region structures.
(A) Cell aggregation assays with K562 cells. Pcdhα4 cannot mediate cell aggregration when expressed alone because it does not reach the cell surface (Thu et al., 2014; top panel). Additionally γ-Pcdhs lacking part of their EC1–4 trans interface also cannot mediate cell aggregation (left hand panels). However when these non-adhesive fragments of γA-, γB-, and γC-Pcdhs are co-expressed with full-length Pcdhα4, cell aggregation is observed (right hand panels). (B) Crystal structures of cis interaction region containing fragments of γA4 and γB2. Glycosylated residues are labeled and glycans are shown as red, white and blue spheres. Bound calcium ions are shown as green spheres. Structural alignment of the EC3 domains highlights the differences in curvature between the γA4 and γB2 EC3–6 fragments (right panel). (C) Structural alignment of the γA4 and γB2 EC6 domains reveals their near identical architecture. (D) Structural alignment of the overlapping EC3–4 regions of the γA1EC1–4 dimer with the γA4EC3–6 structure provides a model for the overall architecture of γA EC1–6 dimers. (E) Structural alignment of the overlapping EC3–5 regions of the γB2EC1–5 dimer with the γB2EC3–6 structure provides a model for the overall architecture of γB EC1–6 dimers. Figure 5—figure supplement 1 and Figure 5—source data 1. DOI: http://dx.doi.org/10.7554/eLife.20930.027
Figure 5—figure supplement 1.
Figure 5—figure supplement 1.. X-ray diffraction anisotropy of the γA4EC3–6 crystal.
(A) UCLA Diffraction Anisotropy Server (Strong et al., 2006) output showing the data strength as measured by F/sigma along the a*, b*, and c* axes. (B) The diffraction limits along the a*, b*, and c* axes determined by three different methods: F/sigma from A, and the correlation coefficient (CC) and I/sigma limits calculated by Aimless (Evans, 2006; Evans and Murshudov, 2013). (C–D) Synthetic precession photographs of the X-ray diffraction in the h = 0 plane (C) and the k = 0 plane (D) showing the much weaker diffraction along k and slightly weaker diffraction along h. DOI: http://dx.doi.org/10.7554/eLife.20930.029
Figure 6.
Figure 6.. Identification and analysis of putative cis interface.
(A) Probing the cis interaction interface by aspartic acid-scanning mutagenesis. Eleven EC6 point mutants of PcdhγB6 △EC1 (top panels) cannot mediate cell aggregration when expressed alone (top panel, γB2 numbering). When these 11 mutants are co-expressed with a full length Pcdhα7 cell aggregation is observed for eight of the mutants (middle panels), but not for the remaining three (highlighted in red). This is likely because of failure of these three mutant γB6s to carry Pcdhα4 to the cell surface. When assessed in the context of full-length PcdhγB6 expressed alone, the three mutants that were unable to deliver Pcdhα7 to cell surface did not aggregate cells, while the other eight mutants did mediate cell aggregation (bottom panels). (B) Residues mutated to aspartic acid are drawn in space filling representation on the γB2 EC6 crystal structure. The three mutations that disrupted cell surface delivery of Pcdhα7 are colored red and the mutations that had no effect are colored blue. Glycans observed in the γB2 crystal structure are shown as white spheres and are found only on one side of the domain—the side opposite to the mutations disrupting cell delivery. (C) Residues predicted by PredUs2.0 (Hwang et al., 2016) to be interfacial are drawn in space filling representation on the γB2 EC6 crystal structure. Predicted interfacial residues occupy only one side of the molecule (composed of A, B, D, and E strands). This is the same side that was indicated by the mutagenesis approach to mediate cis interactions and opposite to the side that contains the glycans. (D) The predicted structure of γB6 EC6 (based on the γB2 structure) is shown in surface representation. Black lines frame the face of the molecule containing mutations that disrupt cell surface delivery (labeled in red) and the PredUs2.0 predicted interface residues. Nine surface-exposed residues that show different amino acid compositions between α-Pcdhs and the carrier β- and γ-Pcdhs are labeled and colored in orange. (E) Sequence logos of the EC6 domain for α-Pcdhs and all other alternate Pcdhs (β, γA, and γB). The logos are generated from sequence alignments of the mouse α1–12 isoforms and all mouse β, γA, and γB isoforms. Sequence positions that differ between α-Pcdhs and ‘carrier’ (β, γA, and γB) Pcdhs are highlighted by orange circles (above the logo); the three mutants that disrupt cell surface delivery are highlighted by red stars (below the logo); and regions predicted by PredUs to be in the interface are marked by blue lines (below the logo). Sequence positions within the face that is likely to contain the cis interface are boxed. Secondary structure elements are annotated above the logo. DOI: http://dx.doi.org/10.7554/eLife.20930.030
Figure 6—figure supplement 1.
Figure 6—figure supplement 1.. Analytical ultracentrifugation data of γB6EC1–6 wild-type and V562D cis mutant.
Representative sedimentation equilibrium analytical ultracentrifugation data for the γB6EC1–6 wild-type and V562D cis mutant (γB2 numbering). UV scans taken at 13000 rpm for a protein concentration of 9.6 µM (0.75 mg/mL) are shown in the top chart. The V562D mutant data (green crosses) was fitted to a monomer-dimer model, and the wild-type data (blue crosses) was fitted to a monomer-dimer-tetramer model. Fits are shown as black lines with the residuals from fitting shown in the chart below. DOI: http://dx.doi.org/10.7554/eLife.20930.031
Figure 6—figure supplement 2.
Figure 6—figure supplement 2.. EC6 sequence analysis.
Sequence logos generated from alignments of all mouse alternate γA, γB, and β-Pcdhs. Secondary structure elements from the γB2 EC6 structure are annotated above. The face of EC6 that is predicted to mediate cis interactions from mutagenesis experiments and computational methods (Figure 6) is boxed. Residues in these regions that show conserved differences between γA, γB, and β-Pcdhs are marked with orange dots. DOI: http://dx.doi.org/10.7554/eLife.20930.032
Figure 7.
Figure 7.. Schematic of possible modes of Pcdh-mediated recognition.
(A) Pcdhs form homophilic and/or heterophilic cis-dimers, which are thought to be the recognition unit. (B) One possible Pcdh recognition complex is a dimer-of-dimers, which has been observed in solution for homophilic complexes of β, γB, and some C-type Pcdhs (Table 2). In this model the specificity of the trans-interaction would require both arms of the cis-dimer to match for recognition (Rubinstein et al., 2015). (C) An alternative recognition complex that has been proposed is a linear zipper (Rubinstein et al., 2015). In this model only one arm of opposing cis-dimers needs to match to join the assembly, but incorporation of a dimer containing an isoform that is not expressed by the opposing cell would terminate growth of the intercellular Pcdh zipper. DOI: http://dx.doi.org/10.7554/eLife.20930.034

Similar articles

Cited by

References

    1. Adams PD, Afonine PV, Bunkóczi G, Chen VB, Davis IW, Echols N, Headd JJ, Hung L-W, Kapral GJ, Grosse-Kunstleve RW, McCoy AJ, Moriarty NW, Oeffner R, Read RJ, Richardson DC, Richardson JS, Terwilliger TC, Zwart PH. PHENIX : a comprehensive Python-based system for macromolecular structure solution. Acta Crystallographica Section D Biological Crystallography. 2010;66:213–221. doi: 10.1107/S0907444909052925. - DOI - PMC - PubMed
    1. Altschul SF, Madden TL, Schäffer AA, Zhang J, Zhang Z, Miller W, Lipman DJ. Gapped BLAST and PSI-BLAST: a new generation of protein database search programs. Nucleic Acids Research. 1997;25:3389–3402. doi: 10.1093/nar/25.17.3389. - DOI - PMC - PubMed
    1. Battye TGG, Kontogiannis L, Johnson O, Powell HR, Leslie AGW. iMOSFLM : a new graphical interface for diffraction-image processing with MOSFLM. Acta Crystallographica Section D Biological Crystallography. 2011;67:271–281. doi: 10.1107/S0907444910048675. - DOI - PMC - PubMed
    1. Chen WV, Alvarez FJ, Lefebvre JL, Friedman B, Nwakeze C, Geiman E, Smith C, Thu CA, Tapia JC, Tasic B, Sanes JR, Maniatis T. Functional significance of isoform diversification in the protocadherin gamma gene cluster. Neuron. 2012;75:402–409. doi: 10.1016/j.neuron.2012.06.039. - DOI - PMC - PubMed
    1. Chen WV, Maniatis T. Clustered protocadherins. Development. 2013;140:3297–3302. doi: 10.1242/dev.090621. - DOI - PMC - PubMed