. 2016 Nov 3;539(7627):98-101.
doi: 10.1038/nature19827. Epub 2016 Oct 26.

1970s and 'Patient 0' HIV-1 genomes illuminate early HIV/AIDS history in North America

Affiliations

1970s and 'Patient 0' HIV-1 genomes illuminate early HIV/AIDS history in North America

Michael Worobey et al. Nature. .

Abstract

The emergence of HIV-1 group M subtype B in North American men who have sex with men was a key turning point in the HIV/AIDS pandemic. Phylogenetic studies have suggested cryptic subtype B circulation in the United States (US) throughout the 1970s and an even older presence in the Caribbean. However, these temporal and geographical inferences, based upon partial HIV-1 genomes that postdate the recognition of AIDS in 1981, remain contentious and the earliest movements of the virus within the US are unknown. We serologically screened >2,000 1970s serum samples and developed a highly sensitive approach for recovering viral RNA from degraded archival samples. Here, we report eight coding-complete genomes from US serum samples from 1978-1979-eight of the nine oldest HIV-1 group M genomes to date. This early, full-genome 'snapshot' reveals that the US HIV-1 epidemic exhibited extensive genetic diversity in the 1970s but also provides strong evidence for its emergence from a pre-existing Caribbean epidemic. Bayesian phylogenetic analyses estimate the jump to the US at around 1970 and place the ancestral US virus in New York City with 0.99 posterior probability support, strongly suggesting this was the crucial hub of early US HIV/AIDS diversification. Logistic growth coalescent models reveal epidemic doubling times of 0.86 and 1.12 years for the US and Caribbean, respectively, suggesting rapid early expansion in each location. Comparisons with more recent data reveal many of these insights to be unattainable without archival, full-genome sequences. We also recovered the HIV-1 genome from the individual known as 'Patient 0' (ref. 5) and found neither biological nor historical evidence that he was the primary case in the US or for subtype B as a whole. We discuss the genesis and persistence of this belief in the light of these evolutionary insights.


Conflict of interest statement

Competing Financial Interests Statement

The authors declare no competing financial interests. A patent, “Methods and systems for RNA or DNA detection and sequencing” (U.S. patent application 62/325,320), has been filed with the U.S. Patent Office. It will be used to facilitate the nonexclusive licensing of this methodology.

Figures
Extended Data Figure 1
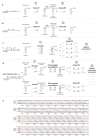
Extended Data Figure 1. Jackhammering schematic and primer panels and pools
a through d: detection and amplification of target RNA molecules in old, degraded, low-titre samples. For the purposes of illustration, consider a tube with 1013 RNA molecules, but (because of the low RNA quality) only one molecule that is (i) capable of being primed by the given reverse primer(s) and (ii) long enough to form a 200bp product. a, conventional RT-PCR with a long amplification product, oversized for a sample with RNA less than ~200 bases in length. b, RT-PCR with a shorter amplification product. c, use of multiple primer pairs to increase the chance of a at least one PCR-positive result. d, the jackhammering approach, which overcomes the problems encountered in a through c by (i) targeting an extensive panel of short amplicons appropriately sized to the level of RNA survival in the sample, (ii) conducting RT with pools of primer pairs that amplify discrete, non-overlapping genomic regions, and (iii) employing a multiplex pre-amplification step, in the tube with the RT product, to generate sufficient DNA to ensure that each aliquot from it contains numerous template molecules for final PCR amplification. In this schematic, we show just two primer pairs per pool, but we used pools of ten pairs with our largest primer panels (shown in panel e, HXB2 numbering along HIV-1 genome). With a 10 primer-pair pool, and 10 final reactions, one can reliably recover 10 bands for sequencing. Five such pools (one entire panel of 50 pairs), allows for complete HIV-1 genome recovery even in heavily degraded samples.
Extended Data Figure 2
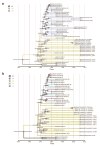
Extended Data Figure 2. Maximum clade credibility (MCC) tree summaries of Bayesian spatio-temporal reconstructions based on complete HIV-1 genome data (a: “full genome 46”, b: “full genome 38”)
The tips of the trees correspond to the year of sampling while the branch (and node) colours reflect location: the sampling location for the tip branches and the inferred location for the internal branches (AF, Africa; CB, Caribbean; US, the United States; CA, California, GA, Georgia; NY, New York). The diameters of the internal node circles reflect posterior location probability values. Thick outer circles represent internal nodes with posterior probability support > 0.95. Grey bars indicate the 95% credibility intervals for the internal node ages. The tree in b) represents the fully annotated version of the tree in Fig. 1 in the main manuscript.
Extended Data Figure 3
Extended Data Figure 3. Maximum clade credibility (MCC) tree summaries of Bayesian spatio-temporal reconstructions based on different genome region data sets
MCC trees for the same strains are shown for a) gag, b) pol, c) env and d) the complete genome. The tips of the trees correspond to the year of sampling while the branch (and node) colours reflect location: the sampling location for the tip branches and the inferred location for the internal branches (AF, Africa; CB, Caribbean; US, the United States). Tip labels are provided for the newly obtained archival HIV-1 genomes. The diameters of the internal node circles reflect posterior location probability values. Thick outer circles represent internal nodes with posterior probability support > 0.95. We also depict the posterior probability densities for the time of the introduction event from the Caribbean into the U.S on the time scale of the trees.
Extended Data Figure 4
Extended Data Figure 4. Maximum likelihood phylogenies for the different genome region data sets
We analyzed the same data sets as in ED Fig. 3. The diameters of the internal node circles reflect bootstrap support values. We manually colored the branches in a similar way as for the Bayesian phylogeographic reconstructions.
Extended Data Figure 5
Extended Data Figure 5. Maximum clade credibility (MCC) tree summaries of Bayesian spatio-temporal reconstructions based on different env data sets (a: “env 105”, b: “env 74”)
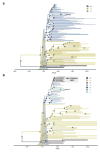
The tips of the trees correspond to the year of sampling while the branch (and node) colours reflect location: the sampling location for the tip branches and the inferred location for the internal branches (AF, Africa; CB, Caribbean; US, the United States, CA, California; GA, Georgia; NJ, New Jersey, NY, New York; PA, Pennsylvania). The diameters of the internal node circles reflect posterior location probability values. Thick outer circles represent internal nodes with posterior probability support > 0.95. We also depict the posterior probability density for the time of the introduction event from the Caribbean into the U.S on the time scales of the trees. The three partial env sequences from SF in 1978 are highlighted with bullets.
Extended Data Figure 6
Extended Data Figure 6. Maximum clade credibility (MCC) tree summaries of Bayesian spatio-temporal reconstruction comparing early and late strains (a: “env 133”, b: only “late” sequences from “env 133”)
In a), we classified US sequences as ‘early’ or ‘late’ depending on whether they were sampled before or after (and including) 1985. In b), the analysis was conducted on an empirical tree distribution of “env 133” from which we pruned early US sequences (in grey), but we still annotate the reconstruction on the complete phylogenies for reference. The tips of the tree correspond to the year of sampling while the branch (and node) colours reflect location: the sampling location for the tip branches and the inferred location for the internal branches (AF, Africa; CB, Caribbean; US early, the United States sampled < 1985; US late, the United States sampled in or after 1985; CA, California; GA, Georgia; NC, North Carolina, NY, New York). The diameters of the internal node circles reflect posterior location probability values. Thick outer circles represent internal nodes with posterior probability support > 0.95.
Extended Data Figure 7
Extended Data Figure 7. A cluster of 40 early AIDS patients linked through sexual contact
(Reprinted from Figure 1 of reference with permission from Elsevier).
Extended Data Figure 8
Extended Data Figure 8. Jackhammering validation with reference viruses
a, The consensus sequences for primer panels HIVM and HIVR (‘RMcon’ suffix) were included, with previously published sequences for a US (US657) virus and a Haitian (HT599) virus, in a maximum likelihood tree. The two clusters of paired sequences are highlighted by coloured boxes. b, Plot of the root-to-tip genetic distance against sampling time for the tree in a). The colors for the data points are consistent with those used for sampling locations in the phylogenies (the two African outgroup tips are not shown for clarity). The data points with black circles represent the published sequences while the data points with a target symbol represent the newly obtained sequences.
Extended Data Figure 9
Extended Data Figure 9. Plots of the root-to-tip genetic distance against sampling time for different genome region data sets (gag, pol, env and complete genome)
We used TempEst to obtain exploratory regressions based on the maximum likelihood trees (ED Fig. 4). Each data point represents a tip; colors are consistent with those used for sampling locations in the phylogenies. The US data points with black circles represent the new genomes dating back to 1978–1979. The data point with the target symbol represents the Patient 0 genome. In each plot, we provide the R2 for the regression and the slope, reflecting the evolutionary rate (in substitutions per site per year).
Figure 1
Figure 1. Maximum clade credibility (MCC) tree summary of the Bayesian spatio-temporal reconstruction based on complete HIV-1 genome data
The tips of the tree correspond to year of sampling while branch and node colours reflect the sampling location for the tip branches and the inferred location for the internal branches (AF, Africa; CA, California; CB, Caribbean; GA, Georgia; NY, New York). Tip labels are provided for the newly obtained archival HIV-1 genomes. Diameters of internal node circles reflect posterior location probability values. Thick outer circles represent internal nodes with posterior probability support > 0.95. We also depict the posterior probability density for the time of the introduction event from the Caribbean into the US on the time scale of the tree. A fully annotated tree for this data set (‘full genome 38’, which includes only sequences sampled early in the US epidemic) is shown in ED Fig. 2b; ‘full genome 46’ which includes all available complete genomes basal to the “pandemic clade” of subtype B, plus a similar number and date range of US pandemic clade sequences, is shown in ED Fig. 2a. Separate analyses of gag, pol, env, and the coding-complete genomes (including also sequences sampled later in the US epidemic) provide consistent results (ED Figs. 3 and 4).
Figure 2
Figure 2. The early patterns of HIV-1 subtype B spread in the Americas
The map summarizes the main patterns of spread inferred from the molecular clock phylogeographic analyses. The map inset shows the initial introduction of the subtype B lineage into the Caribbean from Africa. From there, the virus first spreads to NY and subsequently to different locations in the United States. The tree depicts the US clade, plus the most closely related basal HT strain, as inferred from the ‘env 74’ analysis (ED Fig. 5b). Tips of the clade correspond to the year of sampling. Tip branch colours reflect the actual sampling locations as indicated on the map; interior branches depict phylogenetically inferred locations using the same colour scheme. Diameters of internal node circles reflect posterior location probability values. Thick outer circles indicate internal nodes with posterior probability support > 0.95. Thickness of the arrows reflects number of transitions inferred from this tree cluster. Mean dates and 95% credible intervals in yellow and blue represent the date estimates for the MRCA in the Caribbean and the US, respectively, based on the env 74 analysis. Date next to arrow between these locations represents the estimated timing of the corresponding jump. Patient 0 and the earliest sequences from San Francisco (1978) and New York City (1979) are labeled. Maps made with Natural Earth.
Figure 3
Figure 3. Demographic reconstruction based on the nested coalescent model
The colour scheme is consistent with that of the phylogeographic analyses in Figs. 1 and 2: the constant-logistic population size estimates (the ‘effective number of infections’, Ne, multiplied by the mean viral generation time, τ) through time are depicted in a black-yellow color range (following the African and Caribbean locations in the phylogeographic analyses) while the logistic population size estimates for the nested US clade are shown in blue (as for the US/NY location in the phylogeographic analyses).

Comment in

Similar articles

Cited by

References

    1. Holmes EC. When HIV spread afar. Proc Natl Acad Sci USA. 2007;104:18351–18352. - PMC - PubMed
    1. Korber BT, et al. Timing the ancestor of the HIV-1 pandemic strains. Science. 2000;9:1789–1796. - PubMed
    1. Gilbert MT, et al. The emergence of HIV/AIDS in the Americas and beyond. Proc Natl Acad Sci USA. 2007;104:18566–18570. - PMC - PubMed
    1. Pape JW, et al. The epidemiology of AIDS in Haiti refutes the claims of Gilbert et al. Proc Natl Acad Sci USA. 2008;105:E13. - PMC - PubMed
    1. Auerbach DM, Darrow WW, Jaffe HW, Curran JW. Cluster of cases of the acquired immune deficiency syndrome: patients linked by sexual contact. Am J Med. 1984;76:487–492. - PubMed

Publication types

MeSH terms