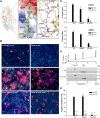
. 2016 Oct 26;12(10):e1005948.
doi: 10.1371/journal.ppat.1005948. eCollection 2016 Oct.

Crystal Structure of Glycoprotein C from a Hantavirus in the Post-fusion Conformation

Affiliations

Crystal Structure of Glycoprotein C from a Hantavirus in the Post-fusion Conformation

Shmuel Willensky et al. PLoS Pathog. .

Abstract

Hantaviruses are important emerging human pathogens and are the causative agents of serious diseases in humans with high mortality rates. Like other members in the Bunyaviridae family their M segment encodes two glycoproteins, GN and GC, which are responsible for the early events of infection. Hantaviruses deliver their tripartite genome into the cytoplasm by fusion of the viral and endosomal membranes in response to the reduced pH of the endosome. Unlike phleboviruses (e.g. Rift valley fever virus), that have an icosahedral glycoprotein envelope, hantaviruses display a pleomorphic virion morphology as GN and GC assemble into spikes with apparent four-fold symmetry organized in a grid-like pattern on the viral membrane. Here we present the crystal structure of glycoprotein C (GC) from Puumala virus (PUUV), a representative member of the Hantavirus genus. The crystal structure shows GC as the membrane fusion effector of PUUV and it presents a class II membrane fusion protein fold. Furthermore, GC was crystallized in its post-fusion trimeric conformation that until now had been observed only in Flavi- and Togaviridae family members. The PUUV GC structure together with our functional data provides intriguing evolutionary and mechanistic insights into class II membrane fusion proteins and reveals new targets for membrane fusion inhibitors against these important pathogens.


Conflict of interest statement

The authors have declared that no competing interests exist.

Figures
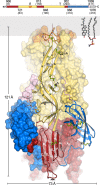
Fig 1
Fig 1. Overall fold of the post-fusion PUUV sGC.
PUUV sGC has the same three-domain architecture as other class II proteins. Domain I is shown in red, domain II in yellow with the fusion loop in orange, domain III in blue and the stem region in light pink. Residue numbers follow GPC numbering. The membrane proximal part of the stem, the transmembrane anchor and the cytoplasmic tail (grey) are missing in the structure. Secondary structure elements are indicated. Glycans are linked to N937. Disulfide bonds are in green. Gray rectangle represents the outer leaflet of the membrane. On the right, a cholesterol and phosphatidylethanolamine molecules are shown for scale. On the top is linear domain organization of PUUV GC. Color scheme is as described for the structure. Gray indicates regions that were not observed in the structure. Numbers correspond to GPC numbering and in parenthesis is GC numbering.
Fig 2
Fig 2. The putative fusion loop of PUUV GC compared to fusion loops of other viral class II membrane fusion proteins.
(A) Structure-based multiple sequence alignment of the fusion loop regions from different class II members. Shading is in the same color scheme as in Fig 1. The PXD insertion in PUUV GC is highlighted with a black box. Residues of PUUV GC and RVFV GC correspond to polyprotein precursor numbering. (B) Clockwise from the top left: PUUV GC, RVFV GC, DENV2 E and Semliki forest virus (SFV) E1 fusion loops (PDB codes 5J81, 4HJ1, 1OK8 and 1RER, respectively). The hydrophobic residues that anchor the protein to the cellular membrane are shown in stick representation and the disulfide bonds are shown in ball-and-stick representation. (C) CONSURF analysis [74] of unique hantavirus GC sequences projected on the surface of PUUV sGC crystal structure. A top view on the fusion loop, down the crystallographic tree-fold axis. The following uniprot (http://www.uniprot.org/) entries were used for the analysis: M9QRJ8, Q9QIZ1, M9QSR6, W5RRK8, Q5MYC0, Q9WJ31, Q2V8Y2, A0A068EN08, A0A0A7EQ65, Q66753, M9QY05, A0S5D7, O12371, Q9WSK6, Q806Y7, A0A0D5W3U2, F1T2C3, A8RRS6, G0WJH7, P27315, C7AGW1, B1NSM7, Q83887, A0A075IFP0, A0A0K0K9P4, Q9WMK6, A0A0F6T9U0, H8XZQ0, Q9DXJ5, Q9E158, Q91BQ9, A0A068ETZ4, A6MD75, B6DDK4, V9MFN9, H6WCQ9, Q99BV0, A0A077D3A4, P08668, F6KBJ3, A0RZG8, K4MYY7, R4JAI4, U5L2G2, O55348, H8ZHK6, H8ZHL5 (D) Hydrogen bond between W773 and the carbonyl of P781. Yellow dash line represents the distance between P781 carbonyl and W773.
Fig 3
Fig 3. Inter-protomer interactions unique to PUUV GC.
(A) Strand A0 at the N-terminus of domain I extends the B0-I0-H0-G0 β-sheet of the adjacent protomer. The donor protomer (protomer 1) is indicated in the same color scheme as in Fig 1 while the neighboring protomer (protomer 2) is shown in faded colors. (B) Inter-trimer salt bridge at the membrane proximal part of domain II. Ionic pairs are in sticks representation. The boundaries of each protomer are highlighted. (C) The glycosylation on N937 mediates interactions between protomers. Right: view of the trimer from the membrane, down the crystallographic three-fold axis. Left: Close-up view on the glycosylation groove between the protomers. N937 and the glycans are in sticks representation. 2FO-FC electron density map at 1σ is shown in light blue mesh.
Fig 4
Fig 4. Neutralizing epitope mapping on the surface of PUUV GC.
Solvent accessible surface representation of the PUUV GC protomer with the linear epitopes of 1C9 (residues 822–834) and 4G2 (residues 903–920) MAb highlighted. Dark-surface protomers are the crystal structure of PUUV GC and bright-surface protomers are pre-fusion model based on PUUV GC domains superimposed onto Semliki forest virus E1 in the pre-fusion conformation (PDB code 2ALA). Gray dashed line represents the movement of domain III between the pre- and post-fusion conformations. On the right, a cartoon representation of the two epitope sites in the context of the trimer. Residues of the linear epitopes are highlighted with sphere representation. View angles are represented by eye symbols.
Fig 5
Fig 5. Hinge motions in PUUV sGC protomers.
(A) Superposition of individual domains of sGC XF1 (color) and sGC XF2 (light grey). Root mean square deviation (RMSD, calculated in PyMol) for domain I, II and III are 0.339 Å, 0.483 Å, 0.227 Å respectively. (B) B-factor putty representation of the two crystal structures of PUUV sGC. Cold colors (blue-green) represent lower B-factors whereas warm colors (yellow-red) represent high B-factors. In the inset is a ribbon representation of sGC XF1 (color) and sGC XF2 (light grey) in the same orientation as the putty representation. In red is the crystallographic 3-fold axis. (C) A quantifying B-factor analysis of the two PUUV sGC crystal forms. Analysis was executed using bavarage module in CCP4 program suite (61). In black is sGC XF1 and red is sGC XF2. Linear domain organization is shown for orientation. Color scheme and domains borders are as in Fig 1. (D) A view on the fusion loop down the three-fold axis of sGC XF1 (color) and sGC XF2 (light grey) superposition. Triangles represent the distances between the Cα W773 of the protomers. The distance in sGC XF1 (pH 6.0) is 11.0 Å whereas in sGC XF2 (pH 8.0) it is 14.9 Å. Triangles area for pH 6.0 and pH 8.0 are 52.4 Å2 and 114.1 Å2, respectively. (E) E770-R902 inter-protomer salt bridge at the two crystal forms. Color scheme is as in panel B.
Fig 6
Fig 6. The stem region stabilizes the GC trimer.
(A) On the left an orientation overview of PUUV GC trimer. In the middle, a close-up view of the stem region of one of the protomers. Side-chains of the stem residues are shown in sticks representation. The surface electrostatic potential (red, -5 kT/e; blue, 5 kT/e) of domain II was calculated by APBS [72]. 2FO-FC electron density map at 1σ is shown in green mesh. On the right is a detailed view of the interactions of the stem region in sticks/cartoon representation. Color scheme is as in Fig 1. (B) Cell-cell fusion activity of wild type and mutant GC from PUUV and ANDV GC. Representative fluorescence micrographs of Vero E6 cells expressing wild type or R1074A mutant GPC from PUUV or ANDV, and treated at different pHs. The cell cytoplasm was labelled with 5-chloromethylfluorescein diacetate (CMFDA; green fluorescence), nuclei with DAPI (blue fluorescence) and GC was detected with anti- GC MAb (Alexa555; red fluorescence). Cells from a partial microscopy field are shown from a representative experiment. Mock indicates cells transfected with an empty expression plasmid. Arrows indicate syncytia. (200 x magnification). (C) Quantification of the cell-cell fusion activity of cells expressing wild type and mutant GPC. The mean fusion index was calculated by counting cells and nuclei and represents n ≥ 2 independent experiments. Fusion activity of GC mutant R902A was similar to the wild type and serves as a positive control. (D) Homotrimer formation of wild type and R1074A mutant Gc from ANDV after low pH treatment. Sucrose gradient sedimentation of glycoproteins extracted from ANDV-like particles after their treatment at the indicated pHs. Detection of GC in each fraction by western blot using anti-GC MAb. The molecular mass of each fraction was determined experimentally by a molecular marker and plotted against the log of its theoretical molecular mass. GC trimers have a molecular mass of 165 KDa. (E) Trimer stability of wild type or mutant GC. VLPs including wild type GN and wild type or mutant GC were treated at different pHs and next incubated for 30 min with trypsin. The trypsine resistance of GC was assessed by western blot analysis with anti-GC MAb. Results were quantified by densitometry from n ≥ 2 experiments. As a control, the fusion active mutant R902A serves as trypsin-resistant control. The statistical evaluation of each data point was performed in relation to the wild type GC treated at pH 5.5. ***, P < 0.00025; **, P < 0.0025;*, P < 0.025; ns, not significant.
Fig 7
Fig 7. Structural and evolutionary relationships in class II fusion proteins.
Cladograms representing the structural relationships between different class II fusion proteins. The coordinates of PUUV GC were submitted to the DALI server. Atomic coordinates were obtained from the Protein Data Bank (PDB). Structure based alignment of the collected coordinates was performed with MUSTANG. A dendrogram was estimated based on a neighbor-joining analysis of the aligned sequences and guided by the BLOSUM62 substitution matrix. Abbreviations and their respective PDBs are as follows: dengue virus 2 (DENV-2, 1OK8-A), tick-borne encephalitis virus (TBEV, 1SVB-A), dengue virus 3 (DENV-3, 1UZG-A), Semliki forest virus (SFV, 1RER-A), West Nile virus (WNV, 2I69-A), Dengue virus 1 (DENV-1, 3G7T-A), Sindbis virus (SINV, 3MUU-A), Chikugunya virus (CHV, 3N41-F), Japanese encephalitis virus (JEV, 3P54-A), rubella virus (RV, 4ADG-A), St. Louis encephalitis virus (SLEV, 4FG0-A), Rift valley fever virus (RVFV, 4HJ1). C.elegans EFF1 (4OJC-A) was added as an out-group. Color scheme is per legend. Icosahedron icon represents icosahedral envelope, P- pleomorphic envelope. Genome type and transmission vectors are indicated by representative symbols.

References

    1. Hallin GW, Simpson SQ, Crowell RE, James DS, Koster FT, Mertz GJ, et al. Cardiopulmonary manifestations of hantavirus pulmonary syndrome. Critical care medicine. 1996;24(2):252–8. - PubMed
    1. Hughes MT, Gonzalez JA, Reagan KL, Blair CD, Beaty BJ. Comparative potential of Aedes triseriatus, Aedes albopictus, and Aedes aegypti (Diptera: Culicidae) to transovarially transmit La Crosse virus. J Med Entomol. 2006;43(4):757–61. Epub 2006/08/09. - PubMed
    1. Lee HW, Lee PW, Johnson KM. Isolation of the etiologic agent of Korean Hemorrhagic fever. The Journal of infectious diseases. 1978;137(3):298–308. - PubMed
    1. Svedmyr A, Lee HW, Berglund A, Hoorn B, Nystrom K, Gajdusek DC. Epidemic nephropathy in Scandinavia is related to Korean haemorrhagic fever. Lancet. 1979;1(8107):100. - PubMed
    1. Brummer-Korvenkontio M, Vaheri A, Hovi T, von Bonsdorff CH, Vuorimies J, Manni T, et al. Nephropathia epidemica: detection of antigen in bank voles and serologic diagnosis of human infection. The Journal of infectious diseases. 1980;141(2):131–4. - PubMed

Substances

LinkOut - more resources