Review
. 2016 Sep 15;6(4):1743-1780.
doi: 10.1002/cphy.c150048.

Heart Valve Biomechanics and Underlying Mechanobiology

Affiliations
Review

Heart Valve Biomechanics and Underlying Mechanobiology

Salma Ayoub et al. Compr Physiol. .

Abstract

Heart valves control unidirectional blood flow within the heart during the cardiac cycle. They have a remarkable ability to withstand the demanding mechanical environment of the heart, achieving lifetime durability by processes involving the ongoing remodeling of the extracellular matrix. The focus of this review is on heart valve functional physiology, with insights into the link between disease-induced alterations in valve geometry, tissue stress, and the subsequent cell mechanobiological responses and tissue remodeling. We begin with an overview of the fundamentals of heart valve physiology and the characteristics and functions of valve interstitial cells (VICs). We then provide an overview of current experimental and computational approaches that connect VIC mechanobiological response to organ- and tissue-level deformations and improve our understanding of the underlying functional physiology of heart valves. We conclude with a summary of future trends and offer an outlook for the future of heart valve mechanobiology, specifically, multiscale modeling approaches, and the potential directions and possible challenges of research development. © 2016 American Physiological Society. Compr Physiol 6:1743-1780, 2016.


Figures

Figure 1
Figure 1
A schematic approach to the biomechanics and mechanobiology of heart valve function. Heart valve function can be divided into multiple length scales: organ, tissue, cell, and subcell levels.
Figure 2
Figure 2
The multiscale nature of heart valve biomechanics: a representation of the MV at the organ, tissue, and cell levels. At the tissue level: a circumferentially oriented cross section of the MV anterior leaflet stained with Movat pentachrome, which colors collagen yellow, elastic fibers black, and hydrated PGs and GAGs blue. At the cell-level: a transmission electron micrograph of a mitral VIC from the fibrosa layer.
Figure 3
Figure 3
Scanning electron micrograph of the multilayered microenvironment of the MVAL. Individual micrographs of each layer are also presented: elastin-rich ventricularis and atrialis, highly collagenous fibrosa, and proteoglycan-rich spongiosa. The collagen fibrils and elastic fibers closely surround the interstitial cells and highlight the long cellular extensions. In the fibrosa, collagen fibrils are aligned in the circumferential direction of the leaflet, which is responsible for the observed anisotropy in leaflet mechanical behavior. (T: transmural, C: circumferential.)
Figure 4
Figure 4
A conceptual framework of the natural history of CAVD. The spectrum of disease ranges from the “at risk” patient to the patient with end-stage severe symptomatic aortic stenosis. The light blue line represents the expected event-free survival and the purple line represents the survival curve at the onset of aortic sclerosis, which deviates from the expected survival line. Atherosclerotic risk factors involved in the development of AV disease from aortic sclerosis to calcified AV disease are included. Adapted from Otto et al. (182) with permission and Rajamannan et al. (203).
Figure 5
Figure 5
Numerical simulation of the unsteady, pulsatile flow in a tricuspid prosthetic HV. Contours of the out-of-plane vorticity are shown at two phases during the cardiac cycle: (A) fully open phase and (B) closing phase.
Figure 6
Figure 6
Instantaneous friction streamline and shear stress magnitude plots on the aortic (A and C) and ventricular (B and D) sides of the leaflets during the fully open (A and B) and early closing (C and D) phases of the cardiac cycle.
Figure 7
Figure 7
(A) Schematic of the MVAL with the nine transducers used for sonomicrometry array localization. (B) Representative areal strain traces and corresponding areal strain rate data. The high strain rates (on the order of 1000% s−1) underscore the highly dynamic nature of the MV. Once the valve coapts fully, no further deformations occurred. (C) Mean principal strains for three pressure levels: 90, 150, and 200 mmHg. Other than the differences between the circumferential and radial peak strains, there were no significant differences in strain with increasing LV pressure. Adapted, with permission, from Sacks et al. (214).
Figure 8
Figure 8
(A) Diagram of the AV cusp highlighting the belly, commissures, nodulus, and regions of coaptation. SALS results with the orientation index at (B) 0mmHg, (C) 4 mmHg, and (D) 90 mmHg TVP. No further changes in fiber alignment were observed past 4 mmHg. These results are consistent with histological-based data that quantifies the percent area of tissue displaying collagen fiber crimp (E). Adapted, with permission, from Sacks et al. (217).
Figure 9
Figure 9
Movat pentachrome stain of the transverse-radial section of the center region of the MVAL, and multiphoton microscopy of the ventricularis, fibrosa, spongiosa, and atrialis layer of the anterior leaflet is also shown. Adapted, with permission, from Zhang et al. (299).
Figure 10
Figure 10
The net stress contribution from each ECM component from each layer for the equibiaxial stress protocol is shown for the circumferential and radial direction of the anterior and posterior leaflets. Here, the contributions from the layers are ventricularis (V), fibrosa (F), spongiosa (S), and atrialis (A). Interestingly, while the fibrosa layer is dominant circumferential directions in both leaflets, the atrialis also contributes substantially in the radial direction. Adapted, with permission, from Zhang et al. (299).
Figure 11
Figure 11
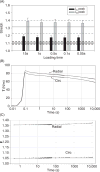
(A) The circumferential and radial stretches of the MV leaflet at the 90 N/m equitension state, λCpeak and λRpeak, revealed no significant differences among the prescribed set of loading time protocols in both the circumferential (P = 0.987) and radial (P = 0.996) directions. Stretches observed previously in mock flow loop (solid horizontal lines) ±SEM (dotted lines) are plotted for the circumferential (black) and radial (gray) specimen axes. λCpeak and λRpeak exceeded those observed in vitro; however, the ratio of λCpeak to λRpeak (0.86 ± 0.02) was very close to the ratio of peak circumferential and radial stretches observed in vitro (0.83). (B) Representative biaxial stress-relaxation data, demonstrating continued relaxation throughout the 3-h time frame. (C) Representative stretch versus time curves for a typical biaxial creep experiment. Adapted, with permission, from Zhang et al. (299).
Figure 12
Figure 12
(A) Schematic showing the region of tissue used for bending tests in the AV. (B) Schematic showing directions of bending for the AV with respective layers (V: ventricularis, S: spongiosa, and F: fibrosa). M versus Dk relations in both the AC and WC directions for (C) specimens tested in 5 and 90 mmol/L KCl, and (D) specimens flexed in 5 mmol/L KCl and samples treated in 10 mmol/L thapsigargin overnight and then flexed in 5 mmol/L KCl. While the application of 90 mmol/L KCL induced an increase in stiffness in the AC direction only, both bending directions experienced a loss of stiffness with the addition of thapsigargin to the bathing medium.
Figure 13
Figure 13
(A) The relation between AVIC NAR and TVP loading, with values reported over normalized leaflet thickness. (B) AVIC NAR versus the normalized collagen fiber orientation index (NOI) at different TVP levels. These results suggest that AVICs are not appreciably loaded until the collagen fibers fully straighten at TVPs more than ∼4 mmHg.
Figure 14
Figure 14
Transmission electron micrograph of an MVIC from the fibrosa layer of the MV anterior leaflet highlighting the cellular microenvironment, particularly collagen fibril circumferential orientation and close interaction and alignment with the MVIC. Scale bar, 1 μm. (T: transmural, R: radial, C: circumferential.)
Figure 15
Figure 15
(A) A VIC under MA—the vertical bar represents the aspiration length. (B) Functional correlations of effective cell stiffness E versus TVP. (C) Linear correlation between Hsp47 versus α-SMA, showing a strong correlation between the two proteins (r = 0.996) as the one progresses from the right to the left side of the heart.
Figure 16
Figure 16
(A and B) Transmural MVIC distribution and deformation in the MV anterior leaflet under controlled biaxial loading. (A) Stack of two-photon excited fluorescence images. Red represents collagen fibers and green represents cell nuclei stained with Cytox Green. Image stacks were processed and used to quantify cellular deformation by measuring the NAR. (B) Measured layer-specific NAR as a function of membrane tension. (A: atrialis, S: spongiosa, F: fibrosa, V: ventricularis.) (C and D) The macro-micro finite element (FE) model used to investigate MVIC deformation. (C) Schematic diagram of the tissue-level model: the region of interest of the MVAL tissue under equibiaxial tension loading. (D) Diagram of the cell-level microenvironment model, which consists of 37 uniformly distributed MVICs embedded in the layer-specific representative volume element. The tissue-level deformations are used to prescribe boundary displacements. Adapted, with permission, from Lee et al. (134).
Figure 17
Figure 17
Comparisons of the experimentally measured and numerically predicted NARs as a function of tissue-level tension: (A) atrialis layer (r2 = 0.8403), (B) spongiosa layer (r2 = 0.9166), (C) fibrosa layer (r2 = 0.8906), and (D) ventricularis layer (r2 = 0.9373). Adapted, with permission, from Lee et al. (134).
Figure 18
Figure 18
AFM simulation setup with finite element mesh. (A) The volume ratio of the nucleus was acquired from electron micrographs of in situ VICs. Scale bar = 1 μm. VIC dimensions were acquired from height maps from AFM experiments. The colors represent the height of each point in μm. Scale bar = 10 μm. (B) The mesh was refined around the indentation region, with typically 10,000∼50,000 linear tetrahedron elements.
Figure 19
Figure 19
(A) Deformation contours central and peripheral indentations highlight that VIC deformation is localized around the indentation region. The simulations show that indentations in the central region deform the nucleus more than those at the periphery. (B) Simulated and experimental indentation data at the center can be used to analyze VIC nucleus mechanical properties.
Figure 20
Figure 20
The step-by-step calibration process. (A) The cytoskeletal shear modulus (μcyto) and α-SMA fiber shear modulus (μsf) were calibrated using the MA data for different types of VICs with different expression levels of α-SMA fibers. (B) Using the AFM indentation data on the cell peripheral regions, the fiber active contraction strength (f) was calibrated for AVICs and PVICs. (C) Using the AFM indentation data on the cell central region, the shear modulus of nucleus (μnuc) was calibrated for AVICs and PVICs. The parameters in red represents the ones that are being calibrated in the step, the parameters in gray represents the ones that are assumed not contribute to the mechanical response of the VICs (hence ignored) in the step, and the parameters in black represents the ones that are already calibrated from the previous steps and integrated into the model. Adapted, with permission, from Sakamoto et al. (221).
Figure 21
Figure 21
(A) Contraction strength of the α-SMA fibers in the AVICs and PVICs. About 9:1 ratio in the contraction strength was observed from AVICs to PVICs. (B) Shear moduli of the AVICs and PVICs nuclei, which exhibited no differences. Adapted, with permission, from Sakamoto et al. (221).

References

    1. Abrams J. The aortic valve by Mano Thubrikar Crc Press, Inc., Boca Raton (1990) 221 pages, illustrated, $97.50 ISBN: 0–8493–4771–8. Clin Cardiol. 1991;14:364a–365.
    1. Accola KD, Scott ML, Thompson PA, Palmer GJ, III, Sand ME, Ebra G. Midterm outcomes using the physio ring in mitral valve reconstruction: Experience in 492 patients. Ann Thorac Surg. 2005;79:1276–1283. discussion 1276–1283. - PubMed
    1. Adamczyk MM, Vesely I. Characteristics of compressive strains in porcine aortic valves cusps. J Heart Valve Dis. 2002;11:75–83. - PubMed
    1. Aikawa E, Otto CM. Look more closely at the valve: Imaging calcific aortic valve disease. Circulation. 2012;125:9–11. - PubMed
    1. Aikawa E, Whittaker P, Farber M, Mendelson K, Padera RF, Aikawa M, Schoen FJ. Human semilunar cardiac valve remodeling by activated cells from fetus to adult: Implications for postnatal adaptation, pathology, and tissue engineering. Circulation. 2006;113:1344–1352. - PubMed

Publication types

LinkOut - more resources