. 2016 Oct 25;17(5):1289-1301.
doi: 10.1016/j.celrep.2016.10.001.

An Interaction with Ewing's Sarcoma Breakpoint Protein EWS Defines a Specific Oncogenic Mechanism of ETS Factors Rearranged in Prostate Cancer

Affiliations

An Interaction with Ewing's Sarcoma Breakpoint Protein EWS Defines a Specific Oncogenic Mechanism of ETS Factors Rearranged in Prostate Cancer

Vivekananda Kedage et al. Cell Rep. .

Abstract

More than 50% of prostate tumors have a chromosomal rearrangement resulting in aberrant expression of an oncogenic ETS family transcription factor. However, mechanisms that differentiate the function of oncogenic ETS factors expressed in prostate tumors from non-oncogenic ETS factors expressed in normal prostate are unknown. Here, we find that four oncogenic ETS (ERG, ETV1, ETV4, and ETV5), and no other ETS, interact with the Ewing's sarcoma breakpoint protein, EWS. This EWS interaction was necessary and sufficient for oncogenic ETS functions including gene activation, cell migration, clonogenic survival, and transformation. Significantly, the EWS interacting region of ERG has no homology with that of ETV1, ETV4, and ETV5. Therefore, this finding may explain how divergent ETS factors have a common oncogenic function. Strikingly, EWS is fused to various ETS factors by the chromosome translocations that cause Ewing's sarcoma. Therefore, these findings link oncogenic ETS function in both prostate cancer and Ewing's sarcoma.

Keywords: ERG; ETS; EWS; Ewing’s sarcoma; prostate cancer.


Figures

Figure 1
Figure 1. EWS interacts specifically with oncogenic ETS proteins
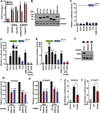
(A) Indicated purified His-ETS proteins were immobilized, incubated with PC3 nuclear extract and washed. EWS binding was visualized by immunoblot (top) and ETS proteins by Ponceau stain (bottom). Co-immunoprecipitation and reverse co-immunoprecipitation with indicated antibodies on extracts from VCaP (B) and PC3 (C) cell lines, or a primary prostate tumor (D). IgG coated beads (beads) were used as control. (E) Overlap of bound regions identified by ChIP-seq in VCaP cells. Parenthesis indicates random prediction based on 125,000 possible binding sites. (F) SDS-PAGE stained with coomassie brilliant blue showing GST and GST-EWS purified from bacteria. (F) Interaction of purified GST-EWS with purified, immobilized His-ETS proteins shown by anti-EWS immunoblot (top). His-ETS proteins visualized by ponceau (bottom). See also Figure S1 and Table S1.
Figure 2
Figure 2. EWS-ETS fusions drive prostate cell migration
(A) A transwell assay using RWPE1 cells stably expressing FLAG-tagged versions of the indicated ETS protein, EWS N-terminus (1-264) alone, or EWS N-terminus fused to an ETS. Fraction of migrated cells is shown relative to RWPE1 with empty vector as the mean and SEM of three replicates. P-value (* < 0.05, ** < 0.01, *** < 0.001) by t test compares EWS-ETS to corresponding ETS. (B) Immunoblots indicate expression of indicated proteins with tubulin as a loading control. (C) Immunoblot of indicated proteins (top). Clonogenic survival of RWPE1 cells expressing the indicated ETS and/or myristoylated AKT shown by colony number (middle) or representative image (lower). See also Figure S2.
Figure 3
Figure 3. Identification of the EWS interaction domains
(A) A schematic of ERG protein showing the two known structured domains; pointed (PNT) and ETS DNA binding (ETS) (top). Indicated ERG constructs with a N-terminal His-tag were immobilized to beads, mixed with PC3 nuclear extract and washed. EWS binding was visualized by immunoblot (middle). Ponceau stain of the same blot shows amount of His-ERG present (bottom). (B) ETV5 has one known structured domain (ETS). Region of ETV5 that binds to EWS was mapped as in (A). (C) EWS interaction with ERG as in (A), but with wild-type (WT) ERG or indicated ERG point mutants. (D) Interaction of purified GST-EWS with indicated purified and immoblized His-ERG proteins. EWS binding shown by immunoblot (top). His-ETS protein visualized by ponceau stain (bottom). (E) Nuclear extracts prepared from RWPE1 cells stably expressing FLAG-ERG, or FLAG-ERG P436A were immunoprecipitated (IP) with anti-ERG antibody (lanes 2 and 3), or bead-only control (lane 1) followed by immunoblotting for EWS or FLAG. See also Figure S3.
Figure 4
Figure 4. EWS is necessary for oncogenic ETS-mediated phenotypes
(A) Transwell migration of RWPE1 cells expressing FLAG-ERG or FLAG-ERG P436A are shown relative to RWPE1 cells with empty vector as the mean and SEM of three biological replicates (upper). Immunoblot of cells used in transwell assay (lower). (B) Mean colony number and representative images of clonogenic growth of same lines used in (A), n=3. (C) Transwell migration of PC3 or DU145 prostate cancer cells stably expressing the indicated shRNA is shown relative to the negative control shRNA (targeting luciferase) as mean and SEM, n=3 (upper). Immunoblots of lines used in transwell assay (lower). (D) Migration as in (C) but using RWPE1 cells over-expressing ERG or KRAS as indicated. (E) Migration of PC3 cells as (C) with or without EWS shRNA and 3xHA-EWS over-expression as indicated. (F) Soft-agar growth from PC3 (n=3), MDA-PCa-2B (n=2) or VCaP (n=2) cells with EWS knockdown as in (C), or as shown. Colonies present after 10 days relative to those expressing the control shRNA shown as mean and SEM. All P-values (* < 0.05, ** < 0.01, *** < 0.001, ns > 0.05) by t test compared to control in the same cell line, unless noted by bracket. See also Figure S4.
Figure 5
Figure 5. Tumor growth promoted by ERG requires the EWS interaction
(A) Immunoblots show expression of 3xFlag-ERG or phosphorylated AKT (pAKT) in RWPE1 cells expressing the indicated constructs. (B) Cells from (A) were co-injected with cancer associated fibroblasts into the flanks of immunocompromised mice and tumor volume was measured by caliper at the indicated time points. Mean and SEM of six (ERG P436A/Myr-AKT) or twelve (all others) experiments are shown. See also Figure S5.
Figure 6
Figure 6. ERG recruits EWS to enhancers, increasing gene expression
(A) Chromatin immunoprecipitation (ChIP) with anti-ERG antibody in RWPE1 cells expressing ERG or ERG-P436A. Enrichment indicates copies of indicated locus in the immunoprecipitate compared to a negative control locus (first two bars), shown as mean and SEM, n=3. Loci are labeled by nearest gene. (B) ChIP as in (A), but with anti-EWS antibody. (C) Ratio of ChIP-seq reads to input reads at 1901 ERG-bound regions upon replicate ERG ChIP-seq or EWS ChIP-seq in RWPE1 cells expressing ERG or ERG-P436A. (D) mRNA level of two ERG target genes by RT-qPCR in RWPE1 cells expressing the indicated construct shown relative to cells with empty vector, shown as mean and SEM, n=3. (E) Box-plots show expression of 680 genes significantly activated by ERG in RWPE1 compared to vector only. Box shows median, 25th and 75th percentiles, bars encompass all values except outliers. P-values (* < 0.05, ** < 0.01, *** < 0.001) by t test. See also Figure S6 and Table S2.
Figure 7
Figure 7. ERG and EWS activate transcription via both ETS/AP-1 and GGAA repeat sequences
(A) ChIP enrichment using anti-ERG and anti-EWS antibodies in VCaP cells at two enhancers with GGAA repeats and two with ETS/AP-1 sequences compared to a control locus. Mean and SEM of three replicates. (B) Immunoblot from RWPE1 cells transfected with the indicated FLAG-tagged constructs. (C) Ratio of firefly to renilla (control) luciferase in RWPE1 cells transfected with minimal promoter firefly reporter and indicated expression construct, normalized to vector only, shown as mean and SEM, n=3. (D) As in (C), but with seven copies of GGAA prior to minimal promoter, except for last two columns which have seven copies of GAGA (GGAA mutant). P-values (* < 0.05, ** < 0.01, *** < 0.001) by t test compare each ETS to FLI1, whereas P-values denoted # compare mutant to wild-type reporter with the same ETS expressed. (E) As in (D), except reporter has 474 bp region of an ETS/AP-1 containing enhancer present prior to minimal promoter. Last two columns have the single ETS sequence mutated from GGAA to GAGA. (F) EWS and tubulin immunoblots of RWPE1 cells stably expressing indicated shRNAs. (G) Relative luciferase as in (D) in RWPE1 cells expressing either ERG or ETV4 and shRNAs shown in (F). (H) As in (G), but with ETS/AP-1 reporter. (I, J) Relative luciferase expression from 7xGGAA or ETS/AP-1 reporter in RWPE1 cells expressing indicated version of ERG shown relative to vector only. See also Table S3.

Similar articles

Cited by

References

    1. Araya N, Hirota K, Shimamoto Y, Miyagishi M, Yoshida E, Ishida J, Kaneko S, Kaneko M, Nakajima T, Fukamizu A. Cooperative interaction of EWS with CREB-binding protein selectively activates hepatocyte nuclear factor 4-mediated transcription. J. Biol. Chem. 2003;278:5427–5432. - PubMed
    1. Arvand A, Denny CT. Biology of EWS/ETS fusions in Ewing’s family tumors. Oncogene. 2001;20:5747–5754. - PubMed
    1. Aytes A, Mitrofanova A, Kinkade CW, Lefebvre C, Lei M, Phelan V, Lekaye HC, Koutcher JA, Cardiff RD, Califano A, et al. ETV4 promotes metastasis in response to activation of PI3-kinase and Ras signaling in a mouse model of advanced prostate cancer. Proc. Natl. Acad. Sci. USA. 2013 - PMC - PubMed
    1. Baena E, Shao Z, Linn DE, Glass K, Hamblen MJ, Fujiwara Y, Kim J, Nguyen M, Zhang X, Godinho FJ, et al. ETV1 directs androgen metabolism and confers aggressive prostate cancer in targeted mice and patients. Genes Dev. 2013;27:683–698. - PMC - PubMed
    1. Bertolotti A, Melot T, Acker J, Vigneron M, Delattre O, Tora L. EWS, but not EWS-FLI-1, is associated with both TFIID and RNA polymerase II: interactions between two members of the TET family, EWS and hTAFII68, and subunits of TFIID and RNA polymerase II complexes. Mol. Cell. Biol. 1998;18:1489–1497. - PMC - PubMed

Publication types

MeSH terms

Substances