

Glycine protects against high sucrose and high fat-induced non-alcoholic steatohepatitis in rats
- PMID: 27784003
- PMCID: PMC5348315
- DOI: 10.18632/oncotarget.12831
Glycine protects against high sucrose and high fat-induced non-alcoholic steatohepatitis in rats
Abstract
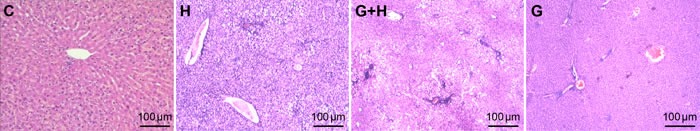
We set out to explore the hypothesis that glycine attenuates non-alcoholic steatohepatitis (NASH) in rats and the possible mechanism by which is it does. Male Sprague-Dawley (SD) rats were fed a diet containing high fat and high sucrose (HSHF) for 24 weeks to induce NASH. Blood and liver tissues were sampled at selected time points throughout the study. Compared with control animals, the content of alanine transaminase (ALT), triglycerides (TGs), and free fatty acids (FFAs) in plasma and the TG and FFA content in the liver was increased from week 4 to 24. The level of TNFα and MCP-1 in plasma, the content of TNFα in the liver, the insulin resistance index, inflammatory cell infiltration, hepatocyte apoptosis, reactive oxygen species (ROS) generation, and endoplasmic stress-associated protein expression were unaltered at 4 weeks. However, these levels were significantly elevated in HSHF fed rats at 12 weeks. At the same time, the level of endotoxin progressively increased from 0.08 ± 0.02 endotoxin EU/ml at week 4 to 0.7 ± 0.19 EU/ml at week 24. Moreover, these rats had elevated blood endotoxin levels, which were positively associated with their NASH indexes. Liver histology progressively worsened over the course of the study. However, we found that with concomitant treatment with glycine, the level of endotoxin decreased, while NASH indexes significantly decreased and liver status markedly improved,. These data support the hypothesis that glycine protects against NASH in rats by decreasing the levels of intestinal endotoxin, alleviating endoplasmic reticulum and oxidative stress.
Keywords: Pathology Section; endoplasmic reticulum stress; glycine; intestinal endotoxin; non-alcoholic steatohepatitis; oxidative stress.
Conflict of interest statement
The authors declare no conflict of interest.
Figures


Similar articles
-
Epigallocatechin gallate attenuated non-alcoholic steatohepatitis induced by methionine- and choline-deficient diet.Eur J Pharmacol. 2015 Aug 15;761:405-12. doi: 10.1016/j.ejphar.2015.05.005. Epub 2015 May 9. Eur J Pharmacol. 2015. PMID: 25967348
-
Salidroside alleviates oxidative stress in the liver with non- alcoholic steatohepatitis in rats.BMC Pharmacol Toxicol. 2016 Apr 14;17:16. doi: 10.1186/s40360-016-0059-8. BMC Pharmacol Toxicol. 2016. PMID: 27075663 Free PMC article.
-
Oleic acid protects saturated fatty acid mediated lipotoxicity in hepatocytes and rat of non-alcoholic steatohepatitis.Life Sci. 2018 Jun 15;203:291-304. doi: 10.1016/j.lfs.2018.04.022. Epub 2018 Apr 27. Life Sci. 2018. PMID: 29709653
-
Non-Alcoholic Fatty Liver Disease.Adv Exp Med Biol. 2017;960:443-467. doi: 10.1007/978-3-319-48382-5_19. Adv Exp Med Biol. 2017. PMID: 28585211 Review.
-
Phenotypic Alteration of Hepatocytes in Non-Alcoholic Fatty Liver Disease.Int J Med Sci. 2018 Oct 20;15(14):1591-1599. doi: 10.7150/ijms.27953. eCollection 2018. Int J Med Sci. 2018. PMID: 30588181 Free PMC article. Review.
Cited by
-
Changes in Glutathione Content in Liver Diseases: An Update.Antioxidants (Basel). 2021 Feb 28;10(3):364. doi: 10.3390/antiox10030364. Antioxidants (Basel). 2021. PMID: 33670839 Free PMC article. Review.
-
Glycine increases glyoxalase-1 function by promoting nuclear factor erythroid 2-related factor 2 translocation into the nucleus of kidney cells of streptozotocin-induced diabetic rats.J Diabetes Investig. 2019 Sep;10(5):1189-1198. doi: 10.1111/jdi.13032. Epub 2019 Mar 28. J Diabetes Investig. 2019. PMID: 30825261 Free PMC article.
-
Serine synthesis via reversed SHMT2 activity drives glycine depletion and acetaminophen hepatotoxicity in MASLD.Cell Metab. 2024 Jan 2;36(1):116-129.e7. doi: 10.1016/j.cmet.2023.12.013. Cell Metab. 2024. PMID: 38171331 Free PMC article.
-
Glycine Metabolism and Its Alterations in Obesity and Metabolic Diseases.Nutrients. 2019 Jun 16;11(6):1356. doi: 10.3390/nu11061356. Nutrients. 2019. PMID: 31208147 Free PMC article. Review.
-
Key Events Participating in the Pathogenesis of Alcoholic Liver Disease.Biomolecules. 2017 Jan 27;7(1):9. doi: 10.3390/biom7010009. Biomolecules. 2017. PMID: 28134813 Free PMC article. Review.
References
-
- Organization WH . Obesity and Overweight Fact Sheet No.311. Geneva: World Health Organization; 2012.
MeSH terms
Substances
LinkOut - more resources
Full Text Sources
Other Literature Sources
Medical
Miscellaneous
