. 2017 Jan;205(1):61-75.
doi: 10.1534/genetics.116.193987. Epub 2016 Oct 26.

Controlling the Rate of GWAS False Discoveries

Affiliations

Controlling the Rate of GWAS False Discoveries

Damian Brzyski et al. Genetics. 2017 Jan.

Abstract

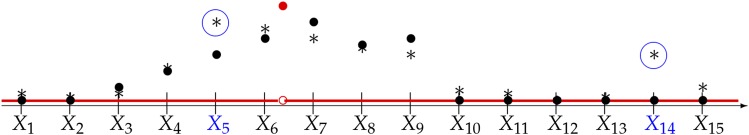
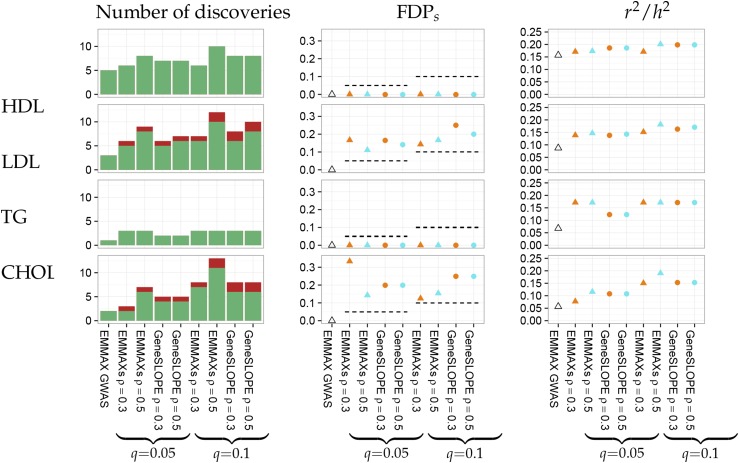
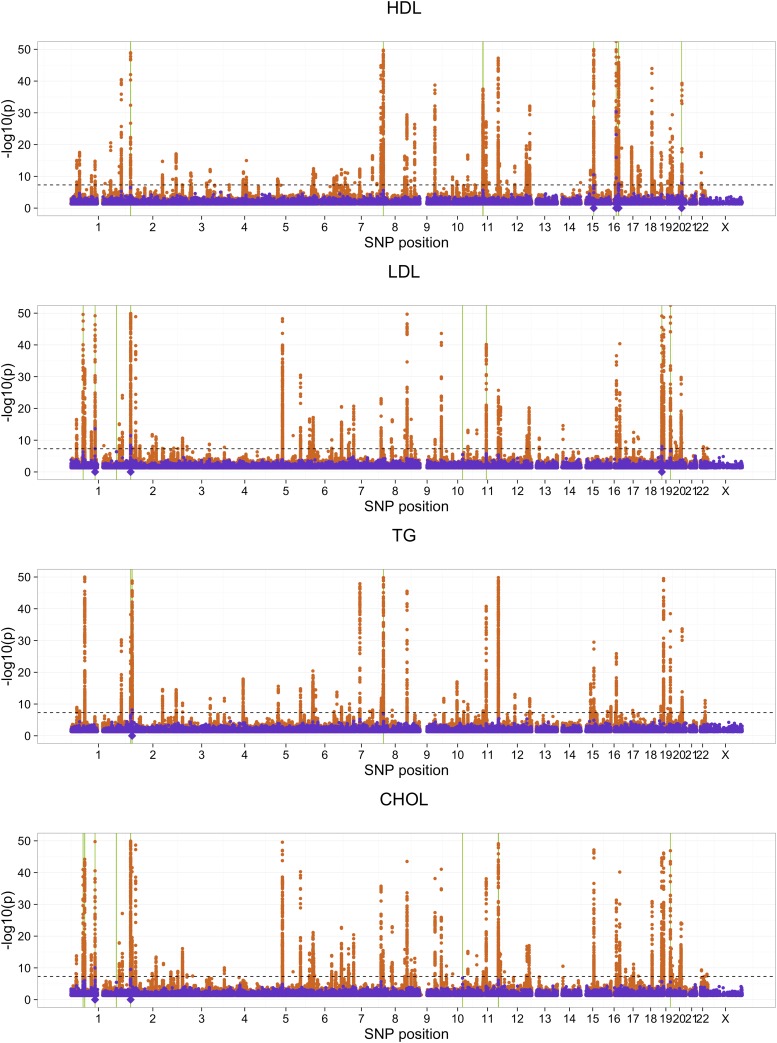
With the rise of both the number and the complexity of traits of interest, control of the false discovery rate (FDR) in genetic association studies has become an increasingly appealing and accepted target for multiple comparison adjustment. While a number of robust FDR-controlling strategies exist, the nature of this error rate is intimately tied to the precise way in which discoveries are counted, and the performance of FDR-controlling procedures is satisfactory only if there is a one-to-one correspondence between what scientists describe as unique discoveries and the number of rejected hypotheses. The presence of linkage disequilibrium between markers in genome-wide association studies (GWAS) often leads researchers to consider the signal associated to multiple neighboring SNPs as indicating the existence of a single genomic locus with possible influence on the phenotype. This a posteriori aggregation of rejected hypotheses results in inflation of the relevant FDR. We propose a novel approach to FDR control that is based on prescreening to identify the level of resolution of distinct hypotheses. We show how FDR-controlling strategies can be adapted to account for this initial selection both with theoretical results and simulations that mimic the dependence structure to be expected in GWAS. We demonstrate that our approach is versatile and useful when the data are analyzed using both tests based on single markers and multiple regression. We provide an R package that allows practitioners to apply our procedure on standard GWAS format data, and illustrate its performance on lipid traits in the North Finland Birth Cohort 66 cohort study.

Keywords: FDR; association studies; linkage disequilibrium; multiple penalized regression.


Figures

Figure 1
Figure 1
Phenotype-aware cluster representatives. The x-axis represents the genome, with the locations of genotyped SNPs Xi indicated by tick marks. The true causal effect of each position of the genome is indicated in red; there is only one causal variant in this region, between SNPs X6 and X7. Solid black circles indicate the value of βi, coefficient of Xi in a linear approximation of the conditional expectation E(y|Xi). Asterisks mark the estimated β^i′s in the sample. The SNPs X5 and X14, selected as cluster representatives in this schematic diagram, are indicated in blue.
Figure 2
Figure 2
(A) Histograms of the number of SNPs included in each cluster when Procedure 1 is applied to P-values with π=0.05 and ρ=0.3 or ρ=0.5. (B) Histogram of the maximal distance between SNPs in the same cluster. The symbol “S” on the x-axis corresponds to clusters that contain only one SNP.
Figure 3
Figure 3
FDRs for the described procedures: in (A) we report results relative to EMMAX and in (B) relative to SMT. The dashed black line represents the target FDRs level of 0.05. Note that EMMAXs with ρ=1 (i.e., with no clustering) coincides with EMMAX, and that the FDRs for this specific case corresponds to the regular FDR. Shapes indicate the procedures: empty triangles for the application of BH to the collection of P-values from EMMAX for all hypotheses followed by clustering of the discoveries; filled triangles for the selective procedure EMMAXs; empty squares for the application of BH to the collection of P-values from SMTs for all hypotheses followed by clustering of the discoveries; filled squares for the selective procedure SMTs; and empty diamonds for the application of BH to the full collection of P-values with no clustering. Colors indicate the parameters for clustering: orange for ρ=0.3, turquoise for ρ=0.5, and blue for ρ=1.
Figure 4
Figure 4
(A) FDRs and (B) power for geneSLOPE. Clustering is done with π=0.05, ρ=0.3, and the target FDRs level 0.05 (marked with a dashed line). Values for geneSLOPE are in blue. For comparison, we reproduce from Figure 3 the curves indicating the performance of EMMAXs and SMTs for the same setting (marked in shades of orange). We also include the values of (A) FDRs and (B) power when EMMAXs and SMTs are carried out using cluster representatives selected with π=5×10⁸, the standard GWAS genome-wide significance threshold (marked in shades of purple). Shapes indicate the procedures: Filled circles for geneSLOPE, filled triangles for EMMAXs, and filled squares for SMTs.
Figure 5
Figure 5
Study of four lipid traits. Comparison of results for HDL, LDL, TG, and CHOL. “Number of discoveries” corresponds to the number of selected cluster representatives under each method; true and false discoveries are marked in green and red, respectively. FDPs is the realized selected false discovery proportion, and r2/h2 is the adjusted r2 obtained when using the set of selected cluster representatives as predictors in a multiple regression model divided by the proportion of phenotype variance explained by genome-wide SNPs obtained using GCTA.
Figure 6
Figure 6
Localization of lipid signals. GeneSLOPE selections using π=0.05, ρ = 0.5, and target FDRs 0.1 are marked using solid green bars for cluster representatives and semitransparent bars for the remaining members of the cluster. P-values from EMMAX (purple) and the Global Lipids Genetics Consortium comparison study (orange) are plotted on the −log10 scale. The horizontal dashed line marks a significance cut off of 5 × 10⁻⁸, and the purple diamonds below the x-axis represents selected cluster representatives under EMMAX using π=0.05, ρ=0.3, and a P-value threshold of 5 × 10⁻⁸.

References

    1. Abramovich F., Benjamini Y., Donoho D. L., Johnstone I. M., 2006. Adapting to unknown sparsity by controlling the false discovery rate. Ann. Stat. 34: 584–653.
    1. Alexander D. H., Lange K., 2011. Stability selection for genome-wide association. Genet. Epidemiol. 35: 722–728. - PubMed
    1. Ardlie K. G., Deluca D. S., Segre A. V., Sullivan T. J., Young T. R., et al. , 2015. Human genomics. The Genotype-Tissue Expression (GTEx) pilot analysis: multitissue gene regulation in humans. Science 348: 648–660. - PMC - PubMed
    1. Benjamini Y., Bogomolov M., 2014. Selective inference on multiple families of hypotheses. J. R. Stat. Soc. Series B Stat. Methodol. 76: 297–318.
    1. Benjamini Y., Heller R., 2007. False discovery rates for spatial signals. J. Am. Stat. Assoc. 102: 1272–1281.

Publication types