. 2016 Dec 2;291(49):25542-25552.
doi: 10.1074/jbc.M116.738161. Epub 2016 Oct 26.

Epitope-dependent Functional Effects of Celiac Disease Autoantibodies on Transglutaminase 2

Affiliations

Epitope-dependent Functional Effects of Celiac Disease Autoantibodies on Transglutaminase 2

Kathrin Hnida et al. J Biol Chem. .

Abstract

Transglutaminase 2 (TG2) is a Ca2+-dependent cross-linking enzyme involved in the pathogenesis of CD. We have previously characterized a panel of anti-TG2 mAbs generated from gut plasma cells of celiac patients and identified four epitopes (epitopes 1-4) located in the N-terminal part of TG2. Binding of the mAbs induced allosteric changes in TG2. Thus, we aimed to determine whether these mAbs could influence enzymatic activity through modulation of TG2 susceptibility to oxidative inactivation and Ca2+ affinity. All tested epitope 1 mAbs, as well as 679-14-D04, which recognizes a previously uncharacterized epitope, prevented oxidative inactivation and increased Ca2+ sensitivity of TG2. We have identified crucial residues for binding of 679-14-D04 located within a Ca2+ binding site. Epitope 1 mAbs and 679-14-D04, although recognizing separate epitopes, behaved similarly when assessing their effect on TG2 conformation, suggesting that the shared effects on TG2 function can be explained by induction of the same conformational changes. None of the mAbs targeting other epitopes showed these effects, but epitope 2 mAbs reduced the rate of TG2-catalyzed reactions. Collectively, these effects could be relevant to the pathogenesis of CD. In A20 B cells transduced with TG2-specific B-cell receptor, epitope 2-expressing cells had poorer uptake of TG2-gluten complexes and were less efficient in gluten epitope presentation to T cells than cells expressing an epitope 1 receptor. Thus, the ability of epitope 1-targeting B cells to keep TG2 active and protected from oxidation might explain why generation of epitope 1-targeting plasma cells seems to be favored in celiac patients.

Keywords: allosteric regulation; antibody; autoimmunity; capillary electrophoresis; celiac disease; enzyme catalysis; hydrogen/deuterium exchange; mass spectrometry (MS); transglutaminase.


Figures

FIGURE 1.
FIGURE 1.
Deamidation activity of TG2 after oxidation in absence or presence of mAbs. A, deamidation activity was measured as mass shift of a substrate gluten peptide (maximum shift is 2.0 Da, corresponding to full peptide deamidation) using TG2 that had either been oxidized (Ox.), kept in the reduced state (Red.), or reactivated (React.) by first oxidizing and then reducing. B, activity of TG2 oxidized in the absence or presence of anti-TG2 mAbs targeting epitope 1 (e1), 2 (e2), or 3 (e3). C, comparison of the deamidation activity of TG2 after oxidation in the presence of 679-14-D04 and epitope 1 mAbs. D, deamidation activity of TG2 after oxidation in presence of the TG2 negative mAbs 679-14-E06H/679-14-A04L (E06H/A04L), and 679-14-A04H/679-14-E06L (A04H/E06L), which harbor the heavy or light chain of the TG2-positive mAb 679-14-E06 paired with the light or heavy chain of the TG2-negative mAb 679-14-A04. The results show that presence of either heavy or light chain of an epitope 1 mAb is not sufficient to protect from oxidation. That is, specific binding to epitope 1 is needed to preserve an effect. The effect of the epitope 1 mAb 679-14-E06, theTG2-negative mAb 693-2-F04, and mouse anti-TG2 mAb CUB7402 are also shown. E, deamidation activity after 90 min. Oxidation in the presence of 4.8:1, 2.4:1, 1.2:1, or 0.6:1 molar ratios of mAb:TG2 has been carried out. F, comparison of TG2 deamidation activity after 90 min after oxidation in the presence of mAbs and their corresponding Fab fragments. For A–D, representative results from one of at least two experiments are shown. E and F were performed once except analysis of reduced and oxidized TG2 that was performed twice where error bars indicate S.D.
FIGURE 2.
FIGURE 2.
Transamidation activity of TG2 after oxidation in presence of mAbs. Transamidation of a FITC-labeled gluten-peptide after oxidation of TG2 determined at a single time point (15 min) in the absence or presence of mAbs recognizing epitope 1 (e1), 2 (e2), 3 (e3), or 4 (e4) or 679-14-D04. The plotted values represent total modification, including both deamidation and transamidation. Oxidation was carried out for 30 min, whereas 60 min of oxidation was used for the deamidation assay shown in Fig. 1, explaining the greater residual activity for oxidized TG2 in this assay. Representative results from one of two experiments are shown.
FIGURE 3.
FIGURE 3.
Effect of Fn on TG2 activity after oxidation. TG2 deamidation activity after oxidation in the presence of Fn is plotted as mass shift of the substrate gluten peptide. Activity of oxidized (ox) and reduced (red) TG2 in the absence of Fn is shown for comparison. Representative results from one of two experiments are shown.
FIGURE 4.
FIGURE 4.
Effect of 679-14-D04 and 679-14-E06 (epitope 1) on the Ca2+ sensitivity of TG2. A, deamidation activity of TG2 at various Ca2+ concentrations was determined as substrate peptide mass shift after 60 min of incubation. B, TG2 activity at 0.2 mm Ca2+ in the presence of various anti-TG2 mAbs targeting epitopes 1 or 2 (e1 and e2, respectively) or not previously assigned to a defined epitope. C and D, TG2 activity over time using different substrate concentrations in the presence or absence of mAb 679-14-E06 (C) and 679-14-D04 (D). The experiments shown in each panel were done in parallel at a Ca2+ concentration of 0.2 mm. For A and B, representative results from one of two experiments are shown.
FIGURE 5.
FIGURE 5.
Binding interface of TG2 and 679-14-D04. A, competition between 679-14-D04 expressed as IgG1 and mAbs 679-14-E06 (epitope 1), 693-1-F06 (epitope 2), and 693-1-E01 (epitope 3) expressed as IgA1. Binding is given as the measured IgG1 ELISA signal relative to the signal obtained in the absence of competing IgA1 mAbs. B, binding of 679-14-D04 to the chimeric protein TG3/TG2, which harbors the N-terminal domain of TG3 and the catalytic core domain, as well as the two C-terminal domains of TG2. C, binding of 679-14-D04 to the TG2 double mutant D151A/E155A and the TG2 single mutants H441A, R433A, and R458A immobilized on Fn. D, structure of TG2 (PDB code 1KV3) (28) with indication of known Ca2+-binding sites (20) (orange), location of the epitopes 1, 2, and 3 (blue, cyan, and magenta, respectively) and residues mutated in this study (residues Asp151 and Glu155 in red and residues His441, Arg433, and Arg458 in purple). E, close-up of the identified epitope of 679-14-D04 (red). The location of nearby Ca2+-binding sites (orange) are also shown. F, binding of the mouse anti-TG2 mAb CUB7402 to the TG2 mutants D151A/E155A, H441A, R433A, and R458A immobilized on Fn. For A–C and F, representative results from one of at least two experiments are shown.
FIGURE 6.
FIGURE 6.
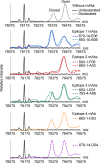
Deconvoluted mass spectra of deuterated TG2 labeled in the absence or presence of mAbs targeting different epitopes. The distribution of TG2 molecules between open and closed conformations was assessed by incubating TG2 with or without molar excess of anti-TG2 mAbs in 90% D2O for 1000 s followed by detection of intact TG2 by mass spectrometry. After incubation in D2O, the mass of the enzyme increases in a conformation-dependent manner as a result of backbone amide hydrogens being exchanged with deuterium (deuteration). The spectra shown for TG2 incubated without mAbs and together with epitope 1 and epitope 2 mAbs have been published previously (31). Detection and analysis were performed twice.
FIGURE 7.
FIGURE 7.
TG2 activity in the presence of mAbs targeting different epitopes. Shown is deamidation activity of TG2 alone or after 20 min of preincubation at room temperature with mAbs targeting different epitopes, including the previously characterized epitopes 1 (e1), 2 (e2), 3 (e3), and 4 (e4). The mouse anti-TG2 mAb CUB7402 is also included. Activity was plotted as the mass shift of substrate gluten peptide. Representative data from one of two experiments are shown.
FIGURE 8.
FIGURE 8.
Effects of epitope targeting on TG2-reactive B cells. A, flow histograms showing TG2 binding by transduced A20 B cells expressing TG2-reactive (679-14-E06, 693-1-F06, and 679-14-D04) or TG2-negative (693-2-F02) IgD BCR. The cells were either stained with biotinylated TG2 attached to phycoerythrin (PE)-conjugated streptavidin (black lines) or with phycoerythrin-streptavidin alone (gray areas). B, collaboration between A20 cells expressing the indicated BCRs and gluten-specific hybridoma T cells assessed by release of IL-2 from the hybridoma cells. The A20 cells were incubated with gluten peptide and active TG2 present either in solution or bound to the BCR. C, TG2-mediated cross-linking of a fluorescently labeled gluten peptide to surface IgD molecules on A20 cells assessed by detection of fluorescent gel bands in cell lysates (left panel). TG2-reactive membrane-bound IgD heavy chains have previously been shown to serve as the primary target of TG2-mediated cross-linking on the surface of transduced A20 cells (14). Following fluorescence detection, the total amount of IgD BCR in each sample was revealed by Western blotting using rabbit anti-human IgD followed by horseradish peroxidase-conjugated goat anti-rabbit IgG (right panel). For all panels, representative results from one of two experiments are shown. In B, each peptide concentration was analyzed in triplicates. The error bars indicate S.D. The different cells were compared by two-way analysis of variance using GraphPad Prism software. Peptide concentrations for which either 679-14-E06 or 679-14-D04 BCR gave significantly higher IL-2 production than 693-1-F06 BCR are indicated with * (p < 0.05) or ** (p < 0.001). Peptide concentrations for which both 679-14-E06 and 679-14-D04 BCR gave significantly higher IL-2 production than 693-1-F06 BCR are indicated with *** (p < 0.001).

References

    1. Folk J. E. (1983) Mechanism and basis for specificity of transglutaminase-catalyzed ϵ-(γ-glutamyl) lysine bond formation. Adv. Enzymol. Relat. Areas Mol. Biol. 54, 1–56 - PubMed
    1. Folk J. E., Mullooly J. P., and Cole P. W. (1967) Mechanism of action of guinea pig liver transglutaminase: II. the role of metal in enzyme activation. J. Biol. Chem. 242, 1838–1844 - PubMed
    1. Kim S. Y. (2006) Transglutaminase 2 in inflammation. Front. Biosci. 11, 3026–3035 - PubMed
    1. Lorand L., and Graham R. M. (2003) Transglutaminases: crosslinking enzymes with pleiotropic functions. Nat. Rev. Mol. Cell Biol. 4, 140–156 - PubMed
    1. Fesus L., and Piacentini M. (2002) Transglutaminase 2: an enigmatic enzyme with diverse functions. Trends Biochem. Sci. 27, 534–539 - PubMed

MeSH terms

Associated data