. 2017 Jan 1;117(1):376-387.
doi: 10.1152/jn.00451.2016. Epub 2016 Oct 26.

Short-latency allocentric control of saccadic eye movements

Affiliations

Short-latency allocentric control of saccadic eye movements

Mrinmoy Chakrabarty et al. J Neurophysiol. .

Abstract

It is generally accepted that the neural circuits that are implicated in saccade control use retinotopically coded target locations. However, several studies have revealed that nonretinotopic representation is also used. This idea raises a question about whether nonretinotopic coding is egocentric (head or body centered) or allocentric (environment centered). In the current study, we hypothesized that allocentric coding may play a crucial role in immediate saccade control. To test this hypothesis, we used an immediate double-step saccade task toward two sequentially flashed targets with a frame in the background, and we examined whether the end point of the second saccade was affected by a transient shift of the background that participants were told to ignore. When the background was shifted transiently upward (or downward) during the flash of the second target, the second saccade generally erred the target downward (or upward), which was in the direction opposite to the shift of the background. The effect on the second saccade became significant within 150 ms after the frame was presented for decoding and was built up for 200 ms thereafter. When the second saccade was not adjusted, a small, corrective saccade followed within 300 ms. The effect scaled linearly with the shift size up to 3° for a noncorrective second saccade and up to 6° for a corrective saccade. The present results show that an allocentric location of a target is rapidly represented by the brain and used for controlling saccades.

New & noteworthy: We found that the saccade end point was shifted from the actual target position toward the direction expected from allocentric coding when a large frame in the background was transiently shifted during the period of target presentation. The effect occurred within 150 ms. The present study provides direct evidence that the brain rapidly uses allocentric coding of a target to control immediate saccades.

Keywords: allocentric coordinate; background frame; saccadic eye movements.


Figures

Fig. 1.
Fig. 1.
Experimental procedures. A: a double-step saccade task (test trials) is represented. Each trial started with presentation of a fixation cross in the center (Fixation) that appeared for a random time duration (1,500–2,000 ms) with a rectangular frame in the background (12 × 20°). Then, target 1 (T1; green square) was presented for 83 ms. After a blank of 150 ms, target 2 (T2; red square) was presented for 83 ms with the frame at 1 of 3 positions, as shown in D. A blank of 150 ms followed, and then the frame was presented again at the same location as in the start frame for 1,300 ms. B: a single-step saccade task (catch trials) is shown. The procedure was the same as in the double-step saccade task until T1 presentation for 83 ms. Then, T1 disappeared, leaving the frame for 1,500 ms at the same location. C: typical saccade trajectories in a double-step saccade trial are demonstrated. The trace shows the first saccade from the central fixation to T1 (green square) and then the second to T2 (red square). The trajectories crossed 2 imaginary border lines at −4 and 4° (dotted lines), which were not presented actually but were used to judge whether the trial was valid. D: the expected changes in the second saccade, due to displacements of the background frame, are presented. During T2 presentation, the frame was either kept still (top; Frame STAY), displaced above (middle; Frame UP), or displaced below (bottom; Frame DOWN). If the T2 position were encoded and then decoded relative to the background frame, then the end point of the second saccade to T2 would shift in the direction opposite the frame displacement (yellow circles) from the actual T2 position (red circles).
Fig. 2.
Fig. 2.
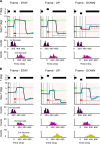
Typical gaze behaviors in the Frame STAY/UP/DOWN conditions. A: examples in noncorrective trials are presented. Top: vertical positions of the background frame plotted against the time. The frame was transiently shifted up (Frame-UP) or down (Frame-DOWN) by 3°. Second from top: changes in the vertical gaze positions (black lines). The participant made the first saccade (onset marked by cyan circles) to T1 (green dotted lines) and then the second saccade (onset and offset marked by cyan triangles) to T2 (red dotted lines). The immediate y error was defined as the deviation between the inverted cyan triangles and red dotted lines. The gaze position at 300 ms after the second saccade offset is marked with cyan squares (final gaze position). The final y error was defined as the deviation between the squares and red dotted lines. Note in Frame UP and DOWN conditions that the y errors were deviated toward the blue dotted lines that show the T2 position relative to the frame. Second from bottom and bottom: onset-latency histograms for the first and second saccades, which were measured from the T1 and T2 onsets, respectively. B: examples in corrective trials are presented. Note that the participant made the third corrective saccade in which onset is marked by cyan asterisks (second from top). Bottom: onset-latency histograms for the third saccade measured from the T2 onset. Other conventions are the same as in A.
Fig. 3.
Fig. 3.
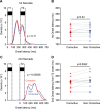
Comparison of saccade-onset latencies in the corrective and noncorrective trials. A: the onset-latency distribution is shown for the first saccade. The width of the smoothing time window was 20 ms. Note overlaps of the distribution for the corrective (red) and noncorrective trials (blue). P = 0.11, Kolmogorov-Smirnov (KS) test. B: comparison of the mean onset latency of the first saccade across the 13 participants. C: onset-latency distribution of the second saccade. Note that the first peak is greater in the corrective trials (P = 0.00028, KS test). D: comparison of the mean onset latency of the second saccade. Note a significant difference between the corrective and noncorrective trials [paired t-test, t(12) = −3.4, P = 0.0052]. Before applying the t-test, Lilliefors tests were used to confirm that the mean onset latencies distributed in a Gaussian manner (corrective: P = 0.55; noncorrective: P = 0.15).
Fig. 4.
Fig. 4.
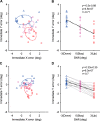
Correlations between the final errors and the frame shift. A: the distribution of the final errors in the Frame STAY (magenta circles), UP (red squares), and DOWN (blue triangles) conditions is demonstrated. Data from all valid trials are shown for 1 typical participant. Dotted colors show a range of 1 SD. B: the final y error is plotted against the amplitude of the shift using the same data as in A. Note a negative correlation (r = −0.84) with a slope of −0.58. The black dotted line shows a regression line (y = −0.58x −1.1). The P value of correlation is also shown. C: the median final y error is plotted against the median final x error for each of 13 participants in Frame STAY (magenta circle), UP (red squares), and DOWN (blue triangles) conditions. D: the median y error is plotted against the amplitude of the frame shift. Each gray, thin line connects data from the same participant. Other conventions are the same as in B.
Fig. 5.
Fig. 5.
Correlation between the immediate errors and the frame shift in the noncorrective trials. A: distribution of the immediate errors in the Frame STAY (magenta circles), UP (red squares), and DOWN (blue triangles) conditions is presented. Data from the noncorrective trials are shown for 1 typical participant. B: the immediate y error is plotted against the amplitude of the shift using the same data as in A. C: the median immediate y error is plotted against the median immediate x error for each of 13 participants. D: the median immediate y error is plotted against the amplitude of the frame shift. Other conventions are the same as in Fig. 4.
Fig. 6.
Fig. 6.
Effects of the latency of the second saccade on the correlation between the immediate y errors and the frame shift. Data from noncorrective trials are shown. A: the probability density (the width of the kernel smoothing window = 20 ms) of the second saccade offset latency. The latency was measured from the onset time of presentation of the final frame for decoding (time 0). Colored lines show frame conditions: STAY (magenta), UP (red), and DOWN (blue). B: P value of the error-shift correlation is plotted against the second saccade offset latency. Note that the abscissa represents the upper bound of each 100 ms-wide moving window (e.g., 0 ms represents a window of [−100 0] ms). A red dotted line shows the level of significance after the Bonferroni correction (P = 0.05/171). Note that the correlation became significant at 142 ms and more. C: the slope of the error-shift regression is plotted against the second saccade offset latency. D–F: the median immediate y error is plotted against the amplitude of the shift for each of 13 participants. Data are shown according to the second offset latency: [0, 100] ms (D), [50, 150] ms (E), and [250, 300] ms (F). Note that correlation was significant in E and F but not in D.
Fig. 7.
Fig. 7.
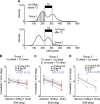
Effects of the latency of the first saccade on the correlation between the immediate y errors and the frame shift. Data from noncorrective trials are shown. A: all noncorrective trials were grouped into 3, according to the offset (top) and onset (bottom) latencies. Top: the left, hatched region shows Group 1 trials in which the first saccade was completed before T2 presentation, as indicated by a horizontal bar from 233 to 316 ms. Bottom: the right, hatched region shows Group 3 trials in which the first saccade occurred after presenting T2. All of the others in between were classified as Group 2, in which T2 slipped, to some extent, during the first saccade. B–D: the median immediate y error of 13 participants is plotted against the amplitude of frame shift: STAY (magenta circles), UP (red squares), and DOWN (blue triangles) conditions for Group 1 (A), Group 2 (B), and Group 3 (C) trials. Brackets show the 95% confidence intervals for the slopes of regression. Note highly significant correlations in all groups.
Fig. 8.
Fig. 8.
Comparison of the effects of the frame shift on the immediate and final y errors in corrective trials. A: the immediate y error after the second saccade is plotted against the amplitude of the shift. B: the final y error after the third corrective saccade is plotted against the amplitude of the shift. Note a contrast between the minimal effects on the immediate y error (A) and the maximal effects after the corrective movements (B).
Fig. 9.
Fig. 9.
Correlation between the y errors and the amplitude of the frame shift (Experiment 2). A and B: the immediate (A) and final (B) y errors are plotted against the amplitude of the frame shift. Data from 1 typical participant are presented. Blue and red lines show the results of linear regressions within the range of shift from −3 to 3° (blue) and at both ends (−6 and 6°; red). Brackets show the 95% confidence intervals for the slopes of regression. C and D: the median immediate (C) and final (D) y errors are plotted against the amplitude of the frame shift. Data from 13 participants are shown. Each thin line connects data from the same participant. Note a significant difference between the slopes (blue vs. red) calculated for the immediate y errors (C) but not for the final y errors (D).

References

    1. Aivar MP, Hayhoe MM, Chizk CL, Mruczek RE. Spatial memory and saccadic targeting in a natural task. J Vis 5: 177–193, 2005. - PubMed
    1. Brainard DH. The Psychophysics Toolbox. Spat Vis 10: 433–436, 1997. - PubMed
    1. Bruce CJ, Goldberg ME, Bushnell MC, Stanton GB. Primate frontal eye fields. II. Physiological and anatomical correlates of electrically evoked eye movements. J Neurophysiol 54: 714–734, 1985. - PubMed
    1. Cavanna AE, Trimble MR. The precuneus: a review of its functional anatomy and behavioural correlates. Brain 129: 564–583, 2006. - PubMed
    1. Chafee MV, Averbeck BB, Crowe DA. Representing spatial relationships in posterior parietal cortex: single neurons code object-referenced position. Cereb Cortex 17: 2914–2932, 2007. - PubMed

Publication types

LinkOut - more resources