

The acute inhibition of enteric glial metabolism with fluoroacetate alters calcium signaling, hemichannel function, and the expression of key proteins
- PMID: 27784805
- PMCID: PMC5236112
- DOI: 10.1152/jn.00507.2016
The acute inhibition of enteric glial metabolism with fluoroacetate alters calcium signaling, hemichannel function, and the expression of key proteins
Abstract
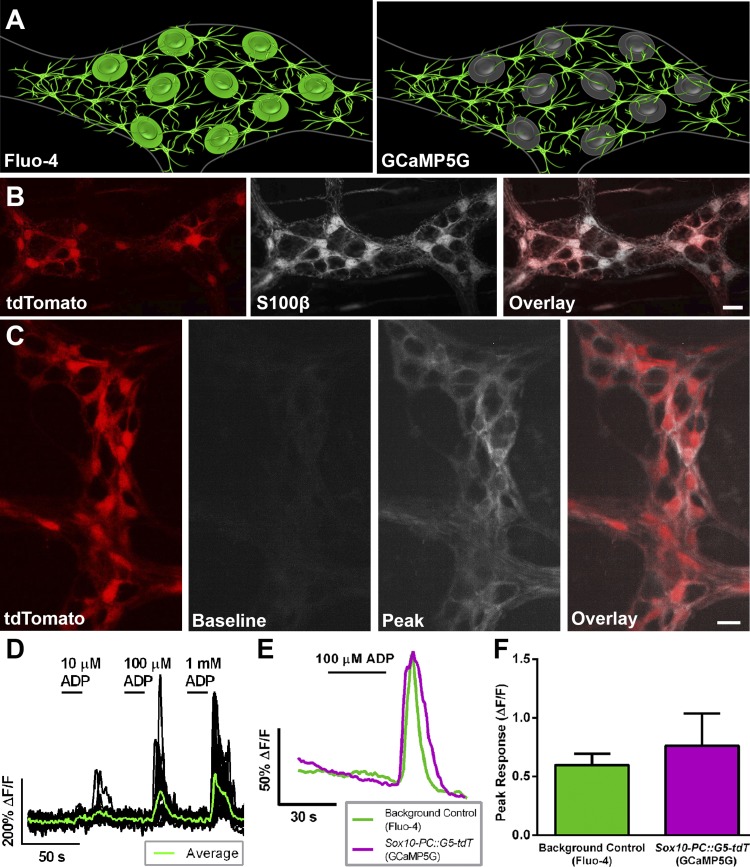
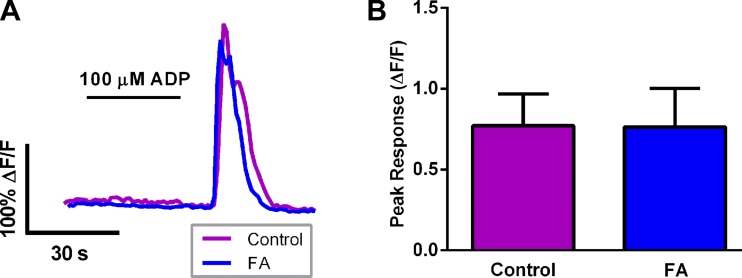
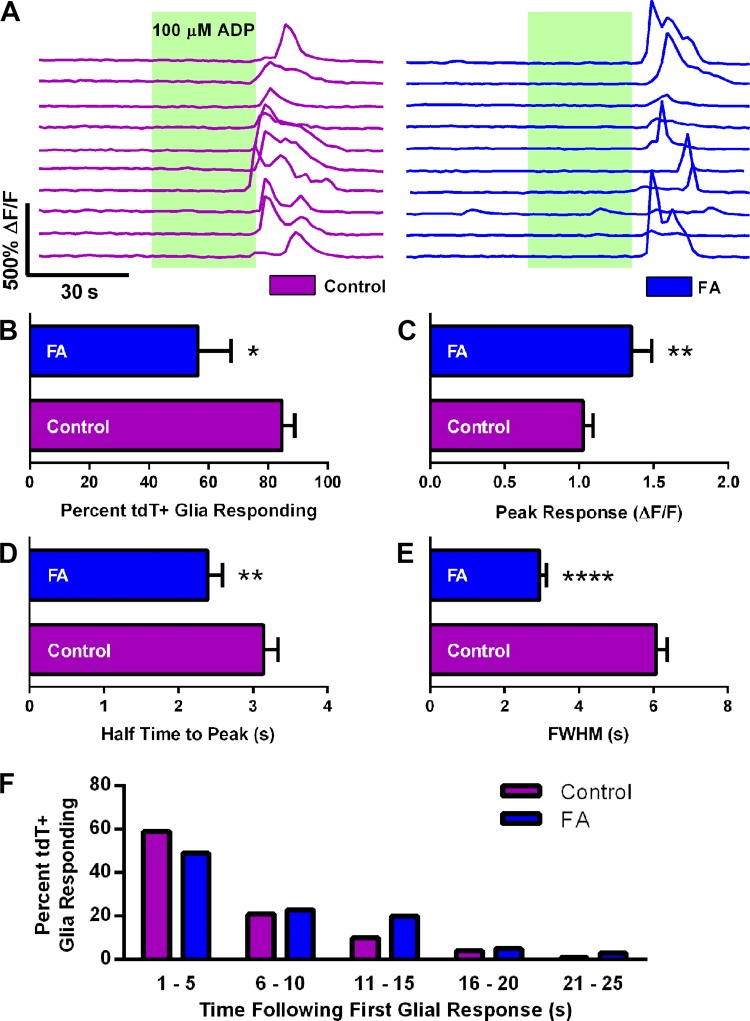
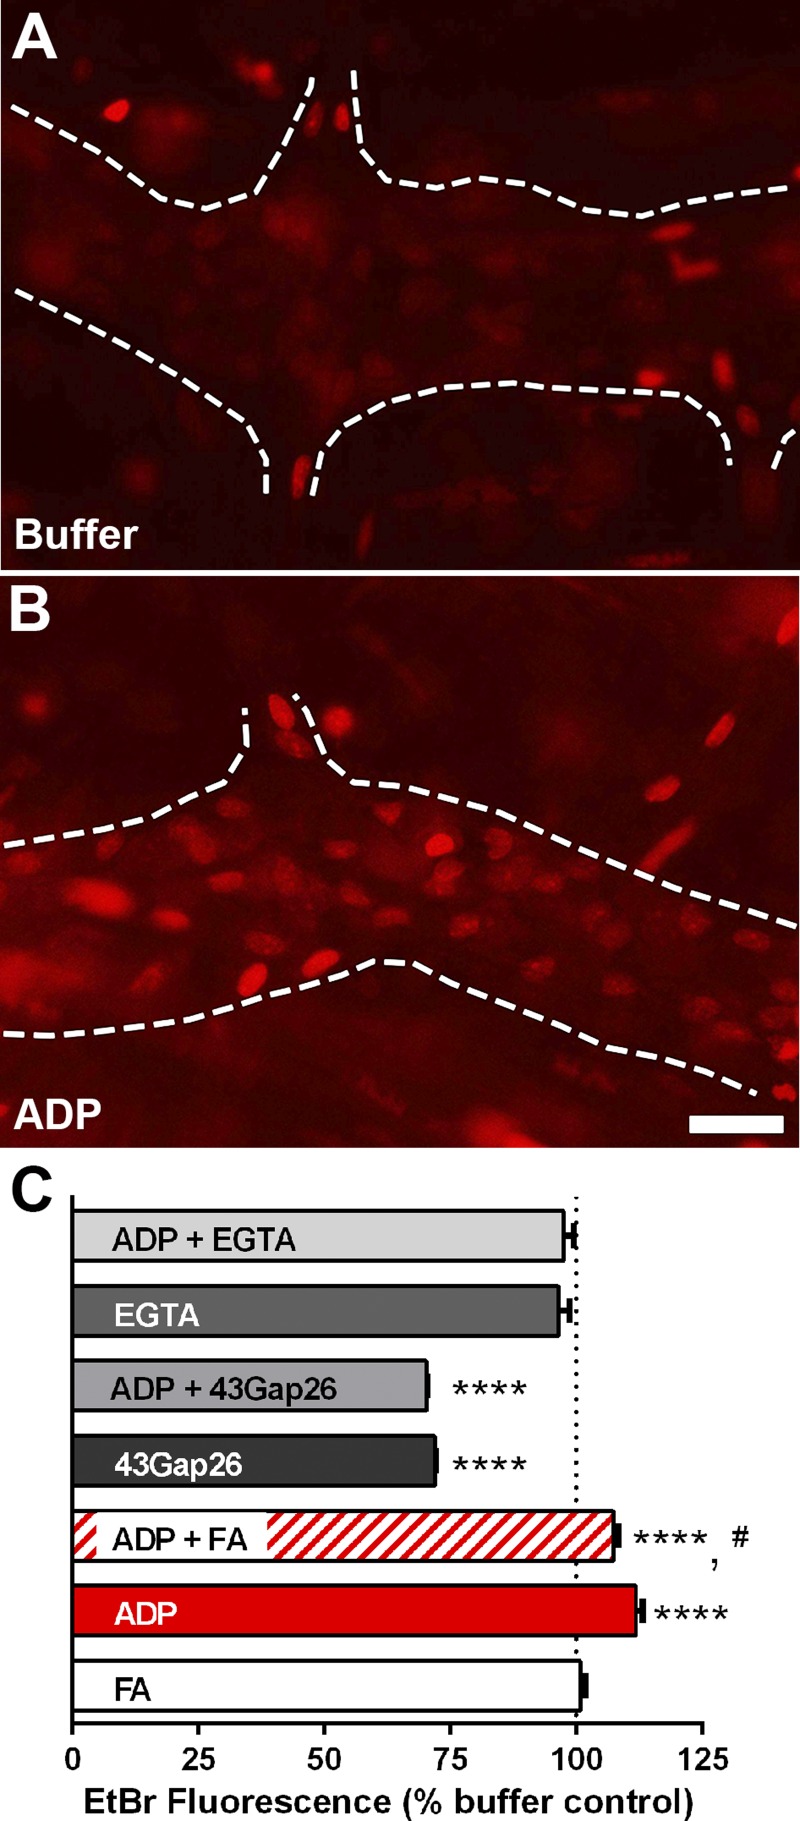
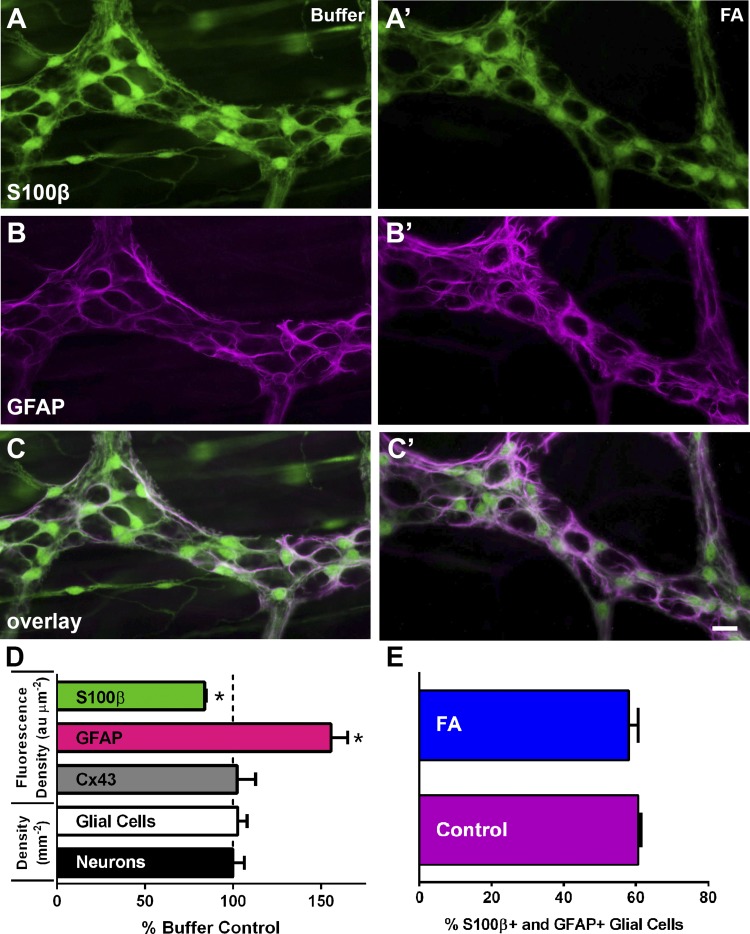
Glia play key roles in the regulation of neurotransmission in the nervous system. Fluoroacetate (FA) is a metabolic poison widely used to study glial functions by disrupting the tricarboxylic acid cycle enzyme aconitase. Despite the widespread use of FA, the effects of FA on essential glial functions such as calcium (Ca2+) signaling and hemichannel function remain unknown. Therefore, our goal was to assess specifically the impact of FA on essential glial cell functions that are involved with neurotransmission in the enteric nervous system. To this end, we generated a new optogenetic mouse model to study specifically the effects of FA on enteric glial Ca2+ signaling by crossing PC::G5-tdTomato mice with Sox10::creERT2 mice. FA did not change the peak glial Ca2+ response when averaged across all glia within a ganglion. However, FA decreased the percent of responding glia by 30% (P < 0.05) and increased the peak Ca2+ response of the glial cells that still exhibited a response by 26% (P < 0.01). Disruption of Ca2+ signaling with FA impaired the activity-dependent uptake of ethidium bromide through connexin-43 (Cx43) hemichannels (P < 0.05) but did not affect baseline Cx43-dependent dye uptake. FA did not cause overt glial or neurodegeneration, but glial cells significantly increased glial fibrillary acid protein by 56% (P < 0.05) following treatment with FA. Together, these data show that the acute impairment of glial metabolism with FA causes key changes in glial functions associated with their roles in neurotransmission and phenotypic changes indicative of reactive gliosis.
New & noteworthy: Our study shows that the acute impairment of enteric glial metabolism with fluoroacetate (FA) alters specific glial functions that are associated with the modification of neurotransmission in the gut. These include subtle changes to glial agonist-evoked calcium signaling, the subsequent disruption of connexin-43 hemichannels, and changes in protein expression that are consistent with a transition to reactive glia. These changes in glial function offer a mechanistic explanation for the effects of FA on peripheral neuronal networks.
Keywords: autonomic nervous system; enteric glial cells; enteric nervous system; glia; intestine.
Copyright © 2017 the American Physiological Society.
Figures
Similar articles
-
Heterogeneity and phenotypic plasticity of glial cells in the mammalian enteric nervous system.Glia. 2015 Feb;63(2):229-41. doi: 10.1002/glia.22746. Epub 2014 Aug 26. Glia. 2015. PMID: 25161129
-
Ca2+ responses in enteric glia are mediated by connexin-43 hemichannels and modulate colonic transit in mice.Gastroenterology. 2014 Feb;146(2):497-507.e1. doi: 10.1053/j.gastro.2013.10.061. Epub 2013 Nov 6. Gastroenterology. 2014. PMID: 24211490 Free PMC article.
-
Enteric glial activity regulates secretomotor function in the mouse colon but does not acutely affect gut permeability.J Physiol. 2017 Jun 1;595(11):3409-3424. doi: 10.1113/JP273492. Epub 2017 Feb 22. J Physiol. 2017. PMID: 28066889 Free PMC article.
-
Analysis of enteric neurons, glia and their interactions using explant cultures of the myenteric plexus.Dev Neurosci. 1987;9(4):201-27. doi: 10.1159/000111623. Dev Neurosci. 1987. PMID: 3322784 Review.
-
Use of fluorocitrate and fluoroacetate in the study of brain metabolism.Glia. 1997 Sep;21(1):106-13. Glia. 1997. PMID: 9298853 Review.
Cited by
-
Astrocyte Cell Surface Antigen 2 and Other Potential Cell Surface Markers of Enteric glia in the Mouse Colon.ASN Neuro. 2022 Jan-Dec;14:17590914221083203. doi: 10.1177/17590914221083203. ASN Neuro. 2022. PMID: 35593118 Free PMC article.
-
Optogenetic and chemogenetic techniques for neurogastroenterology.Nat Rev Gastroenterol Hepatol. 2018 Jan;15(1):21-38. doi: 10.1038/nrgastro.2017.151. Epub 2017 Nov 29. Nat Rev Gastroenterol Hepatol. 2018. PMID: 29184183 Review.
-
Sexually Dimorphic Effects of Histamine Degradation by Enteric Glial Histamine N-Methyltransferase (HNMT) on Visceral Hypersensitivity.Biomolecules. 2023 Nov 14;13(11):1651. doi: 10.3390/biom13111651. Biomolecules. 2023. PMID: 38002333 Free PMC article.
-
Cholinergic activation of enteric glia is a physiological mechanism that contributes to the regulation of gastrointestinal motility.Am J Physiol Gastrointest Liver Physiol. 2018 Oct 1;315(4):G473-G483. doi: 10.1152/ajpgi.00155.2018. Epub 2018 Jun 21. Am J Physiol Gastrointest Liver Physiol. 2018. PMID: 29927320 Free PMC article.
-
Enteric Glia Modulate Macrophage Phenotype and Visceral Sensitivity following Inflammation.Cell Rep. 2020 Sep 8;32(10):108100. doi: 10.1016/j.celrep.2020.108100. Cell Rep. 2020. PMID: 32905782 Free PMC article.
References
-
- Agulhon C, Fiacco TA, McCarthy KD. Hippocampal short- and long-term plasticity are not modulated by astrocyte Ca2+ signaling. Science 327: 1250–1254, 2010. - PubMed
-
- Akerboom J, Chen TW, Wardill TJ, Tian L, Marvin JS, Mutlu S, Calderón NC, Esposti F, Borghuis BG, Sun XR, Gordus A, Orger MB, Portugues R, Engert F, Macklin JJ, Filosa A, Aggarwal A, Kerr RA, Takagi R, Kracun S, Shigetomi E, Khakh BS, Baier H, Lagnado L, Wang SS, Bargmann CI, Kimmel BE, Jayaraman V, Svoboda K, Kim DS, Schreiter ER, Looger LL. Optimization of a GCaMP calcium indicator for neural activity imaging. J Neurosci 32: 13819–13840, 2012. - PMC - PubMed
-
- Bazargani N, Attwell D. Astrocyte calcium signaling: the third wave. Nat Neurosci 19: 182–189, 2016. - PubMed
Publication types
MeSH terms
Substances
Grants and funding
LinkOut - more resources
Full Text Sources
Other Literature Sources
Molecular Biology Databases
Miscellaneous