. 2016 Oct 27:6:36016.
doi: 10.1038/srep36016.

Goblet Cell Hyperplasia Requires High Bicarbonate Transport To Support Mucin Release

Affiliations

Goblet Cell Hyperplasia Requires High Bicarbonate Transport To Support Mucin Release

Giulia Gorrieri et al. Sci Rep. .

Abstract

Goblet cell hyperplasia, a feature of asthma and other respiratory diseases, is driven by the Th-2 cytokines IL-4 and IL-13. In human bronchial epithelial cells, we find that IL-4 induces the expression of many genes coding for ion channels and transporters, including TMEM16A, SLC26A4, SLC12A2, and ATP12A. At the functional level, we find that IL-4 enhances calcium- and cAMP-activated chloride/bicarbonate secretion, resulting in high bicarbonate concentration and alkaline pH in the fluid covering the apical surface of epithelia. Importantly, mucin release, elicited by purinergic stimulation, requires the presence of bicarbonate in the basolateral solution and is defective in cells derived from cystic fibrosis patients. In conclusion, our results suggest that Th-2 cytokines induce a profound change in expression and function in multiple ion channels and transporters that results in enhanced bicarbonate transport ability. This change is required as an important mechanism to favor release and clearance of mucus.


Figures
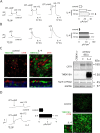
Figure 1
Figure 1. Upregulation of CFTR and TMEM16A function by IL-4.
(A,B) Representative traces (left) and bar graphs (right) showing CFTR- and TMEM16A/CaCC-dependent currents measured by short-circuit current technique in human bronchial epithelial cells kept under control conditions or incubated for 24 or 72 hrs with IL-4 (10 ng/ml). CFTR currents were first activated with CPT-cAMP (100 μM) and then blocked with CFTRinh-172 (10 μM). TMEM16A/CaCC currents were instead activated with 100 μM UTP (in the presence of the CFTR inhibitor). Bar graphs report the size of the current drop induced by CFTRinh-172 (A) or the maximal amplitude of the current elicited by UTP (B). Data are the mean ± sem of 13–21 experiments (BE37 and BE63 cells). ***p < 0.001 vs. control. #p < 0.05 vs. IL-4 for 24 hrs. (C) Detection of TMEM16A and CFTR proteins by immunofluorescence (left) and by western blot (right). Cells were treated with and without IL-4 or 72 hrs. Immunofluorescence images show xy (top; scale bar 20 μm) or xz (bottom; scale bar 10 μm) sections. In western blots, Na+/K+-ATPase β1 and GAPDH were also revealed as controls. As expected, the C464.8 antibody against Na+/K+-ATPase β1 revealed two bands. Western blot results for CFTR and TMEM16A are presented as cropped images. Full-length images are shown in Supplementary Fig. 1. (D) Short-circuit recordings (left) and immunofluorescence (right) from bronchial epithelial cells obtained from F508del/F508del CF patients. CFTR currents are significantly increased by IL-4 treatment (n = 15–16; p < 0.001; BE43, BE49, and BE91 cells). TMEM16A and CFTR expression, detected by immunofluorescence (scale bar 30 μm), is increased by IL-4 also in CF cells. The small image is an enlargement of the cells treated with IL-4 to show in more detail CFTR localization.
Figure 2
Figure 2. Upregulation of channels and transporters expression by IL-4.
Bar graphs report the relative change in expression (y axis: signed ratio, SR) of the indicated genes after treatment of bronchial epithelial cells with IL-4 (10 ng/ml) for 6, 12, 24, and 72 hrs. Data were obtained by microarray analysis on three separate bronchial cell preparations (BE37 cells). The asterisks indicate a significant increase in expression relative to control cells (FDR < 0.05; data, including signed ratio and FDR, are also reported in Supplementary Tables 1–4 for the top 200 upregulated genes).
Figure 3
Figure 3. Immunofluorescence detection of proteins modulated by IL-4.
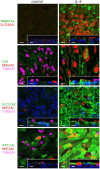
Representative confocal microscope images show extent of expression and subcellular localization of TMEM16A, SLC26A4, carbonic anhydrase 2 (CA2), SLC12A2, and ATP12A (images taken from BE37 cells; similar results were obtained from BE63 cells). Whenever permitted by the combination of primary antibodies, acetylated tubulin and MUC5AC were also stained as markers of ciliated and goblet cells, respectively. Bronchial epithelia were kept under control conditions or treated with IL-4 for 72 hrs. Larger images: xy sections (scale bar: 20 μm). Inset: xz sections (scale bar: 10 μm). Images with a different scale of view are shown in Supplementary Fig. 2.
Figure 4
Figure 4. Effect of extracellular Cl removal.
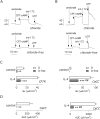
(A,B) Representative short-circuit current recordings showing CFTR and CaCC currents in cells kept under control conditions (A) or treated with IL-4 for 72 hrs (B). Note the different scale bars. Experiments were done in normal saline solution (top) or in the absence of Cl (bottom). (C) Bar graphs reporting CFTR (left) and TMEM16A data (right) under the different conditions. CFTR values are taken from the size of CFTRinh-172 effect. CaCC values represent the maximal current induced by UTP. (D) CaCC currents were also quantified as the area under the curve (AUC) of UTP-induced responses. **p < 0.01; ***p < 0.001 vs. currents with Cl. ##p < 0.01 vs. cells not treated with IL-4 (n = 6 per condition; BE37 cells).
Figure 5
Figure 5. Effect of anion transport inhibitors.
(A,B) Representative short-circuit current recordings and bar graphs reporting the effect of bumetanide and S0859 on CFTR-dependent currents in cells under control conditions (A) or treated with IL-4 for 72 hrs (B). The value of inhibition reported in bar graphs is calculated from the total CFTR current (current activated by CPT-cAMP minus the current remaining after CFTRinh-172). B: bumetanide. B + S: bumetanide + S0859. *p < 0.05; ***p < 0.001 vs. bumetanide alone (n = 8 per condition; BE37 cells). (C,D) Representative short-circuit current recordings and bar graphs reporting the effect of bumetanide and S0859 on UTP-induced currents in cells under control conditions (C) or treated with IL-4 for 72 hrs (D). Activity of TMEM16A/CaCC was quantified as current peak or as AUC. *p < 0.05; **p < 0.01; ***p < 0.001 vs. currents with no inhibitors. #p < 0.05; ##p < 0.01; ###p < 0.001 vs. currents with bumetanide alone (n = 8 per condition).
Figure 6
Figure 6. Intracellular pH measurements in bronchial epithelia.
Representative traces show intracellular pH values measured with BCECF probe with and without apical Cl. Bar graphs show changes in pH after removal of apical Cl in the absence and presence of apical UTP. (A) Bronchial epithelial cells without IL-4 treatment (n = 7). (B) Cells treated with IL-4 for 72 hrs (n = 7). (C) Cells treated with IL-4 and UTP applied in the presence of CaCCinh-A01 (n = 5). **p < 0.01; ***p < 0.001 (BE43 cells).
Figure 7
Figure 7. Alteration of apical fluid by IL-4.
Ion composition and pH of apical fluid from cells kept under control conditions or treated with IL-4. A fixed volume (150 μl) of saline solution was applied to the apical side of epithelia and recovered after 48 hours. Dotted line shows the initial concentration of each ion in the original solution. For pH, values were determined with litmus strips (circles) or with pH-sensitive electrodes (squares). *p < 0.05; **p < 0.01 vs. control (n = 3–4; BE37 cells).
Figure 8
Figure 8. Mucus release by bronchial epithelia.
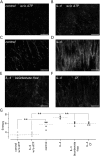
(A–F) Representative images showing staining of mucus with fluorescent nanospheres added (50 μl of saline solution) on the apical side of tilted epithelia. Where indicated (C–F) the added solution contained ATP (100 μM) to stimulate mucus release. Experiments were done on epithelia treated with and without IL-4 (10 ng/ml) for 72 hours as indicated. Scale bar size is 500 μm. (G) Quantification of mucus strands for the different conditions (n = 3–6 per condition; BE37 and BE43 cells). The effect of IL-4 was statistically significant (p < 0.01).
Figure 9
Figure 9. Mechanisms of anion secretion in bronchial epithelial cells exposed to IL-4.
For simplicity, the cartoon shows all channels and transporters within the same cell although some components (e.g. CFTR and TMEM16A) are localized in separate cell types. The NKCC1 transporter (SLC12A2) promotes the intracellular accumulation of Cl that is then secreted through TMEM16A and CFTR Cl channels. Bicarbonate is accumulated inside the cell by means of basolateral transporters and by conversion from CO2. Pendrin then mediates the exchange of extracellular Cl with intracellular HCO3. The apical membrane also contains the ATP12A K+/H+ pump and possibly a K+ channel. Secretion of K+ could be the mechanism controlling the acidification of apical fluid by ATP12A.

Similar articles

Cited by

References

    1. Knowles M. R. & Boucher R. C. Mucus clearance as a primary innate defense mechanism for mammalian airways. J. Clin. Invest. 109, 571–577 (2002). - PMC - PubMed
    1. Riordan J. R. CFTR function and prospects for therapy. Annu. Rev. Biochem. 77, 701–726 (2008). - PubMed
    1. Matsui H. et al. Evidence for periciliary liquid layer depletion, not abnormal ion composition, in the pathogenesis of cystic fibrosis airways disease. Cell 95, 1005–1015 (1998). - PubMed
    1. Boucher R. C. Airway surface dehydration in cystic fibrosis: pathogenesis and therapy. Annu. Rev. Med. 58, 157–170 (2007). - PubMed
    1. Pezzulo A. A. et al. Reduced airway surface pH impairs bacterial killing in the porcine cystic fibrosis lung. Nature 487, 109–113 (2012). - PMC - PubMed

Publication types