. 2016 Oct 27;7(10):e2439.
doi: 10.1038/cddis.2016.348.

Block of both TGF-β and IL-2 signaling impedes Neurophilin-1+ regulatory T cell and follicular regulatory T cell development

Affiliations

Block of both TGF-β and IL-2 signaling impedes Neurophilin-1+ regulatory T cell and follicular regulatory T cell development

Liang Li et al. Cell Death Dis. .

Abstract

Understanding the mechanisms that lead to autoimmunity is critical for defining potential therapeutic pathways. In this regard there have been considerable efforts in investigating the interacting roles of TGF-β and IL-2 on the function regulatory T cells. We have taken advantage of dnTGF-βRII Il2ra-/- (abbreviated as Il2ra-/-Tg) mouse model, which allows a direct mechanistic approach to define the relative roles of TGF-β and IL-2 on Treg development. Il2ra-/-Tg mice spontaneously developed multi-organ autoimmune diseases with expansion of pathogenic T cells and enhanced germinal center response at 3-4 weeks of age. Importantly, peripheral Treg cells from Il2ra-/-Tg mice demonstrated an activated Th1-like stable phenotype and normal in vitro suppressive function, while thymus Treg increased but manifested decreased suppressive function. Interestingly, neither thymus nor peripheral Treg cells of Il2ra-/-Tg mice contained Neuropilin-1+ or PD-1hi phenotype, resulting in defective follicular regulatory T (Tfr) cell development. Such defective Tfr development led to elevated follicular T helper cells, enhanced germinal center responses and increased plasma cell infiltration. These data demonstrate an important synergetic role of TGF-β and IL-2 in the generation, activation and stability of Treg cells, as well as their subsequent development into Tfr cells.


Figures

Figure 1
Figure 1
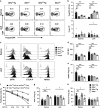
Multi-organ inflammation in Il2ra−/−Tg mice. (a) Survival curve of Il2ra−/−Tg (n=8), Il2ra−/− (n=8), Il2ra+/−Tg (n=8) and Il2ra+/− (n=8) mice. Cell counts of (b) spleen, (c) peripheral (axillary, inguinal and brachial) lymph nodes of Il2ra−/−Tg (n=12), Il2ra−/− (n=12), Il2ra+/−Tg (n=12) and Il2ra+/− (n=12) mice. (d) Naive T cell (CD44CD62L+) percentage and (e) IFN-γ secreting ability of CD4+ and CD8+ T cells in pLN from Il2ra−/−Tg (n=5), Il2ra−/− (n=5), Il2ra+/−Tg (n=5) and Il2ra+/− (n=5) mice. (f) Serum concentration of IFN-γ, TNF-α, IL-4 and IL-17A of Il2ra−/−Tg (n=6), Il2ra−/− (n=6), Il2ra+/−Tg (n=6) and Il2ra+/− (n=6) mice. Data are shown in mean±S.E.M. *P<0.05, **P<0.01, ***P<0.001. (Student's t test)
Figure 2
Figure 2
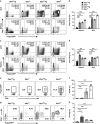
Enhanced germinal center response in Il2ra−/−Tg mice. Representative flow cytometry result of (a) follicular helper T cells (PD-1hiCXCR5+ in CD4+CD19) and (c) germinal center B cells (GL7+CD95+ in CD19+) and (e) plasma cells (CD19loB220-CD138hi in total cells) in pLN of Il2ra−/−Tg and littermate control mice. (b) Follicular helper T-cell percentage in CD4+ T cells and absolute number in pLN of Il2ra−/−Tg (n=8), Il2ra−/− (n=8), Il2ra+/−Tg (n=8) and Il2ra+/− (n=8) mice. (d) Germinal center B-cell percentage in B cells and number in pLN of Il2ra−/−Tg (n=8), Il2ra−/− (n=7), Il2ra+/−Tg (n=7) and Il2ra+/− (n=7) mice. (f) Plasma cell percentage and number in pLN of Il2ra−/−Tg (n=6), Il2ra−/− (n=6), Il2ra+/−Tg (n=6) and Il2ra+/− (n=6) mice. (g) Serum concentration of IgG1, IgG2a, IgG2b, IgG3 and IgM of Il2ra−/−Tg (n=7), Il2ra−/− (n=7), Il2ra+/−Tg (n=7) and Il2ra+/− (n=7) mice. Data are shown in mean±S.E.M. *P<0.05, **P<0.01, ***P<0.001. (Student's t test)
Figure 3
Figure 3
Dysregulated Treg percentage and function in Il2ra−/−Tg mice. (a) Representative flow cytometry result of Treg cell percentage in CD4 single-positive T cells in thymus and pLN of Il2ra−/−Tg and control mice. (b) Statistical analysis of Treg percentage and absolute number in thymus and pLN of Il2ra−/−Tg (n=9), Il2ra−/− (n=9), Il2ra+/−Tg (n=9) and Il2ra+/− (n=9) mice. (c) Expression of GITR, CTLA-4 and Helios of Treg cells in thymus and pLN from Il2ra−/−Tg and littermate control mice. (d) Foxp3 expression as indicated by GFP MFI of Treg cells in thymus and pLN of Il2ra−/−Tg (n=9), Il2ra−/− (n=9), Il2ra+/−Tg (n=9) and Il2ra+/− (n=9) mice. (e) Percentage of CD69+ Treg cells in thymus and pLN of Il2ra−/−Tg (n=5), Il2ra−/− (n=5), Il2ra+/−Tg (n=5) and Il2ra+/− (n=5) mice. (f) CFSE-labeled CD45.1+CD4+Foxp3-GFP-CD62L+ T cells were co-cultured with CD45.2+CD4+ Foxp3-GFP+ Treg cells from thymus and spleen/pLN of Il2ra−/−Tg and Il2ra+/− mice in the presence of soluble anti-CD3 (2 μg/ml) and anti-CD28 (1 μg/ml) and mitomycin C treated supporter cells for 72 h. Percentage of proliferated cells among live target cells were analyzed. (g) Ki-67 staining of Treg cells in thymus and pLN of Il2ra−/−Tg (n=5), Il2ra−/− (n=6), Il2ra+/−Tg (n=5) and Il2ra+/− (n=4) mice. (h) Annexin V staining of Treg cells in thymus and pLN of Il2ra−/−Tg (n=7), Il2ra−/− (n=7), Il2ra+/−Tg (n=7) and Il2ra+/− (n=7) mice. Data are shown in mean±S.E.M. *P<0.05, **P<0.01, ***P<0.001. (Student's t test)
Figure 4
Figure 4
Treg cells are skewed to Th1-like stable phenotype in Il2ra−/−Tg mice. (a) Percentage of CXCR3+ Treg cells in thymus and pLN of Il2ra−/−Tg (n=5), Il2ra−/− (n=4), Il2ra+/−Tg (n=4) and Il2ra+/− (n=5) mice. (b) Percentage of Eomes+ Treg cells in thymus and pLN of Il2ra−/−Tg (n=4), Il2ra−/− (n=3), Il2ra+/−Tg (n=3) and Il2ra+/− (n=6) mice. (c) Representative flow cytometry result of Foxp3 and CXCR3, Eomes expression on CD4+CD8 T cells from thymus and pLN of Il2ra−/−Tg and control mice. (d) IFN-γ secreting ability of thymus and pLN Treg cells from Il2ra−/−Tg (n=5), Il2ra−/− (n=4), Il2ra+/−Tg (n=5) and Il2ra+/− (n=5) mice. (e) Ly6C expression of thymus and pLN Treg cells from Il2ra−/−Tg (n=6), Il2ra−/− (n=6), Il2ra+/−Tg (n=6) and Il2ra+/− (n=6) mice. (f) Percentage of Foxp3 TSDR CpG demethylation of thymus and spleen/pLN Treg cells from Il2ra−/−Tg and Il2ra+/− mice. Data are shown in mean±S.E.M. *P<0.05, **P<0.01, ***P<0.001. (Student's t test)
Figure 5
Figure 5
Defective Nrp-1+ Treg and follicular regulatory T-cell development in Il2ra−/−Tg mice. (a) Representative flow cytometry results of Nrp-1 expression on Treg and conventional CD4+ T cells from thymus and pLN of Il2ra−/−Tg and littermate control mice. (b) Nrp-1+ percentage of Treg in thymus and pLN from Il2ra−/−Tg (n=5), Il2ra−/− (n=5), Il2ra+/−Tg (n=5) and Il2ra+/− (n=5) mice. (c) Representative flow cytometry results of PD-1 expression on Treg and conventional CD4+ T cells from thymus and pLN of Il2ra−/−Tg and littermate control mice. (d) PD-1+ percentage of Treg in thymus and pLN from Il2ra−/−Tg (n=5), Il2ra−/− (n=5), Il2ra+/−Tg (n=5) and Il2ra+/− (n=5) mice. (e) Representative flow cytometry result of Tfr in Tfh cells in pLN of Il2ra−/−Tg and littermate control mice. Percentage of Tfr cells (f) in Tfh cells and (h) in Treg cells in pLN of Il2ra−/−Tg (n=6), Il2ra−/− (n=6), Il2ra+/−Tg (n=6) and Il2ra+/− (n=6) mice. (g) Nrp-1 and Foxp3 expression of Tfh cells in pLN of Il2ra−/−Tg and littermate control mice. Data are shown in mean±S.E.M. ***P<0.001. (Student's t test)
Figure 6
Figure 6
WT Treg cells suppress Il2ra−/−Tg T cells after bone marrow chimera. (a) Strategy of bone marrow chimera: 5 × 10⁵ T-cell depleted bone marrow cells from CD45.1 Foxp3GFP mice were mixed with 5 × 10⁵ T-cell depleted bone marrow cells from CD45.2 Il2ra−/−Tg or littermate control mice and transferred intravenously to lethally irradiated CD45.1 CD45.2 recipient mice. Mice were killed 10 weeks after bone marrow transfer. (b) Naive T cell (CD44CD62L+) percentage of pLN CD4+ and CD8+ T cells derived from Il2ra−/−Tg (n=3), Il2ra−/− (n=4), Il2ra+/−Tg (n=4) and Il2ra+/− (n=4) bone marrow. (c) Treg percentage in total CD4+ T cells after chimerism of Il2ra−/−Tg (n=5), Il2ra−/− (n=6), Il2ra+/−Tg (n=6) and Il2ra+/− (n=6) with WT bone marrow. (d) Tfh percentage of CD4+ T cells, (e) GC B percentage of B cells and (f) plasma cell percentage of total cells derived from Il2ra−/−Tg (n=5), Il2ra−/− (n=6), Il2ra+/−Tg (n=6) and Il2ra+/− (n=6) bone marrow. (g) Tfr cell percentage of Tfh cells after chimerism of Il2ra−/−Tg (n=4), Il2ra−/− (n=5), Il2ra+/−Tg (n=5) and Il2ra+/− (n=5) with WT bone marrow. Data are shown in mean±S.E.M. **P<0.01. (Student's t test)

Similar articles

Cited by

References

    1. Hori S, Nomura T, Sakaguchi S. Control of regulatory T cell development by the transcription factor Foxp3. Science 2003; 299: 1057–1061. - PubMed
    1. Brunkow ME, Jeffery EW, Hjerrild KA, Paeper B, Clark LB, Yasayko SA et al. Disruption of a new forkhead/winged-helix protein, scurfin, results in the fatal lymphoproliferative disorder of the scurfy mouse. Nat Genet 2001; 27: 68–73. - PubMed
    1. Bennett CL, Christie J, Ramsdell F, Brunkow ME, Ferguson PJ, Whitesell L et al. The immune dysregulation, polyendocrinopathy, enteropathy, X-linked syndrome (IPEX) is caused by mutations of FOXP3. Nat Genet 2001; 27: 20–21. - PubMed
    1. Sakaguchi S, Yamaguchi T, Nomura T, Ono M. Regulatory T cells and immune tolerance. Cell 2008; 133: 775–787. - PubMed
    1. Chen Q, Kim YC, Laurence A, Punkosdy GA, Shevach EM. IL-2 controls the stability of Foxp3 expression in TGF-beta-Induced Foxp3(+) T cells in vivo. J Immunol 2011; 186: 6329–6337. - PMC - PubMed

Publication types

MeSH terms

LinkOut - more resources