. 2016 Dec 5;8(12):1301-1311.
doi: 10.1039/c6ib00108d.

Self-assembly of vascularized tissue to support tumor explants in vitro

Affiliations

Self-assembly of vascularized tissue to support tumor explants in vitro

Despina Bazou et al. Integr Biol (Camb). .

Abstract

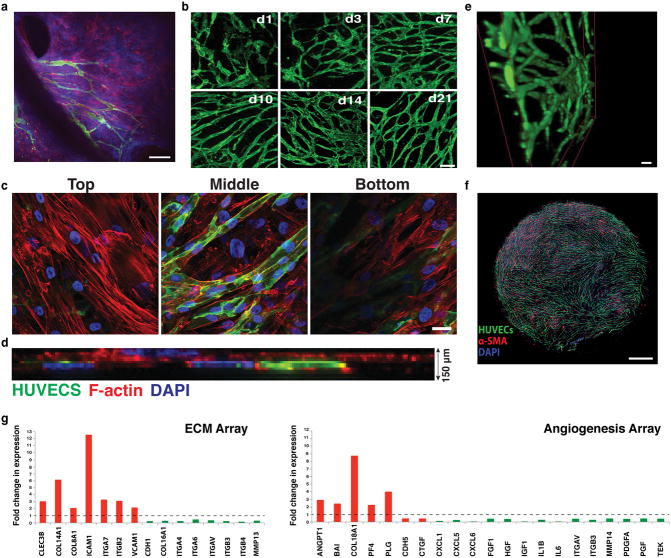
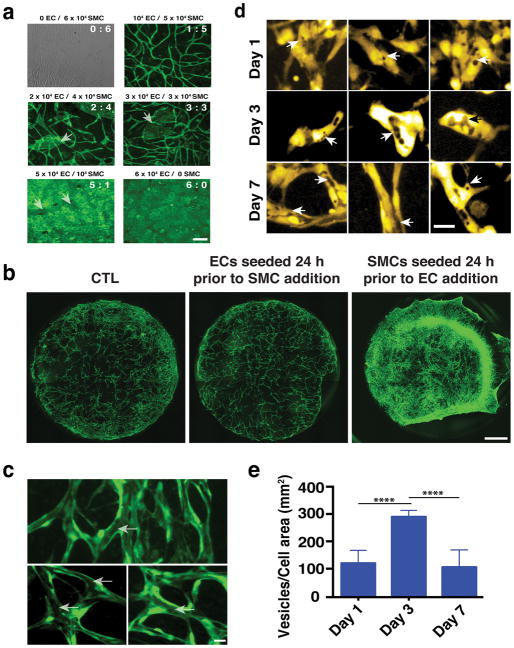
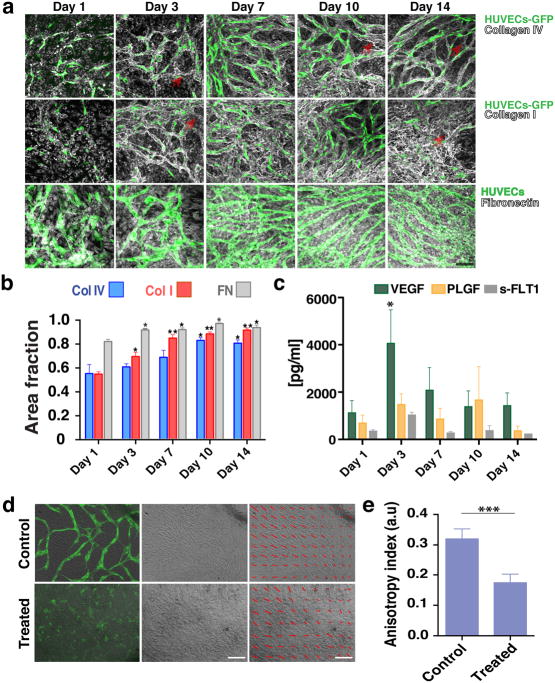
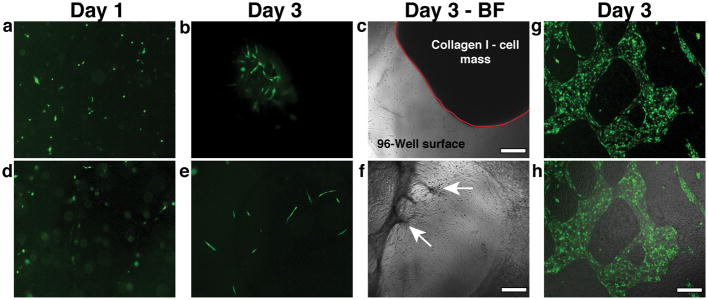
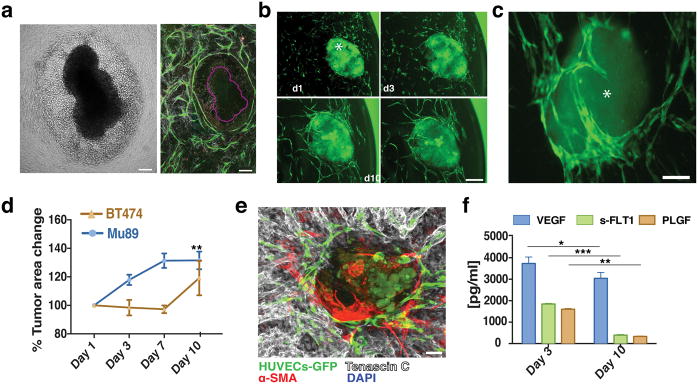
Testing the efficacy of cancer drugs requires functional assays that recapitulate the cell populations, anatomy and biological responses of human tumors. Although current animal models and in vitro cell culture platforms are informative, they have significant shortcomings. Mouse models can reproduce tissue-level and systemic responses to tumor growth and treatments observed in humans, but xenografts from patients often do not grow, or require months to develop. On the other hand, current in vitro assays are useful for studying the molecular bases of tumorigenesis or drug activity, but often lack the appropriate in vivo cell heterogeneity and natural microenvironment. Therefore, there is a need for novel tools that allow rapid analysis of patient-derived tumors in a robust and representative microenvironment. We have developed methodology for maintaining harvested tumor tissue in vitro by placing them in a support bed with self-assembled stroma and vasculature. The harvested biopsy or tumor explant integrates with the stromal bed and vasculature, providing the correct extracellular matrix (collagen I, IV, fibronectin), associated stromal cells, and a lumenized vessel network. Our system provides a new tool that will allow ex vivo drug-screening and can be adapted for the guidance of patient-specific therapeutic strategies.


Figures

Fig. 1
Fig. 1
Vascular network formation in vivo and in vitro. a) Intravital microscopy of vascularization on a silicone elastomer implanted in a transparent window of the mouse. Vascular sprouts (green) enter the system from left to right, preceded by α-SMA positive cells and the extracellular matrix they produce (blue). In this system the α-SMA cells exist in a layer that is distinct from the collagen and vessels. Scale bar, 50 μm. b) Recreating vascularization in vitro. Co-culturing HUVECs (green, CD31-AlexaFluor488 labeled) with SMCs (not shown here for clarity), the system self-assembles into a stable, interconnected network over 21 days (shown are images from days 1, 3, 7, 10, 14 and 21). Scale bar, 200 μm. c) Co-cultures (shown at Day 7 in culture) form a multi-layered tissue where SMCs are seen underneath as well as above the vessel network. HUVECs are shown in green (CD31-AlexaFluor488 labeled) while the F-actin of both cell populations is stained with Phalloidin-568 (red). Nuclear stain is DAPI (blue). Scale bar is 20 μm. d) Side view of a confocal stack showing the resulting multilayered tissue, consisting of cells and matrix that has a thickness of approximately 150 μm. e) 3-D reconstruction of part of an in vitro network. Scale bar, 50 μm. f) The network is complete, and spans across the entire well of the 96-well plate. Scale bar, 800 μm. g) qRT-PCR array for extracellular matrix and angiogenesis genes comparing Day 10 over Day1 co-cultures. Up-regulated genes are shown in red while down-regulated genes are shown in green.
Fig. 2
Fig. 2
Development of vascular networks. a) Micrographs illustrating the resultant vascular network when the ratio of ECs to SMCs changes. Vessels are shown in green. Scale bar is 50 μm. b) Live imaging of vascular network formation at Day 3 in culture following different seeding conditions. ECs are shown in green, while for reasons of clarity SMCs are not labelled. Scale bar, 1 mm. c) Vessels that form in the EC-SMC co-culture contain contiguous lumens (arrows) that extend throughout the network (three different examples are shown). Scale bar, 30 μm. d) Lumen formation by vesicle fusion. At Day 1 VVO structures (arrows) develop within individual endothelial cells. Significantly more VVOs were observed on Day 3; by Day 7, extensive fusion of these structures creates the lumens. Three different image fields are shown for each time point. e) VVO quantification shows that the number of individual vesicles was highest on day 3; after this, fusion reduced the number on distinct structures. Scale bar, 30 μm.
Fig. 3
Fig. 3
Co-cultures define their own microenvironment. a) Top row: Confocal immunofluorescence analysis revealed significant collagen IV (grey) staining around the vessel network (green) at Day 3. By Day 10 collagen IV had completely ensheathed the vessel network. Middle row: Collagen I (grey) was also produced and showed a similar peri-endothelial localization pattern in co-culture. Bottom row: Fibronectin (grey) was also abundantly produced by the co-cultures. Scale bar, 50 μm. b) Collagen I, collagen IV and fibronectin levels increased over time in EC-SMC co-cultures (assessed by the fractional area of staining in the IHC images). Error bars are standard errors from n = 3. c) ELISA results show a significant increase in VEGF levels at Day 3. s-FLT1 and PLGF were more constant. d) Top row: collective alignment of the SMCs was associated with vessel network formation and is apparent in the bright field image, At right: brightfield only; at left: brightfield with overlay of HUVECs (green). Bottom row: In fibronectin-treated wells (FN), SMCs form a non-aligned monolayer, and vessel network formation is minimal (bottom row, superimposed HUVECs-GFP). The SMC alignment is highlighted with red arrows in the last column. Scale bar, 150 μm. e) Measurements of the anisotropy index showed the loss of directionality of the SMCs. Control co-cultures at Day 3 have an anisotropy index of 0.32 ± 0.01, while fibronectin-treated co-cultures have a significantly lower anisotropy index (0.17 ± 0.01).
Fig. 4
Fig. 4
Addition of Exogenous Matrix components or substitution of fibroblasts for SMCs interferes with network formation. a, b) Mixing ECs and SMCs in collagen I (3 mg/ml) at Day 1 (a) resulted in isolated vessel segments at Day 3 (b). c) Collagen I matrix contraction was observed within 3 days- matrix-ECs-SMCs mass outlined with the red solid line. d) Mixing ECs and SMCs in fibrin (2.5 mg/ml) at Day 1 did not lead to vessel formation as shown in the fluorescent micrograph (e- Day 3). f) Fibrin also significantly contracted by Day 3, showing some anchor points to the underlying substratum (arrows). g) Co-culturing ECs with 10T1/2 cells did not induce vessel formation. ECs (shown in green) formed patches of monolayers within the 10T1/2 monolayer. h) superimposed brightfield and fluorescence micrographs showing the mosaic monolayer on the surface. Scale bar, 150 μm.
Fig. 5
Fig. 5
VTE cultures. a) Mu89 tumors disrupted, with many cells migrating away from the main tumor explant body when co-implanted with ECs-SMCs at Dy 0, as shown in the brightfield image. Vessels (green), in the mosaic confocal micrograph of the same tumor (purple outline), did not penetrate the explant but formed a ‘ring’ around the tumor explant-cancer cell area. b) Vascularization of Mu89 tumor explants (asterisk) in the co-culture system. Vessels (green) surround and penetrated the tumor explants (due to autofluorescence, also shown in green) over 10 days. Scale bar, 150 μm. c) BT474 tumor explants were also successfully vascularized over 10 days. Scale bar, 150 μm. d) Growth curves for VTEs. e) Mu89 explants retained strong levels of tenascin-C (grey) ex-vivo. Scale bar, 100 μm. f) Mu89 VETs released increased levels of VEGF in relation to EC-SMC cultures alone, while, s-FLT1 and PLGF were at similar levels in comparison to EC-SMC cultures alone.

References

    1. Neuzi P, Giselbrecht S, Lange K, Huang TJ, Manz A. Nature reviews Drug discovery. 2012;11:620–632. - PMC - PubMed
    1. van der Meer AD, van den Berg A. Integrative biology: quantitative biosciences from nano to macro. 2012;4:461–470. - PubMed
    1. Bersini S, Jeon JS, Dubini G, Arrigoni C, Chung S, Charest JL, Moretti M, Kamm RD. Biomaterials. 2014;35:2454–2461. - PMC - PubMed
    1. Elliott NT, Yuan F. Journal of pharmaceutical sciences. 2011;100:59–74. - PubMed
    1. Jeon JS, Bersini S, Gilardi M, Dubini G, Charest JL, Moretti M, Kamm RD. Proceedings of the National Academy of Sciences of the United States of America. 2015;112:214–219. - PMC - PubMed

Publication types

MeSH terms

LinkOut - more resources