. 2016 Oct 27;11(10):e0165136.
doi: 10.1371/journal.pone.0165136. eCollection 2016.

Estimation of Mixed Layer Depth in the Gulf of Aden: A New Approach

Affiliations

Estimation of Mixed Layer Depth in the Gulf of Aden: A New Approach

Abdulla C P et al. PLoS One. .

Erratum in

Abstract

The mixed layer depth (MLD) in Gulf of Aden is analyzed using vertical high resolution (1m) profiles of both temperature and density. Firstly, we examined threshold and gradient methods for estimating the MLD. Close evaluation with individual profiles reveals the failure of both methods for most of the profiles. Furthermore, the curvature method, a relatively recent approach to define ocean MLDs, is established for open water profiles but for marginal seas, like the Gulf of Aden, it detects shallower depths than the actual MLD. These considerable differences motivated us to introduce a new approach of MLD identification, which is developed based on curvature method and is called segment method. Our segment method produces adequate MLD estimates for more than 95% of the profiles and overcomes major limitations of conventional methods. It is less biased and least scattered compared to other methods with a correlation coefficient > 0.95. The mixed layer in Gulf of Aden displays significant seasonal variability and is deeper in winter. Throughout the year, the western part of gulf experiences deeper mixed layer than the eastern part. Regional eddies dominate Gulf of Aden's MLD pattern during all seasons.


Conflict of interest statement

The authors have declared that no competing interests exist.

Figures

Fig 1
Fig 1. Typical temperature profile to show the procedure of segment method.
sig30 (standard deviation for every lower 30 m water column), sig10 (standard deviation for every lower 10 m water column), gradient (with respect to lower 5 m interval) and curvature of temperature are plotted in green, sky-blue, red and blue colors respectively. Horizontal lines with upward and downward pointed triangle marks top and bottom ends of profile segment. Dashed lines represent MLD by curvature method (red), MLD by segment method (green) and first guess MLD (black). Important depths are marked as P1, P2 etc. and are explained in text.
Fig 2
Fig 2. Temperature based MLD profiles during winter (left panel) and summer (right panel) based on conventional methods.
Threshold, gradient and curvature based maps are shown in top (a & b), middle (c & d) and bottom (e & f) panels respectively. Scale for left and right panels are kept separate for better understanding of differences.
Fig 3
Fig 3. Profiles marked with MLD based on different methods for four sample stations I, II, III and IV.
I, III are winter profiles and II, IV are summer profiles. Threshold (Gradient) MLDs are marked on green (orange) vertical line. Curvature (segment) method based MLD is marked by horizontal line with a dot in blue (red) color. Letters “Th” and “Gr” are used in labels to represent threshold and gradient methods. Numbers in the tail of label indicate used threshold (0.1, 0.2, 0.3, 0.4, 0.5, 0.6, 0.7, 0.8, 0.9, and 1.0 respectively) and gradient (0.005, 0.01, 0.015, 0.02, 0.025, 0.03, 0.035, 0.04, 0.045, and 0.05 respectively).
Fig 4
Fig 4. Difference between conventional and segment methods based MLD estimates for profiles during winter (left panel) and summer (right panel).
Threshold, gradient and curvature maps are shown in top (a & b), middle (c & d) and bottom (e & f) panels respectively. Scale for left and right panels are kept separate for better understanding of differences.
Fig 5
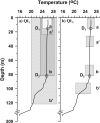
Fig 5
Schematic diagram to explain quality index using (a) QIL and (b) QIN. D1 and D2 are two arbitrary depths to check performance of QI. Shaded boxes are labeled as a & a’ and b & b’, representing the portion of profile used to calculate standard deviation at D1 and D2 respectively.
Fig 6
Fig 6. Statistical parameters calculated for threshold, gradient, curvature and segment methods with respect to VMLD.
Two boxes are drawn in both figures to represent different threshold (left box) and gradient (right box) criterions. R (correlation coefficient) and SI (Scatter index) are plotted in top panel. Bias is plotted in bottom panel. “Th” in the label represents threshold method and the number given at tail of each label denotes the respective criterion (similarly “Gr” for gradient method). “Curv” and “Segm” represent curvature and segment methods respectively.
Fig 7
Fig 7
Map of MLD identified using temperature based on segment method for available CTD profiles during winter (a) and summer (b).
Fig 8
Fig 8. MLD along the central axis of gulf extending from west to east.
Thick solid line (thick dashed line) represent MLD during winter (summer). Solid and dashed thinner lines represent linear fit to winter and summer MLD respectively.
Fig 9
Fig 9
SLA (in meters) from AVISO for a) 25-Feb to 04-Mar and b) 05-Aug to 12-Aug in 2001.

References

    1. Cury P, Roy C. Optimal Environmental Window and Pelagic Fish Recruitment Success in Upwelling Areas. Can J Fish Aquat Sci. NRC Research Press Ottawa, Canada; 1989;46: 670–680. 10.1139/f89-086 - DOI
    1. Robinson CLK, Ware DM, Parsons TR. Simulated annual plankton production in the northeastern Pacific Coastal Upwelling Domain. J Plankton Res. 1993;15: 161–183. 10.1093/plankt/15.2.161 - DOI
    1. Wijesekera HW, Gregg MC. Surface layer response to weak winds, westerly bursts, and rain squalls in the western Pacific Warm Pool. J Geophys Res. 1996;101: 977–997.
    1. Kara AB, Rochford PA, Hurlburt HE. An optimal definition for ocean mixed layer depth. J Geophys Res. 2000;105: 16803 10.1029/2000JC900072 - DOI
    1. Kara AB, Rochford PA, Hurlburt HE. Mixed layer depth variability over the global ocean. J Geophys Res. 2003;108: 1–15. 10.1029/2000JC000736 - DOI

LinkOut - more resources