. 2016 Oct 27;11(10):e0165369.
doi: 10.1371/journal.pone.0165369. eCollection 2016.

Image-Based Modeling of Blood Flow and Oxygen Transfer in Feto-Placental Capillaries

Affiliations

Image-Based Modeling of Blood Flow and Oxygen Transfer in Feto-Placental Capillaries

Philip Pearce et al. PLoS One. .

Abstract

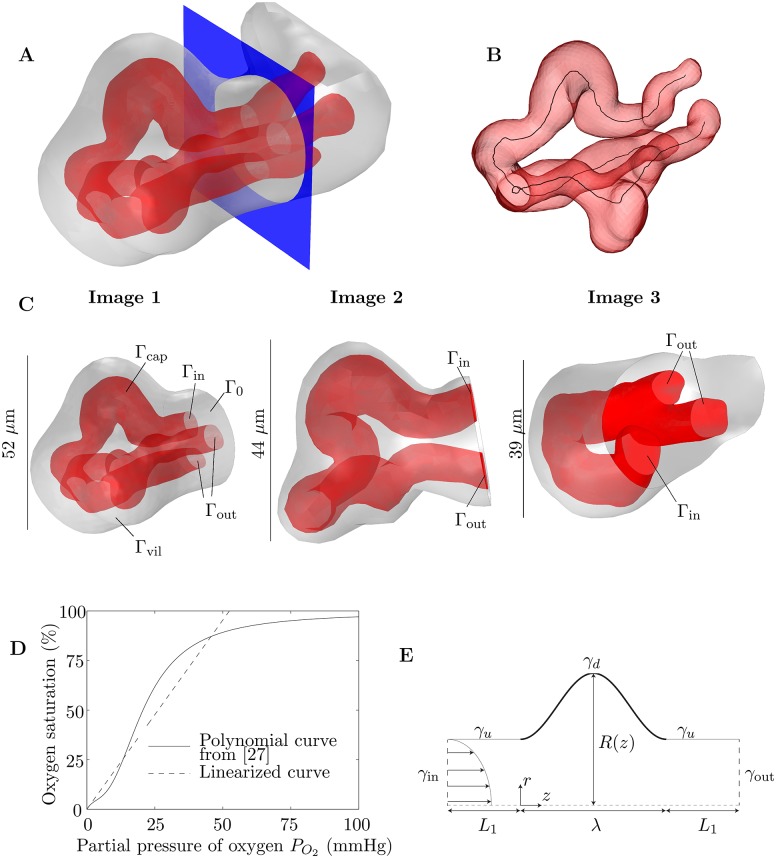
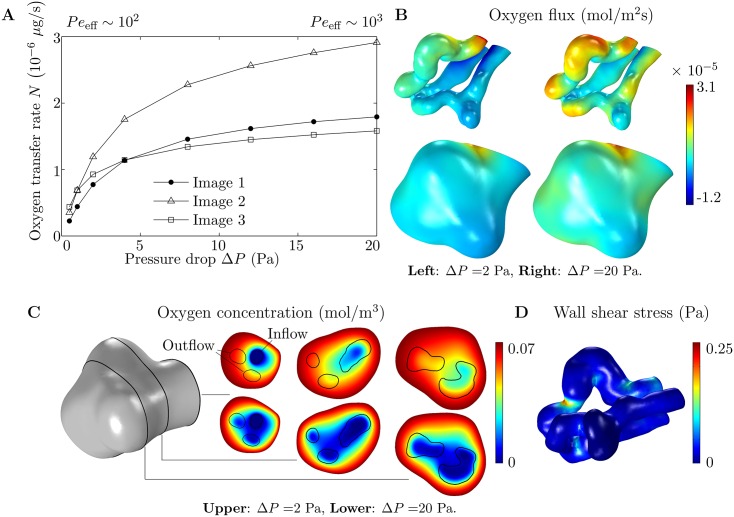
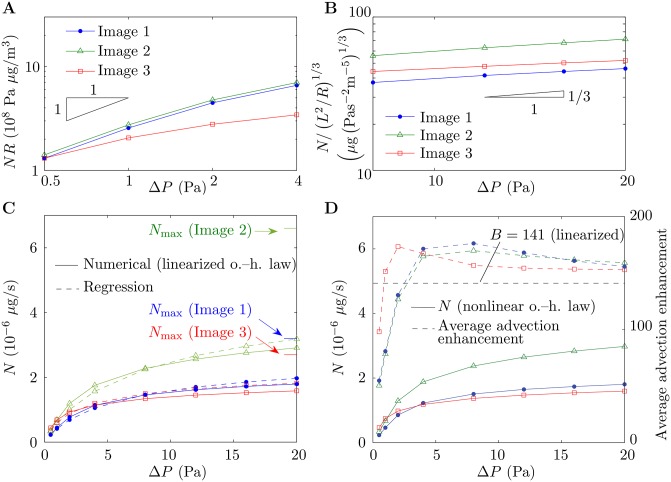
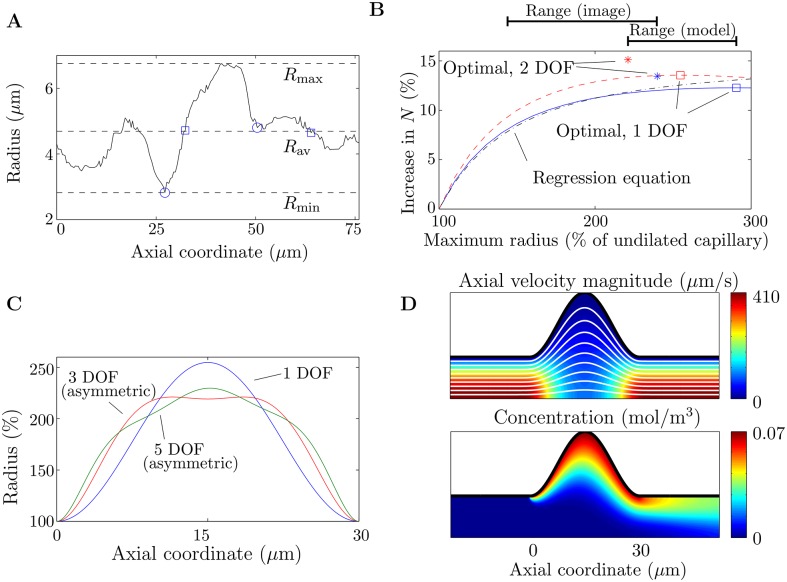
During pregnancy, oxygen diffuses from maternal to fetal blood through villous trees in the placenta. In this paper, we simulate blood flow and oxygen transfer in feto-placental capillaries by converting three-dimensional representations of villous and capillary surfaces, reconstructed from confocal laser scanning microscopy, to finite-element meshes, and calculating values of vascular flow resistance and total oxygen transfer. The relationship between the total oxygen transfer rate and the pressure drop through the capillary is shown to be captured across a wide range of pressure drops by physical scaling laws and an upper bound on the oxygen transfer rate. A regression equation is introduced that can be used to estimate the oxygen transfer in a capillary using the vascular resistance. Two techniques for quantifying the effects of statistical variability, experimental uncertainty and pathological placental structure on the calculated properties are then introduced. First, scaling arguments are used to quantify the sensitivity of the model to uncertainties in the geometry and the parameters. Second, the effects of localized dilations in fetal capillaries are investigated using an idealized axisymmetric model, to quantify the possible effect of pathological placental structure on oxygen transfer. The model predicts how, for a fixed pressure drop through a capillary, oxygen transfer is maximized by an optimal width of the dilation. The results could explain the prevalence of fetal hypoxia in cases of delayed villous maturation, a pathology characterized by a lack of the vasculo-syncytial membranes often seen in conjunction with localized capillary dilations.


Conflict of interest statement

The authors have declared that no competing interests exist.

Figures

Fig 1
Fig 1. Methods.
(A) An example of how 3D images are partitioned with a plane (shown in blue) to provide a surface for boundary conditions to be applied. The red surface represents the capillary surface (endothelium, Γcap) and the grey surface represents the villous surface Γvil. In this example the capillary bifurcates within the villous branch. (B) Example of the skeletonization of a capillary from a 3D image. The skeletonization line, representing the centreline of the lumen, is shown in black. (C) The 3D images of fetal capillaries and villous surfaces used in the simulations (see S1 Images). The images shown have been partitioned by a plane on which boundary conditions are applied, for inflow (Γin), outflow (Γout) and villous tissue (Γ0). (D) Polynomial fetal oxygen–hemoglobin dissociation law from [27] (solid line) and the linear approximation between 0 and 60 mmHg, passing through the origin, found using a least-squares fit (dashed line). The gradient of the linear approximation is K = 0.019 mmHg−1. (E) Schematic diagram of the idealized axisymmetric model of a fetal capillary dilation, showing an axisymmetric tube with a localized dilation. Blood flows into the capillary through γin and leaves through γout. Oxygen is provided along the dilated section of the capillary γd, denoted by the thicker black line. The undilated sections of the capillary are labeled γu.
Fig 2
Fig 2. Results of numerical simulations on 3D geometries.
(A) Oxygen flux entering each capillary versus pressure drop ΔP. The range of values of ΔP is broadly physiological, leading to flow velocities of around 300 μm/s (Table 3), which is the approximate flow velocity in normal capillaries [36]. Peeff is in the range 102–103 as indicated. (B) Distribution of oxygen flux entering through the capillary (top) and villous (bottom) surfaces, from simulations on Image 1. Results are shown for ΔP = 2 Pa (left) and ΔP = 20 Pa (right). (C) Plots of the oxygen concentration field on three planes, 15 μm apart, from simulations on Image 1. The planes are shown on the villous surface on the left. Results are given for ΔP = 2 Pa (top) and ΔP = 20 Pa (bottom). Capillary walls are denoted by black lines. The inflow and outflow capillaries are labeled on the plane at the villous entrance (left). (D) Wall shear stress at the capillary surface, from a simulation on Image 1 (ΔP = 2 Pa).
Fig 3
Fig 3. Scaling and regression.
Throughout the figure, results for Image 1, Image 2 and Image 3 are denoted by blue dots, green triangles and red squares, respectively. (A,B) Scaled oxygen transfer rate (A) NR and (B) N/(L2/R)1/3 versus pressure drop ΔP, on log-log axes. Solid lines denote numerical results and black triangles denote the gradients predicted by (A) scaling Eq (13) and (B) scaling Eq (12). (C) Oxygen transfer rate N versus ΔP with the linearized oxygen–hemoglobin dissociation law. Solid lines denote numerical results and dashed lines denote results generated by the regression Eq (19). The upper bounds Nmax on N are indicated, which have been calculated by solving the diffusion equation in the surrounding villous volume with the capillary assumed to be deoxygenated. (D) Oxygen transfer rate N with the nonlinear oxygen–hemoglobin dissociation law (solid lines) and average advection enhancement 1+(cmaxkhn/ρbl)S(PO2) in each capillary (dashed lines) versus ΔP. Also shown on the figure is the oxygen advection enhancement parameter B (black dashed line), derived by linearizing the oxygen–hemoglobin dissociation law.
Fig 4
Fig 4. Results from the idealized axisymmetric model of a fetal capillary dilation.
(A) Radius of the capillary (of length L = 76 μm) in Image 1 before it branches, showing the dilation and the different ways used to define its length λ. Local minima are denoted with circles (this is subjective due to noise in the data). Points where the radius of the dilation equals the average radius are denoted with squares. The dashed lines show the minimum radius Rmin = 2.8 μm, the average radius Rav = 4.7 μm and the maximum radius Rmax = 6.8 μm. (B) Increase in oxygen transfer rate for a capillary dilation compared to a straight capillary. Included in the figure are results for shapes with 1 degree of freedom (DOF), with the undilated radius being Rmin (λ = 23 μm, Peeff = 285; blue solid line) and Rav (λ = 31 μm, Peeff = 475; red dashed line). Indicated on the figure are the maximum radius and the increase in the oxygen transfer rate N for the optimal shapes in each case with 1 DOF (squares) and 2 DOF (stars). The black dash-dotted line shows the predictions of the regression Eq (15), for a capillary dilation with 1 DOF, with the undilated radius defined as Rav. (C) Optimal shapes for successively increasing DOF. Where the shapes are asymmetric about the axial midpoint of the dilation, this is labeled on the figure. The shapes correspond to the case where the undilated radius of the capillary is defined as Rav, and are plotted as a percentage of the undilated radius. (D) Top: Axial velocity magnitude, with streamlines in white. Bottom: Concentration. Results are shown for the optimal dilation with 1 DOF, in the case where the undilated radius is taken to be Rav. It has been assumed that the centreline flow velocity in a straight capillary is equal to 300 μm/s.

References

    1. Schneider H. Ontogenic changes in the nutritive function of the placenta. Placenta. 1996;17(1):15–26. 10.1016/S0143-4004(05)80639-3 - DOI - PubMed
    1. Mayhew TM. Stereology and the placenta: where’s the point?–a review. Placenta. 2006;27:17–25. 10.1016/j.placenta.2005.11.006 - DOI - PubMed
    1. Jirkovská M, Kubínová L, Janáček J, Moravcová M, Krejčí V, Karen P. Topological properties and spatial organization of villous capillaries in normal and diabetic placentas. J Vasc Res. 2002;39(3):268–278. - PubMed
    1. Jirkovská M, Janáček J, Kaláb J, Kubínová L. Three-dimensional arrangement of the capillary bed and its relationship to microrheology in the terminal villi of normal term placenta. Placenta. 2008;29(10):892–897. 10.1016/j.placenta.2008.07.004 - DOI - PubMed
    1. Benirschke K, Kaufmann P, Baergen RN. The Pathology of the Human Placenta. 5th ed New York, NY: Springer; 2006. 10.1007/b137920 - DOI

LinkOut - more resources