

Utility of a Multiparametric Quantitative MRI Model That Assesses Myelin and Edema for Evaluating Plaques, Periplaque White Matter, and Normal-Appearing White Matter in Patients with Multiple Sclerosis: A Feasibility Study
- PMID: 27789453
- PMCID: PMC7963826
- DOI: 10.3174/ajnr.A4977
Utility of a Multiparametric Quantitative MRI Model That Assesses Myelin and Edema for Evaluating Plaques, Periplaque White Matter, and Normal-Appearing White Matter in Patients with Multiple Sclerosis: A Feasibility Study
Abstract
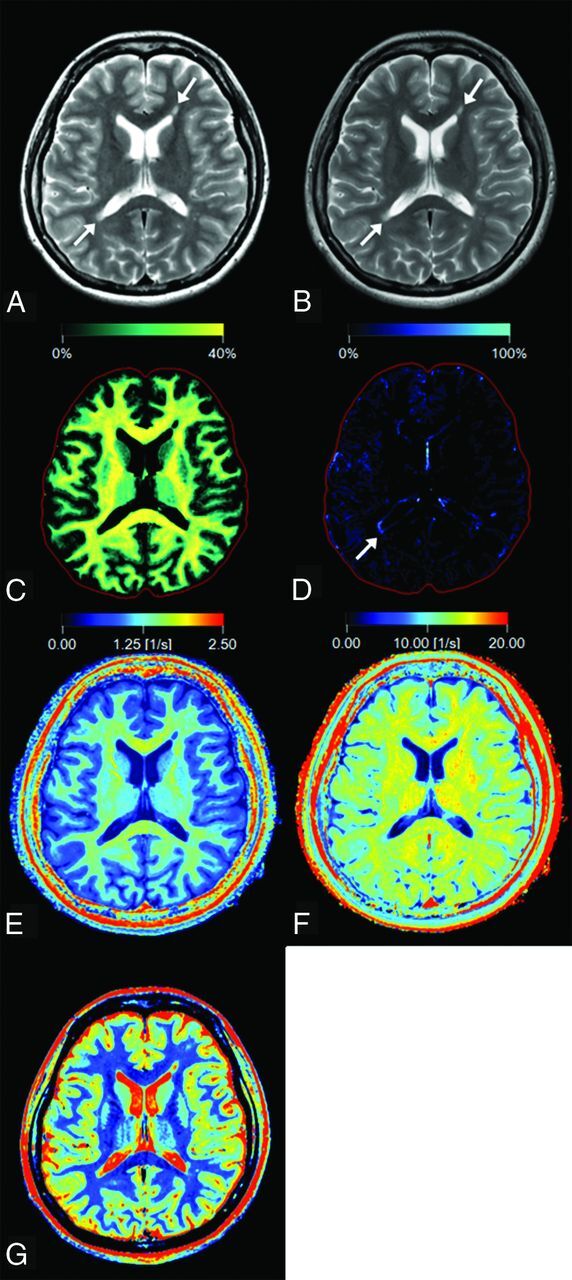
Background and purpose: T1 and T2 values and proton density can now be quantified on the basis of a single MR acquisition. The myelin and edema in a voxel can also be estimated from these values. The purpose of this study was to evaluate a multiparametric quantitative MR imaging model that assesses myelin and edema for characterizing plaques, periplaque white matter, and normal-appearing white matter in patients with MS.
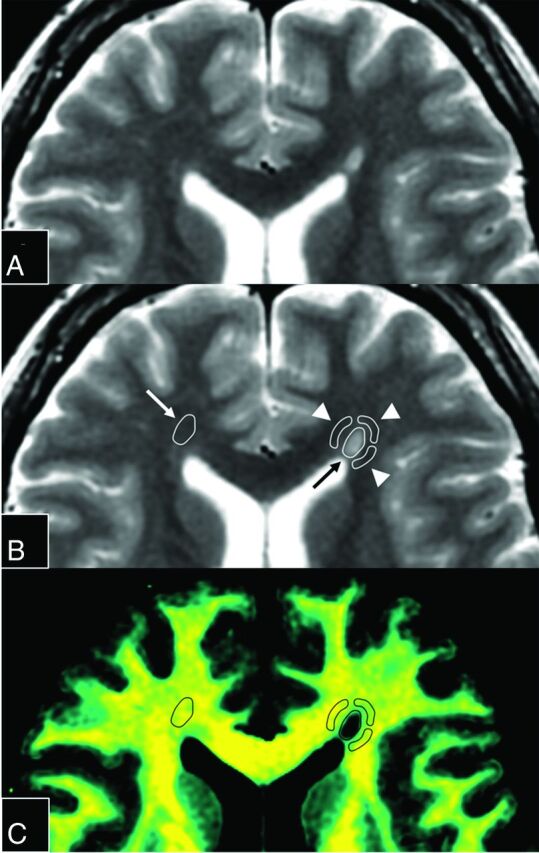
Materials and methods: We examined 3T quantitative MR imaging data from 21 patients with MS. The myelin partial volume, excess parenchymal water partial volume, the inverse of T1 and transverse T2 relaxation times (R1, R2), and proton density were compared among plaques, periplaque white matter, and normal-appearing white matter.
Results: All metrics differed significantly across the 3 groups (P < .001). Those in plaques differed most from those in normal-appearing white matter. The percentage changes of the metrics in plaques and periplaque white matter relative to normal-appearing white matter were significantly more different from zero for myelin partial volume (mean, -61.59 ± 20.28% [plaque relative to normal-appearing white matter], and mean, -10.51 ± 11.41% [periplaque white matter relative to normal-appearing white matter]), and excess parenchymal water partial volume (13.82 × 10³ ± 49.47 × 10³% and 51.33 × 10² ± 155.31 × 10²%) than for R1 (-35.23 ± 13.93% and -6.08 ± 8.66%), R2 (-21.06 ± 11.39% and -4.79 ± 6.79%), and proton density (23.37 ± 10.30% and 3.37 ± 4.24%).
Conclusions: Multiparametric quantitative MR imaging captures white matter damage in MS. Myelin partial volume and excess parenchymal water partial volume are more sensitive to the MS disease process than R1, R2, and proton density.
© 2017 by American Journal of Neuroradiology.
Figures
References
MeSH terms
LinkOut - more resources
Full Text Sources
Other Literature Sources
Medical