. 2016 Dec 9;291(50):26083-26097.
doi: 10.1074/jbc.M116.757138. Epub 2016 Oct 27.

β-Arrestin1 and Signal-transducing Adaptor Molecule 1 (STAM1) Cooperate to Promote Focal Adhesion Kinase Autophosphorylation and Chemotaxis via the Chemokine Receptor CXCR4

Affiliations

β-Arrestin1 and Signal-transducing Adaptor Molecule 1 (STAM1) Cooperate to Promote Focal Adhesion Kinase Autophosphorylation and Chemotaxis via the Chemokine Receptor CXCR4

Olga Alekhina et al. J Biol Chem. .

Abstract

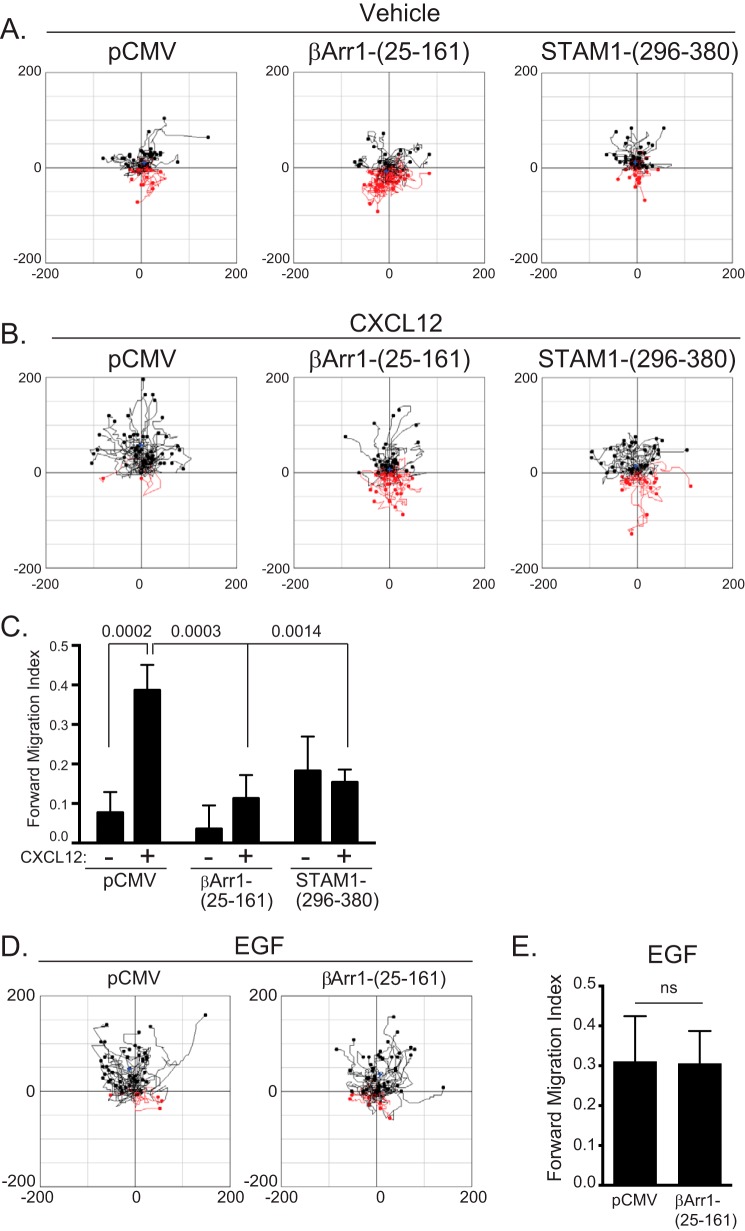
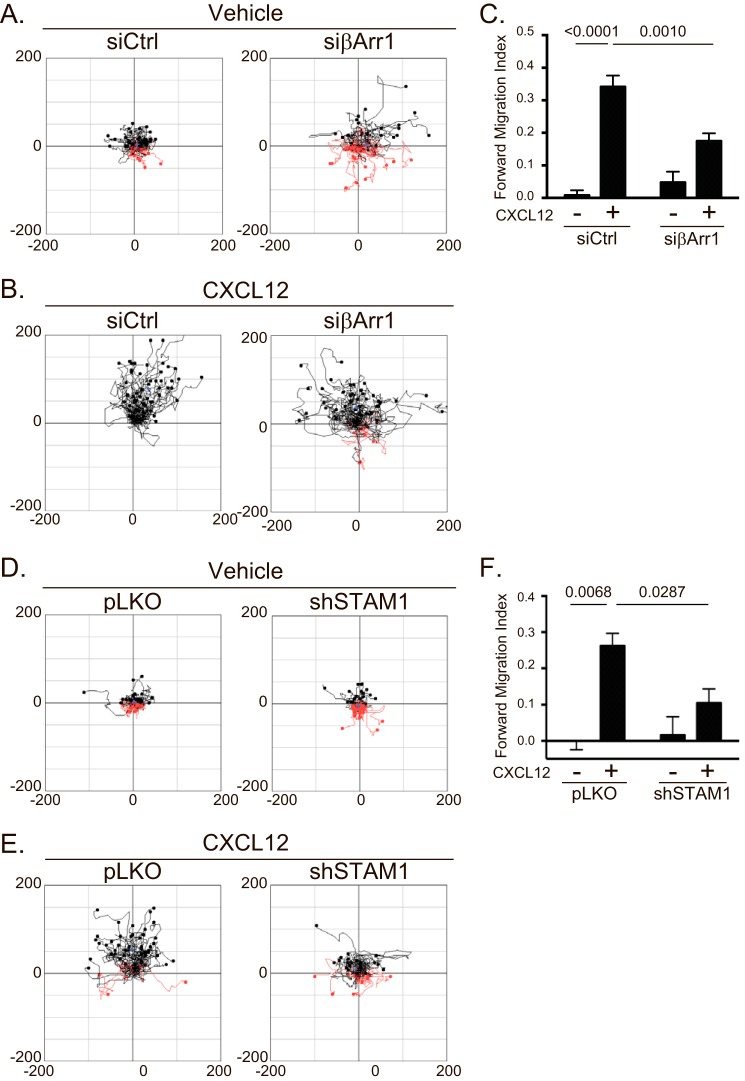
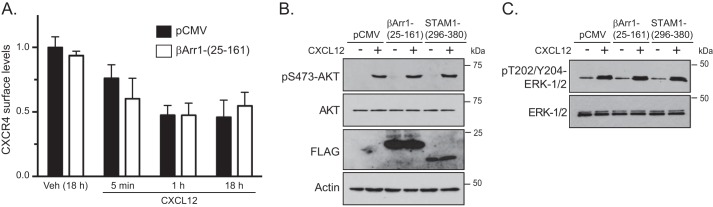
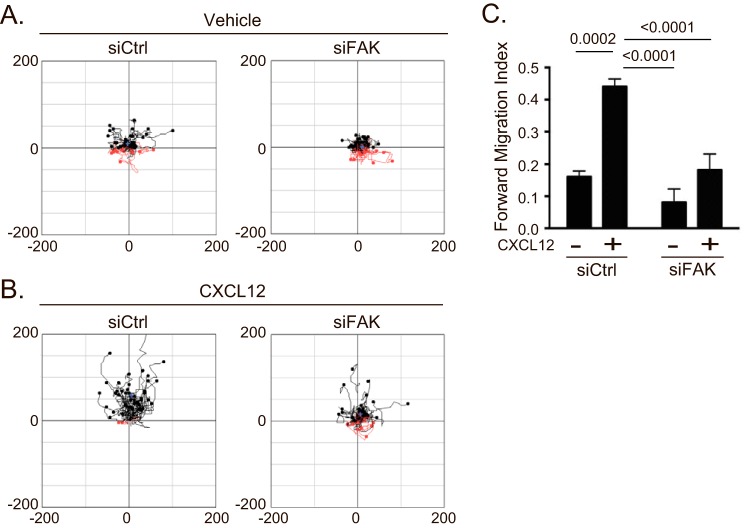
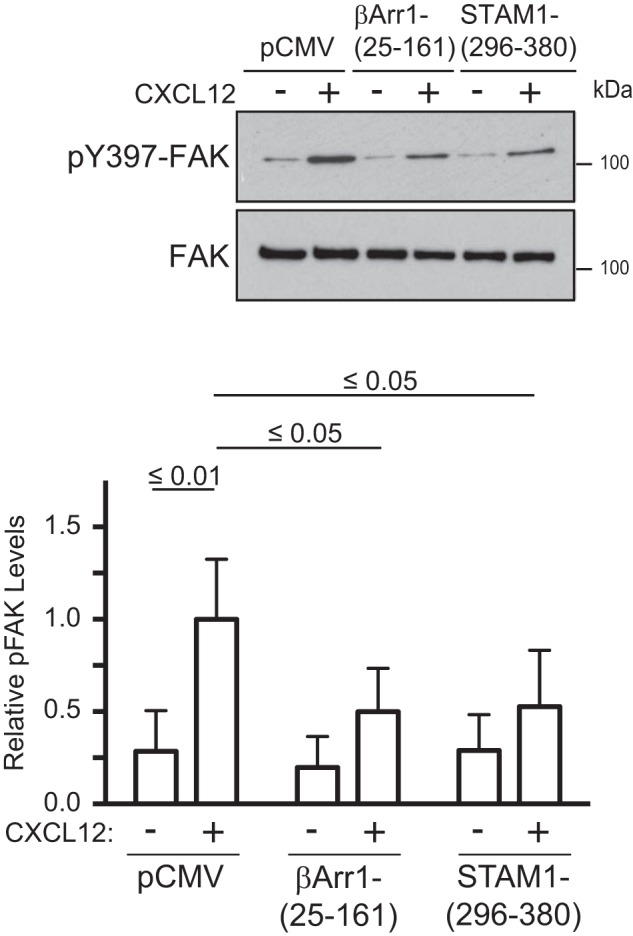
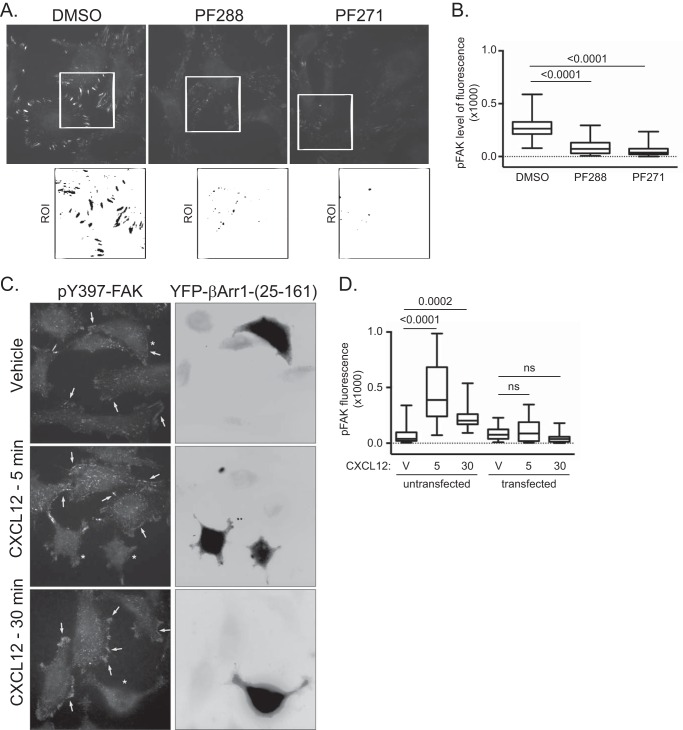
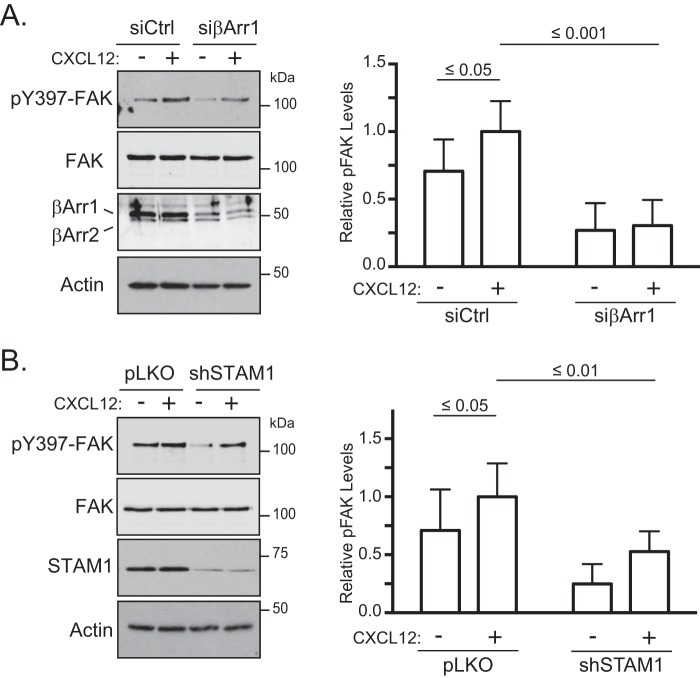
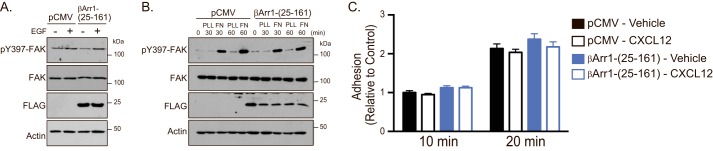
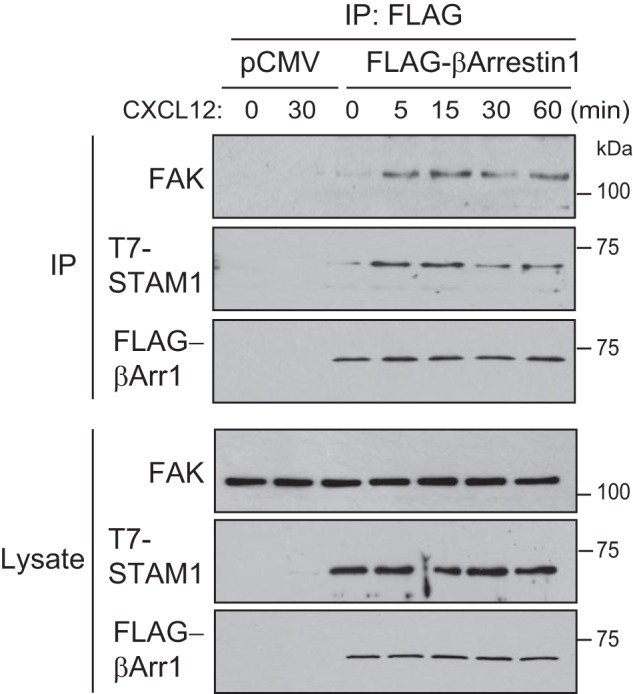
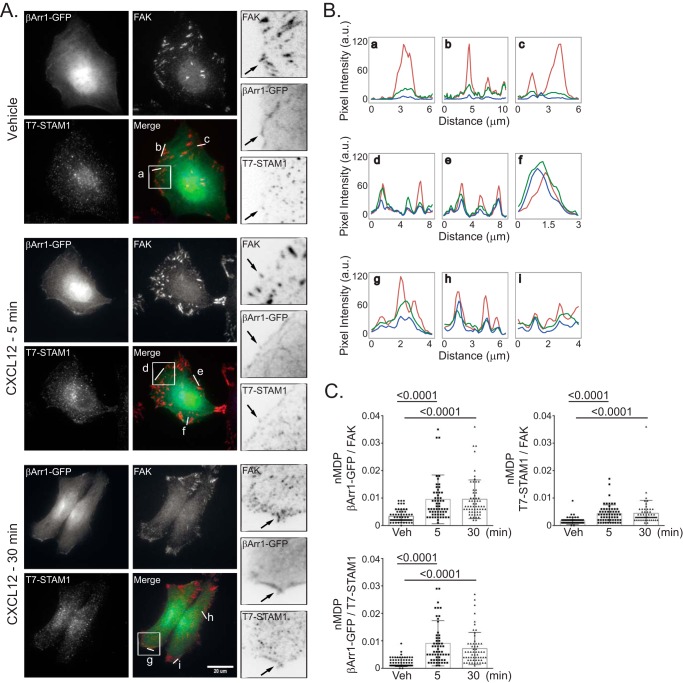
The chemokine receptor CXCR4 and its chemokine ligand CXCL12 mediate directed cell migration during organogenesis, immune responses, and metastatic disease. However, the mechanisms governing CXCL12/CXCR4-dependent chemotaxis remain poorly understood. Here, we show that the β-arrestin1·signal-transducing adaptor molecule 1 (STAM1) complex, initially identified to govern lysosomal trafficking of CXCR4, also mediates CXCR4-dependent chemotaxis. Expression of minigene fragments from β-arrestin1 or STAM1, known to disrupt the β-arrestin1·STAM1 complex, and RNAi against β-arrestin1 or STAM1, attenuates CXCL12-induced chemotaxis. The β-arrestin1·STAM1 complex is necessary for promoting autophosphorylation of focal adhesion kinase (FAK). FAK is necessary for CXCL12-induced chemotaxis and associates with and localizes with β-arrestin1 and STAM1 in a CXCL12-dependent manner. Our data reveal previously unknown roles in CXCR4-dependent chemotaxis for β-arrestin1 and STAM1, which we propose act in concert to regulate FAK signaling. The β-arrestin1·STAM1 complex is a promising target for blocking CXCR4-promoted FAK autophosphorylation and chemotaxis.

Keywords: C-X-C chemokine receptor type 4 (CXCR-4); CXCL12; G protein-coupled receptor (GPCR); PTK2 protein tyrosine kinase 2 (PTK2) (focal adhesion kinase) (FAK); STAM; chemokine; chemotaxis; β-arrestin.


Figures

FIGURE 1.
FIGURE 1.
Disruption of the β-arrestin1·STAM1 complex attenuates CXCR4-dependent chemotaxis. HeLa cells transiently transfected with empty vector (pCMV), FLAG-β-arrestin1(25–161), or FLAG-STAM1(296–380) were passaged onto μ-Slide chemotaxis chambers and analyzed by time lapse microscopy for 18 h in the absence (vehicle) or presence of a gradient of CXCL12 (50 nm at its source). A and B, aggregated trajectories of individual cells in the presence of vehicle (A) or CXCL12 (B) from a representative experiment. Trajectories in black and red represent cells that migrated toward or away from the chemoattractant gradient, respectively. C, the graph represents the mean forward migration index in the absence or presence of CXCL12 from tracking 150 cells from three (vehicle) or 200 cells from four (CXCL12) independent experiments. Data were analyzed by two-way ANOVA followed by Tukey's multiple comparison test. p values are provided. D, aggregated trajectories of individual cells in the presence of EGF (200 ng/ml at its source) from a representative experiment. E, the forward migration index is shown from tracking 100 cells from two independent experiments. The error bars represent the S.D. Data were analyzed by Student's t test and are not significant (ns).
FIGURE 2.
FIGURE 2.
Depletion of β-arrestin1 or STAM1 attenuates CXCR4-dependent chemotaxis. HeLa cells transiently transfected with siRNA against β-arrestin1 or shRNA against STAM1 were passaged onto μ-Slide chemotaxis chambers and analyzed by time lapse microscopy for 18 h in the absence (vehicle) or presence of a gradient of CXCL12 (50 nm at its source). A, B, D, and E, aggregated trajectories of individual cells transfected with either βArr1 siRNA (A and B) or STAM1 shRNA (D and E) in the presence of vehicle (A and D) or CXCL12 gradient (B and E). C and F, the forward migration index was calculated from 100 control siRNA (siCtrl) (two experiments)-, 200 βArr1 siRNA (four experiments)-, 150 pLKO (three experiments)-, or 150 STAM shRNA (three experiments)-transfected cells. The error bars represent the S.D. Data were analyzed by two-way ANOVA followed by Tukey's multiple comparison test. p values are provided.
FIGURE 3.
FIGURE 3.
Disruption of the β-arrestin1·STAM1 complex does not alter CXCR4 cell surface expression or CXCR4-promoted Akt or ERK-1/2 activation. A, surface expression of CXCR4 was analyzed by flow cytometry in cells transfected with empty vector (pCMV-10) or FLAG-βArr1(25–161). Cells were serum-starved for 1 h and then treated with vehicle (18 h) or 30 nm CXCL12 for 18 h, 1 h, or 5 min. Cells were fixed and stained with a phycoerythrin-conjugated antibody against CXCR4 or IgG2a (isotype control) and analyzed by flow cytometry. Bars represent the mean of the florescence intensity relative to vehicle-treated cells transfected with empty vector. The error bars represent the S.D. from two independent experiments. B and C, HeLa cells transiently transfected with FLAG-βArr1(25–161), FLAG-STAM1(296–380), or empty vector (pCMV-10) were serum-starved for 3 h and treated with 10 nm CXCL12 or vehicle (PBS with 0.1% BSA) for 5 min. Whole cell lysates were analyzed by immunoblotting for the indicated proteins. Representative immunoblots from three independent experiments are shown.
FIGURE 4.
FIGURE 4.
Depletion of FAK attenuates CXCR4-dependent chemotaxis. A and B, chemotaxis of HeLa cells transfected with control siRNA (siCtrl) or siRNA against FAK was analyzed as in Fig. 3. Aggregated trajectories of individual cells transfected with either control or FAK siRNA in the presence of vehicle (A) or CXCL12 gradient (B) are shown. C, the forward migration index was calculated from 200 vehicle (two experiments)- or CXCL12 (three experiments)-treated cells that were transfected with control siRNA and 300 vehicle (three experiments)- or 400 CXCL12 (four experiments)-treated cells that were transfected with FAK siRNA. The error bars represent the S.D. Data were analyzed by two-way ANOVA followed by Tukey's multiple comparison test. p values are provided.
FIGURE 5.
FIGURE 5.
Disruption of the β-arrestin1·STAM1 complex attenuates CXCR4-promoted autophosphorylation of FAK. A, HeLa cells transfected with the indicated DNA constructs were treated with CXCL12 for 5 min, and cell lysates were analyzed by immunoblotting for FAK or Tyr(P)-397-FAK. Representative immunoblots from four independent experiments are shown. Bottom, the graph represents the densitometric analyses showing the relative levels of Tyr(P)-397-FAK (pFAK) compared with the control pCMV-transfected cells treated with CXCL12 of four independent experiments. The error bars represent the S.D. Data were analyzed by two-way ANOVA and Newman-Keuls multiple comparison test. p values between the indicated groups are shown.
FIGURE 6.
FIGURE 6.
Validation of the Tyr(P)-397-FAK antibody for fluorescence microscopy. A, immunostaining of HeLa cells with an anti-Tyr(P)-397-FAK (BD Biosciences) antibody. HeLa cells grown on PLL-coated coverslips in serum-containing medium were treated with vehicle (DMSO) and FAK inhibitors PF573228 (PF288) (1 μm) and PF562271 (PF271) (1 μm) for 3 h. Shown are representative images. The white box indicates ROI, shown enlarged in the inset below, and is inverted. B, box plot of Tyr(P)-397-FAK intensity. The fluorescence intensity of Tyr(P)-397-FAK was determined from cells in 10 fields of view, and three to five regions of interests per field of view were analyzed. The fluorescence intensity per area of region of interest was calculated, and values are represented in a box plot. The upper limit of the box represents the 75th percentile, and the lower limit represents the 25th percentile. The horizontal line within the box represents the median. The whiskers represent the maxima and minima values. Values that exceeded two standard deviations from the mean were excluded from the analysis. p values from one-way ANOVA followed by post hoc Tukey's test are provided. C, representative images of anti-Tyr(P)-397-FAK immunostaining of HeLa cells transiently transfected with YFP-β-arrestin1(25–161) and treated with CXCL12 for 5 or 30 min and vehicle for 30 min. The arrows point to high Tyr(P)-397-FAK levels in cells stimulated with CXCL12 for 5 or 30 min. In vehicle-treated cells, arrows point to edges of cells. The asterisks mark cells that are transfected with YFP-β-arrestin1(25–161). Shown are the inverted images of YFP-β-arrestin1(25–161). D, the fluorescence intensity of Tyr(P)-397-FAK in YFP-β-arrestin1(25–161)-transfected and untransfected cells was determined from cells in 20–30 fields of view and 37 regions of interest per condition from two independent experiments. The fluorescence intensity per surface area of region of interest was calculated, and values are represented in a box plot. The upper limit of the box represents the 75th percentile, and the lower limit represents the 25th percentile. The horizontal line within the box represents the median. The whiskers represent the maxima and minima values. Values that exceeded two standard deviations from the mean were excluded from the analysis. Adjusted p values from one-way ANOVA followed by post hoc Tukey's test are provided. V, vehicle. 5 and 30 represent the time in minutes cells were treated with 10 nm CXCL12. ns, not significant.
FIGURE 7.
FIGURE 7.
RNA interference against β-arrestin1 or STAM1 attenuates CXCR4-promoted autophosphorylation of FAK. HeLa cells transfected with β-arrestin1 siRNA (A) or STAM1 shRNA (B) were treated with 10 nm CXCL12 for 5 min and analyzed as in Fig. 5A. Representative immunoblots from five (A) or seven (B) independent experiments are shown. Graphs represent the densitometric analyses showing the relative levels of Tyr(P)-397-FAK (pFAK) compared with the control (siCtrl in A or pLKO in B)-transfected cells treated with CXCL12. The error bars represent the S.D. Data were analyzed by two-way ANOVA and Newman-Keuls multiple comparison test. p values between the indicated groups are shown.
FIGURE 8.
FIGURE 8.
βArr1(25–161) selectively regulates CXCR4-promoted signaling. A, HeLa cells transfected with empty vector (pCMV) or FLAG-βArr1(25–161) were treated with EGF (100 ng/ml), and cell lysates were analyzed as in Fig. 5A. Immunoblots from three independent experiments are shown. B, HeLa cells were transfected with the indicated DNA constructs, serum-starved for 3 h, detached, and seeded onto 6-well dishes that were uncoated (UN) or coated with FN (10 μg/ml) or PLL (100 μg/ml) for 30 or 60 min. Equal amounts of lysates were analyzed by immunoblotting for the indicated proteins. Representative immunoblots from three independent experiments are shown. C, HeLa cells transfected with the indicated DNA constructs treated with vehicle or 10 nm CXCL12 for 5 min were plated onto fibronectin (10 μg/ml)-coated 96-well plates for 10 or 20 min. Cells were washed, and the number of attached cells was determined by crystal violet staining and spectrophotometrical analysis at 595 nm. Bars represent the average absorbance compared with control (pCMV-transfected cells treated with vehicle). The error bars represent the S.D. from three independent experiments.
FIGURE 9.
FIGURE 9.
FAK exists in a CXCR4-promoted complex with β-arrestin1 and STAM1. HeLa cells transfected with β-arrestin1-FLAG and T7-STAM1 were treated with 10 nm CXCL12 for 5, 15, 30, or 60 min and vehicle for 60 min. For controls, HeLa cells transfected with pCMV (empty vector) were treated with vehicle or 10 nm CXCL12 for 30 min. Cleared lysates were immunoprecipitated (IP) with an anti-FLAG antibody. Immunoprecipitates and lysates were analyzed by immunoblotting for the indicated proteins. Representative immunoblots from three independent experiments are shown.
FIGURE 10.
FIGURE 10.
Localization of FAK, β-arrestin1-GFP, and T7-STAM1 by fluorescence microscopy. A, HeLa cells transfected with β-arrestin1-GFP and T7-STAM1 seeded onto coverslips were treated with 10 nm CXCL12 for 5 or 30 min or for 30 min with vehicle. Images were acquired for β-arrestin1-GFP (green), FAK (red), and T7-STAM1 (blue) using identical acquisition settings for parallel samples in each channel. B, the fluorescence intensity profiles of the indicated lines (a–i) within the merged images are shown. C, colocalization analysis among the indicated proteins is shown as nMDP values for 60 ROIs (three independent experiments, five cells per experiment, four ROIs per cell). The error bars represent the S.D. Data were analyzed using one-way ANOVA followed by Tukey's multiple comparison test. p values are provided. Distance per pixel was calibrated to equal 0.156 μm. Scale bar, 20 μm. a.u., arbitrary units.

Similar articles

Cited by

References

    1. Ridley A. J. (2011) Life at the leading edge. Cell 145, 1012–1022 - PubMed
    1. Peled A., Petit I., Kollet O., Magid M., Ponomaryov T., Byk T., Nagler A., Ben-Hur H., Many A., Shultz L., Lider O., Alon R., Zipori D., and Lapidot T. (1999) Dependence of human stem cell engraftment and repopulation of NOD/SCID mice on CXCR4. Science 283, 845–848 - PubMed
    1. Tachibana K., Hirota S., Iizasa H., Yoshida H., Kawabata K., Kataoka Y., Kitamura Y., Matsushima K., Yoshida N., Nishikawa S., Kishimoto T., and Nagasawa T. (1998) The chemokine receptor CXCR4 is essential for vascularization of the gastrointestinal tract. Nature 393, 591–594 - PubMed
    1. Nagasawa T., Hirota S., Tachibana K., Takakura N., Nishikawa S., Kitamura Y., Yoshida N., Kikutani H., and Kishimoto T. (1996) Defects of B-cell lymphopoiesis and bone-marrow myelopoiesis in mice lacking the CXC chemokine PBSF/SDF-1. Nature 382, 635–638 - PubMed
    1. Zou Y. R., Kottmann A. H., Kuroda M., Taniuchi I., and Littman D. R. (1998) Function of the chemokine receptor CXCR4 in haematopoiesis and in cerebellar development. Nature 393, 595–599 - PubMed

MeSH terms

LinkOut - more resources