

The Cytoplasmic Region of Inner Helix S6 Is an Important Determinant of Cardiac Ryanodine Receptor Channel Gating
- PMID: 27789712
- PMCID: PMC5207073
- DOI: 10.1074/jbc.M116.758821
The Cytoplasmic Region of Inner Helix S6 Is an Important Determinant of Cardiac Ryanodine Receptor Channel Gating
Abstract
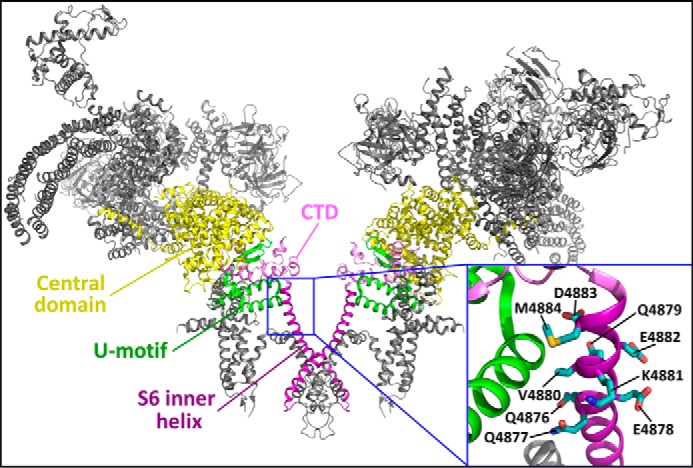
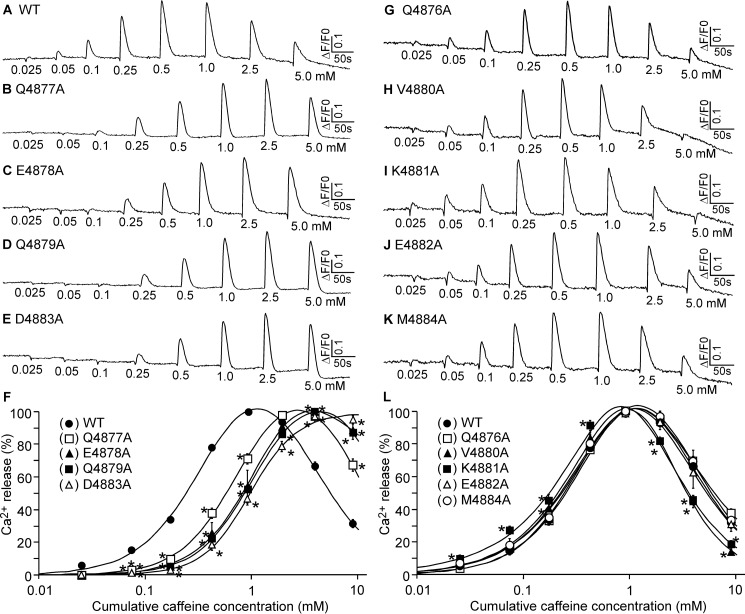
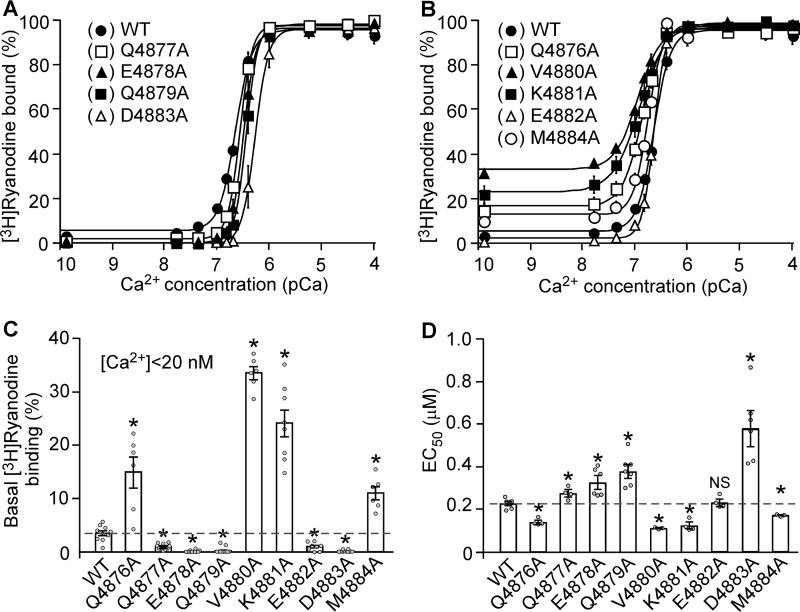
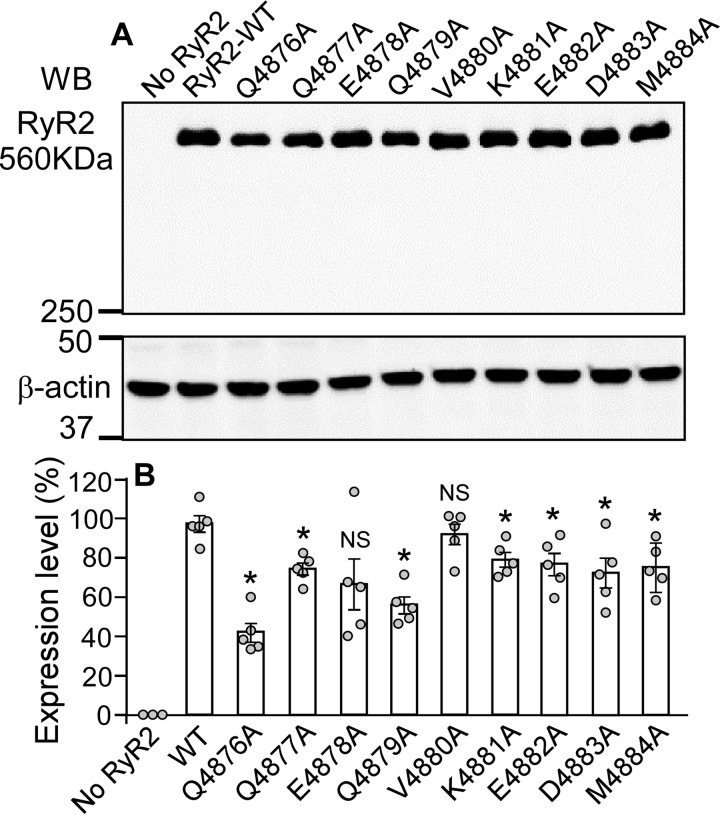
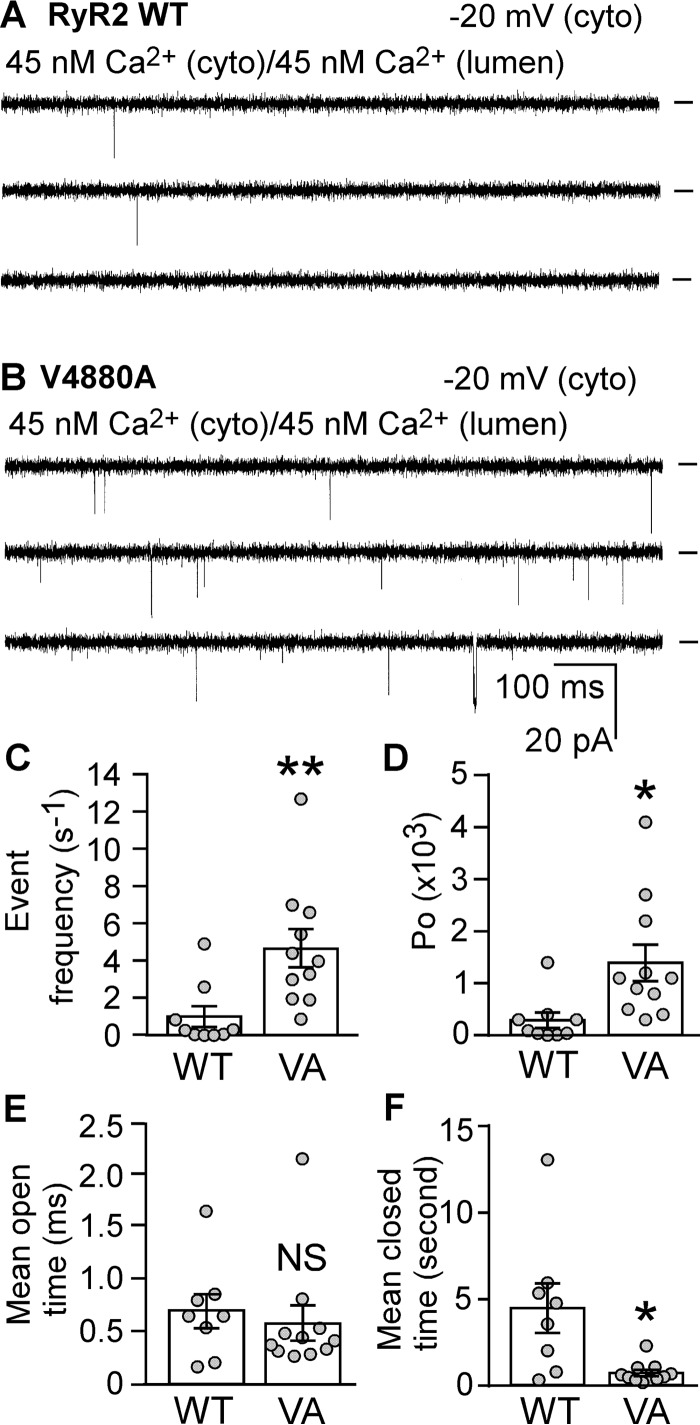
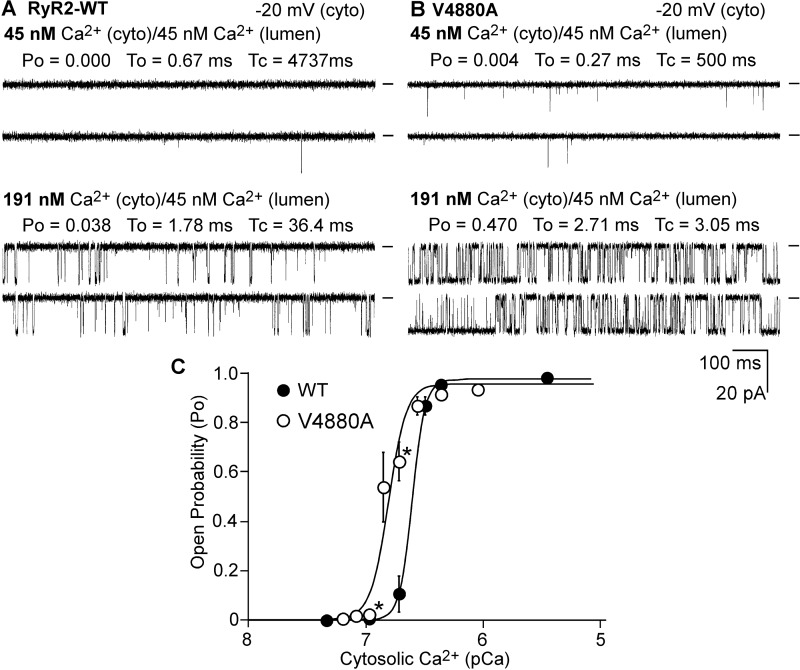
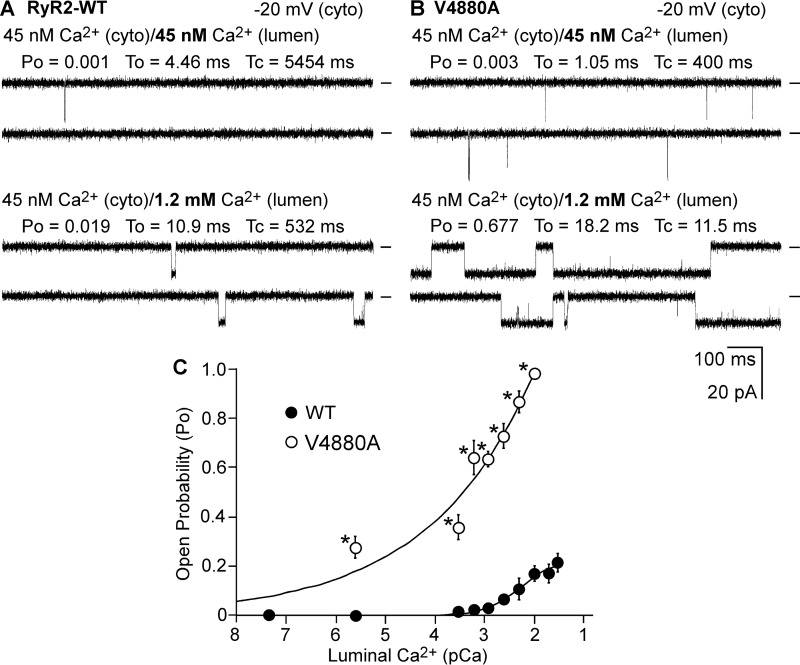
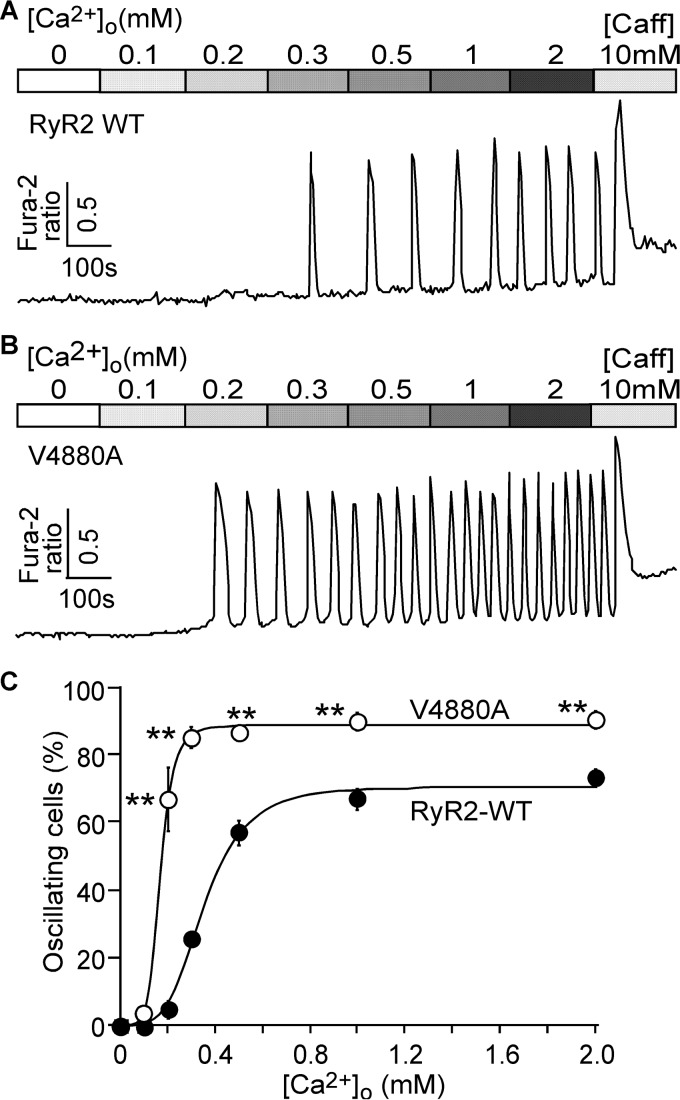
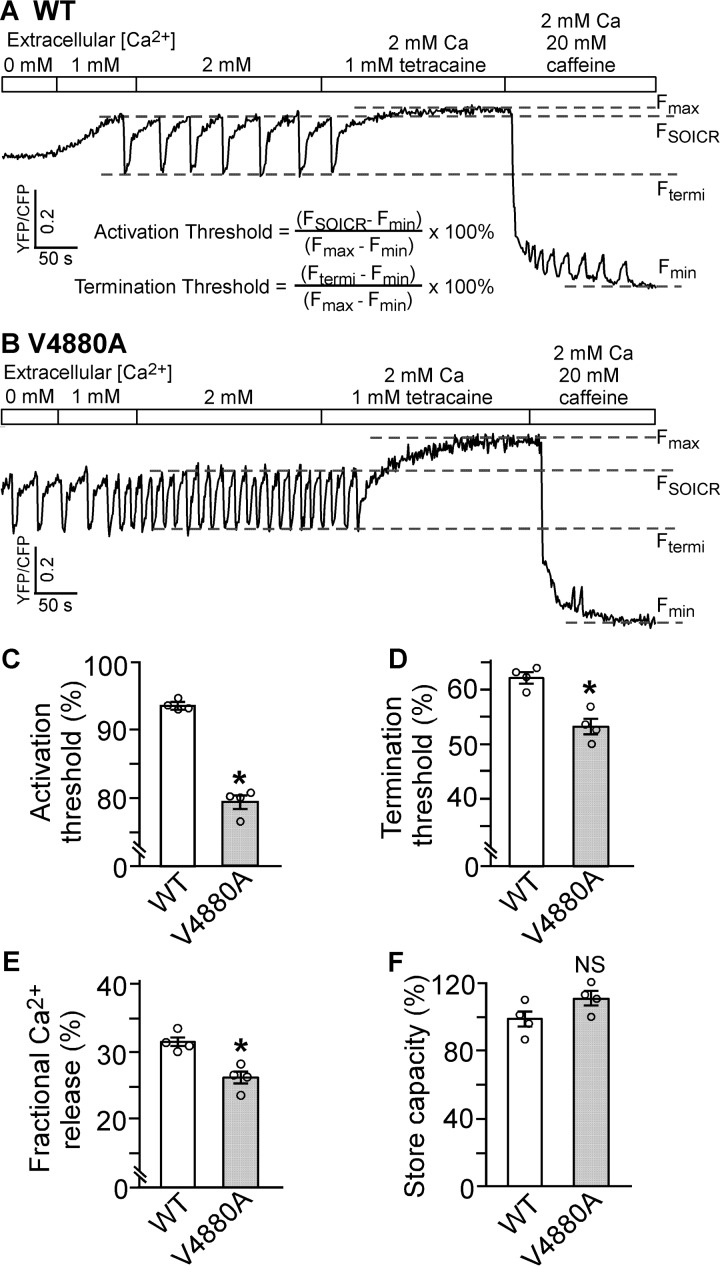
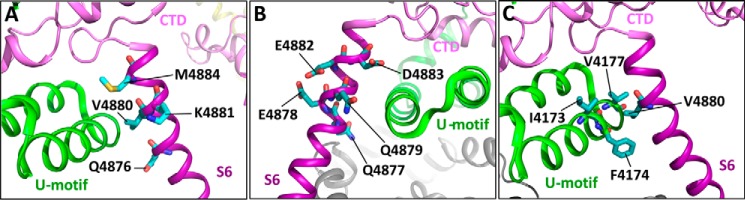
The ryanodine receptor (RyR) channel pore is formed by four S6 inner helices, with its intracellular gate located at the S6 helix bundle crossing region. The cytoplasmic region of the extended S6 helix is held by the U motif of the central domain and is thought to control the opening and closing of the S6 helix bundle. However, the functional significance of the S6 cytoplasmic region in channel gating is unknown. Here we assessed the role of the S6 cytoplasmic region in the function of cardiac RyR (RyR2) via structure-guided site-directed mutagenesis. We mutated each residue in the S6 cytoplasmic region of the mouse RyR2 (4876QQEQVKEDM4884) and characterized their functional impact. We found that mutations Q4876A, V4880A, K4881A, and M4884A, located mainly on one side of the S6 helix that faces the U motif, enhanced basal channel activity and the sensitivity to Ca2+ or caffeine activation, whereas mutations Q4877A, E4878A, Q4879A, and D4883A, located largely on the opposite side of S6, suppressed channel activity. Furthermore, V4880A, a cardiac arrhythmia-associated mutation, markedly enhanced the frequency of spontaneous openings and the sensitivity to cytosolic and luminal Ca2+ activation of single RyR2 channels. V4880A also increased the propensity and reduced the threshold for arrhythmogenic spontaneous Ca2+ release in HEK293 cells. Collectively, our data suggest that interactions between the cytoplasmic region of S6 and the U motif of RyR2 are important for stabilizing the closed state of the channel. Mutations in the S6/U motif domain interface likely destabilize the closed state of RyR2, resulting in enhanced basal channel activity and sensitivity to activation and increased propensity for spontaneous Ca2+ release and cardiac arrhythmias.
Keywords: calcium; calcium channel; calcium imaging; calcium intracellular release; calcium-binding protein; ryanodine receptor; sarcoplasmic reticulum (SR).
© 2016 by The American Society for Biochemistry and Molecular Biology, Inc.
Figures
Similar articles
-
Enhanced Cytosolic Ca2+ Activation Underlies a Common Defect of Central Domain Cardiac Ryanodine Receptor Mutations Linked to Arrhythmias.J Biol Chem. 2016 Nov 18;291(47):24528-24537. doi: 10.1074/jbc.M116.756528. Epub 2016 Oct 12. J Biol Chem. 2016. PMID: 27733687 Free PMC article.
-
RyR2 disease mutations at the C-terminal domain intersubunit interface alter closed-state stability and channel activation.J Biol Chem. 2021 Jul;297(1):100808. doi: 10.1016/j.jbc.2021.100808. Epub 2021 May 20. J Biol Chem. 2021. PMID: 34022226 Free PMC article.
-
The central domain of cardiac ryanodine receptor governs channel activation, regulation, and stability.J Biol Chem. 2020 Nov 13;295(46):15622-15635. doi: 10.1074/jbc.RA120.013512. Epub 2020 Sep 2. J Biol Chem. 2020. PMID: 32878990 Free PMC article.
-
Ca2+ stores regulate ryanodine receptor Ca2+ release channels via luminal and cytosolic Ca2+ sites.Clin Exp Pharmacol Physiol. 2007 Sep;34(9):889-96. doi: 10.1111/j.1440-1681.2007.04708.x. Clin Exp Pharmacol Physiol. 2007. PMID: 17645636 Review.
-
Luminal Ca(2+) activation of cardiac ryanodine receptors by luminal and cytoplasmic domains.Eur Biophys J. 2009 Dec;39(1):19-26. doi: 10.1007/s00249-009-0417-1. Epub 2009 Mar 3. Eur Biophys J. 2009. PMID: 19255753 Review.
Cited by
-
Ca2+-mediated activation of the skeletal-muscle ryanodine receptor ion channel.J Biol Chem. 2018 Dec 14;293(50):19501-19509. doi: 10.1074/jbc.RA118.004453. Epub 2018 Oct 19. J Biol Chem. 2018. PMID: 30341173 Free PMC article.
-
Control of cardiac ryanodine receptor by sarcoplasmic reticulum luminal Ca2.J Gen Physiol. 2017 Sep 4;149(9):867-875. doi: 10.1085/jgp.201711805. Epub 2017 Aug 10. J Gen Physiol. 2017. PMID: 28798281 Free PMC article. Review.
-
The structural basis of ryanodine receptor ion channel function.J Gen Physiol. 2017 Dec 4;149(12):1065-1089. doi: 10.1085/jgp.201711878. Epub 2017 Nov 9. J Gen Physiol. 2017. PMID: 29122978 Free PMC article. Review.
-
G4941K substitution in the pore-lining S6 helix of the skeletal muscle ryanodine receptor increases RyR1 sensitivity to cytosolic and luminal Ca2.J Biol Chem. 2018 Feb 9;293(6):2015-2028. doi: 10.1074/jbc.M117.803247. Epub 2017 Dec 18. J Biol Chem. 2018. PMID: 29255089 Free PMC article.
-
Description of a novel RyR2 mutation in a juvenile patient with symptomatic catecholaminergic polymorphic ventricular tachycardia in sleep and during exercise: a case report.J Med Case Rep. 2018 Oct 9;12(1):298. doi: 10.1186/s13256-018-1825-6. J Med Case Rep. 2018. PMID: 30296944 Free PMC article.
References
-
- Bers D. M. (2002) Cardiac excitation-contraction coupling. Nature 415, 198–205 - PubMed
-
- Fill M., and Copello J. A. (2002) Ryanodine receptor calcium release channels. Physiol. Rev. 82, 893–922 - PubMed
-
- Van and Petegem F. (2015) Ryanodine receptors: allosteric ion channel giants. J. Mol. Biol. 427, 31–53 - PubMed
-
- Maclennan D. H., and Zvaritch E. (2011) Mechanistic models for muscle diseases and disorders originating in the sarcoplasmic reticulum. Biochim. Biophys. Acta 1813, 948–964 - PubMed
MeSH terms
Substances
LinkOut - more resources
Full Text Sources
Other Literature Sources
Research Materials
Miscellaneous
