. 2016 Dec;172(4):2471-2490.
doi: 10.1104/pp.16.01519. Epub 2016 Oct 27.

Plant-Specific Preprotein and Amino Acid Transporter Proteins Are Required for tRNA Import into Mitochondria

Affiliations

Plant-Specific Preprotein and Amino Acid Transporter Proteins Are Required for tRNA Import into Mitochondria

Monika W Murcha et al. Plant Physiol. 2016 Dec.

Abstract

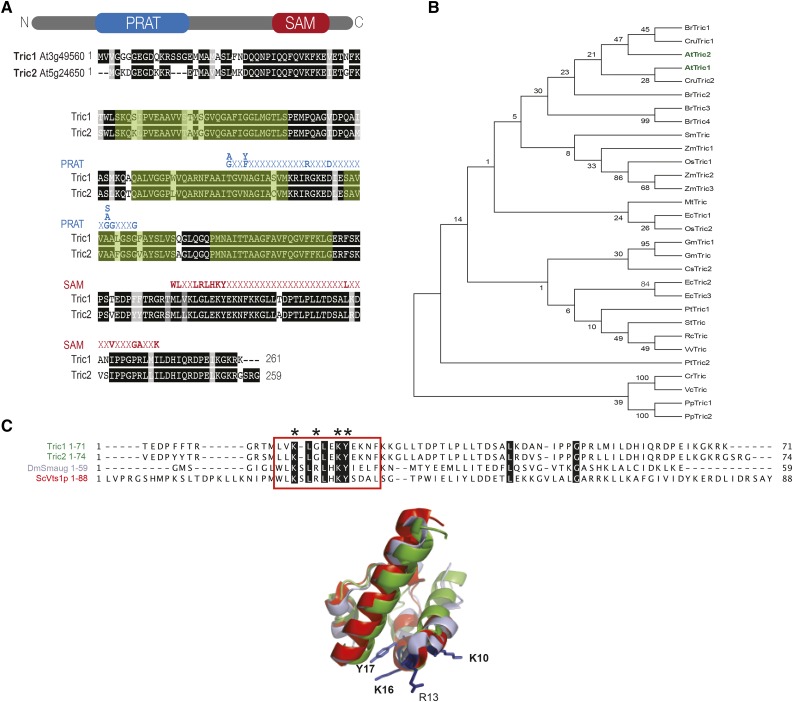
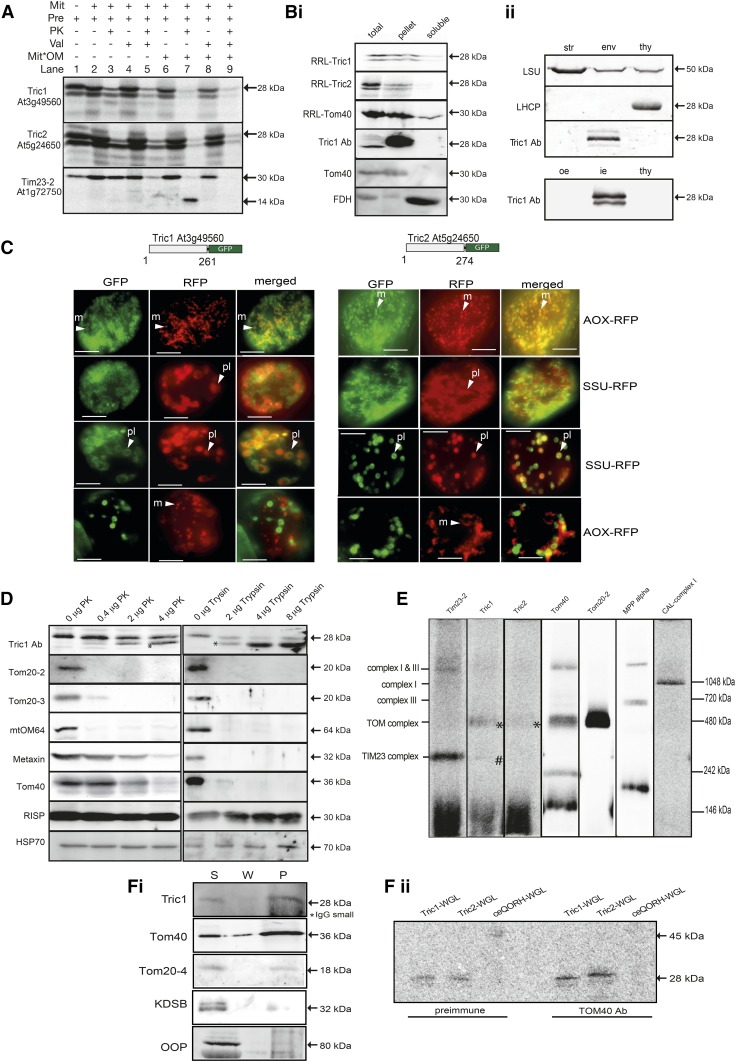
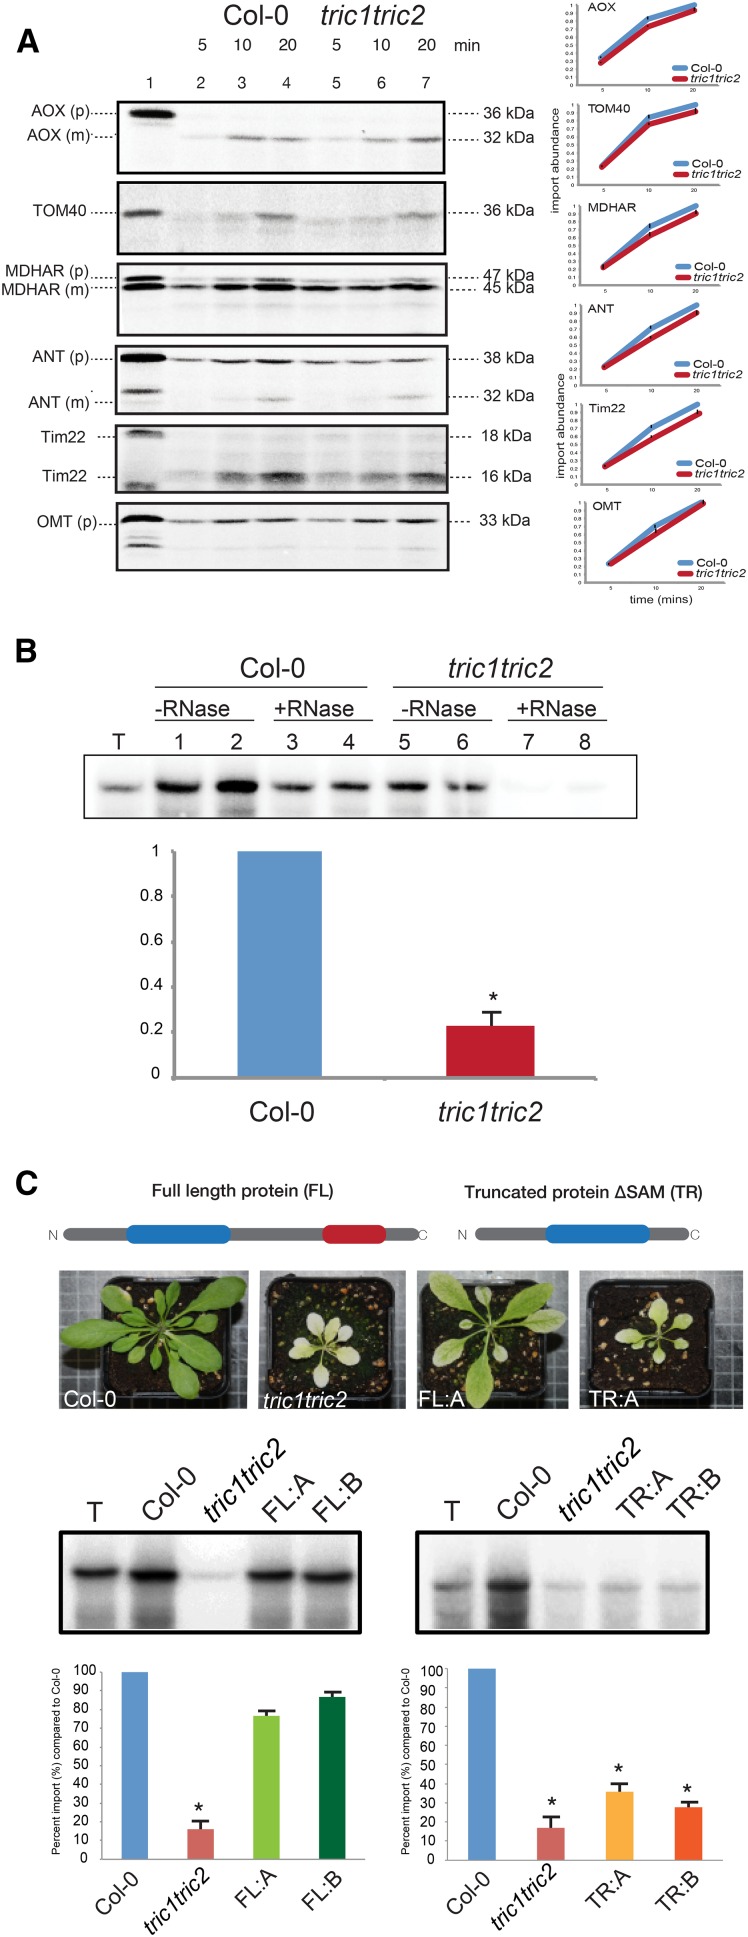
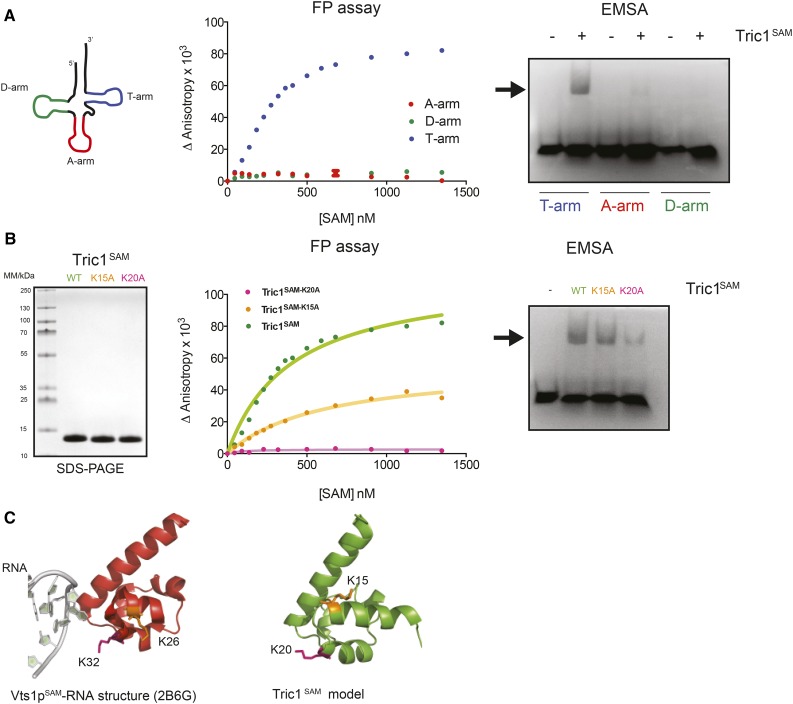
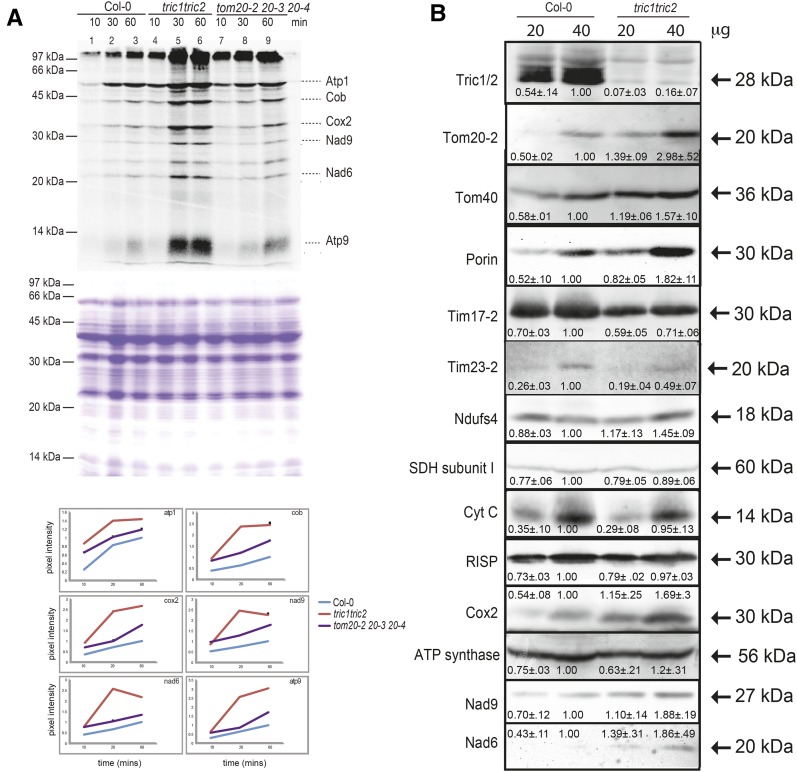
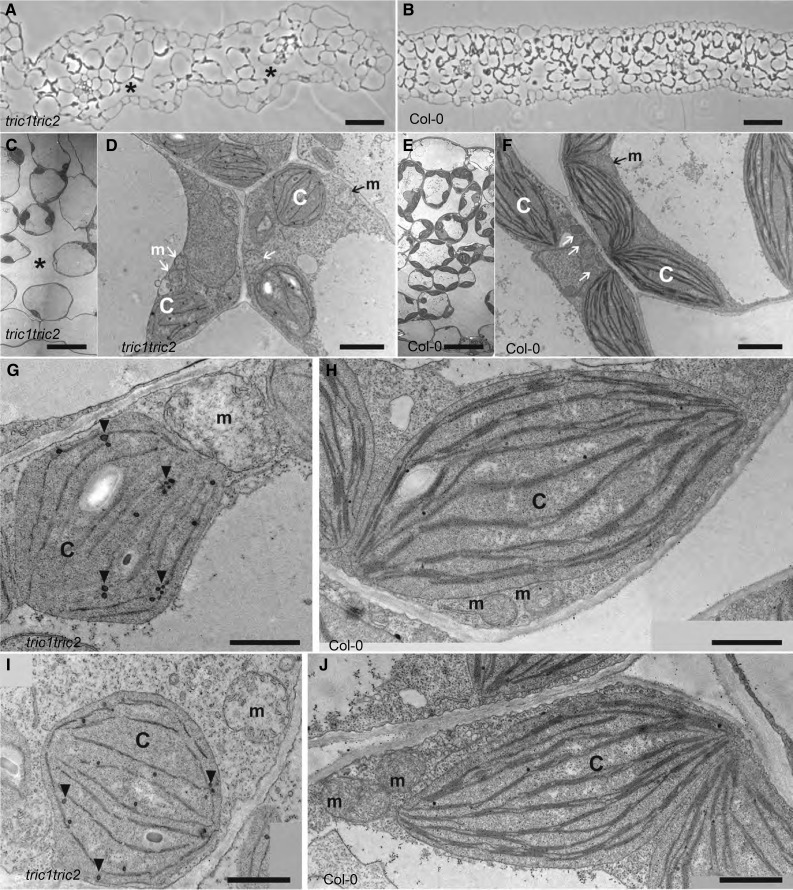
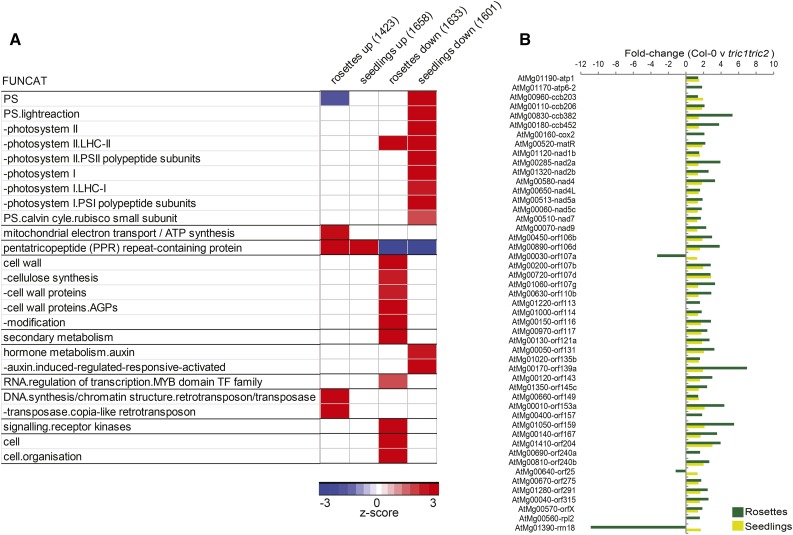
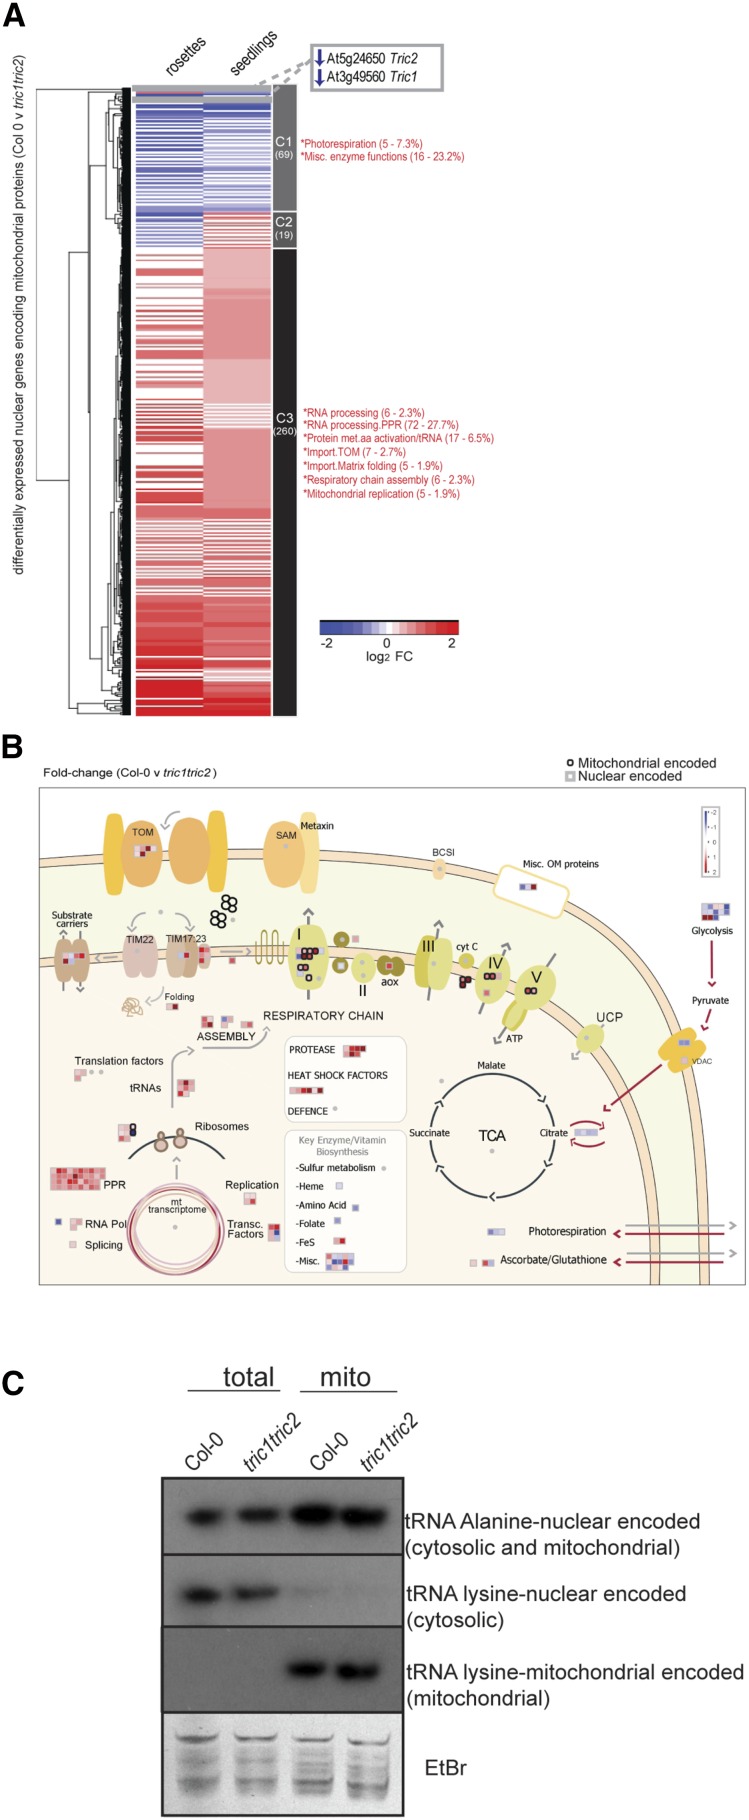
A variety of eukaryotes, in particular plants, do not contain the required number of tRNAs to support the translation of mitochondria-encoded genes and thus need to import tRNAs from the cytosol. This study identified two Arabidopsis (Arabidopsis thaliana) proteins, Tric1 and Tric2 (for tRNA import component), which on simultaneous inactivation by T-DNA insertion lines displayed a severely delayed and chlorotic growth phenotype and significantly reduced tRNA import capacity into isolated mitochondria. The predicted tRNA-binding domain of Tric1 and Tric2, a sterile-α-motif at the C-terminal end of the protein, was required to restore tRNA uptake ability in mitochondria of complemented plants. The purified predicted tRNA-binding domain binds the T-arm of the tRNA for alanine with conserved lysine residues required for binding. T-DNA inactivation of both Tric proteins further resulted in an increase in the in vitro rate of in organello protein synthesis, which was mediated by a reorganization of the nuclear transcriptome, in particular of genes encoding a variety of proteins required for mitochondrial gene expression at both the transcriptional and translational levels. The characterization of Tric1/2 provides mechanistic insight into the process of tRNA import into mitochondria and supports the theory that the tRNA import pathway resulted from the repurposing of a preexisting protein import apparatus.


Figures

Figure 1.
Figure 1.
Identification of novel plant preprotein and amino acid transporter proteins with a putative RNA-binding domain. A, Pairwise sequence alignment of Arabidopsis Tric1 (At3g49560) and Tric2 (At5g24650). Both proteins are predicted to contain a PRAT domain and a SAM domain, indicated in blue and red, respectively. The four predicted transmembrane domains are highlighted in green as determined by TMHMM (http://www.cbs.dtu.dk/services/TMHMM/). B, Phylogenetic analysis of all Tric1/2 orthologs from 17 plant species and algae (red, green, and brown), with plant species chosen as representatives of each evolutionary clade from Physcomitrella patens (Pp) to Eucalyptus grandis (Eg). At, Arabidopsis; Br, Brassica rapa; Cre, Chlamydomonas reinhardtii; Cru, Capsella rubella; Cs, Cucumis sativus; Gm, Glycine max; Mt, Medicago truncatula; Os, Oryza sativa; Pt, Populus trichocarpa; Rc, Ricinus communis; Sm, Selaginella moellendorfii; St, Solanum tuberosum; Vc, Volvox carteri; Vv, Vitis vinifera; Zm, Zea mays. C, Comparison of the SAM domains of Tric1 and Tric2 from Arabidopsis with Vts1p (Uniprot Q08831) from Saccharomyces cerevisiae (Sc) and Smaug (Uniprot Q23972) from Drosophila melanogaster (Dm), which have been demonstrated to bind RNA. Smaug variants that display reduced RNA binding are indicated, according to Aviv et al. (2003). Amino acid residues (Y, L, and K) involved in RNA binding are conserved in both Tric1 and Tric2 proteins (indicated by asterisks). Superimposition of the three-dimensional model of Tric1 (green) with the structures of Smaug (light blue) and Vts1p (red) is shown at bottom, and the conserved residues are indicated (numbering corresponds to the SAM domain of Smaug). The structural prediction for Tric1 was generated using I-TASSER (http://zhanglab.ccmb.med.umich.edu/I-TASSER/). The image was generated using PyMOL (http://www.pymol.org/).
Figure 2.
Figure 2.
Tric1 and Tric2 are dual targeted proteins. A, In vitro uptake of Tric1 and Tric2 into mitochondria. In vitro translated and radiolabeled Tric1 and Tric2 proteins were incubated with isolated mitochondria under conditions that support the uptake of proteins. Lane 1, Precursor protein alone showing a product with an apparent molecular mass of 28 kD; a lower band with a molecular mass of 26 kD represents translation from a Met residue at position 18/19 (see Fig. 1A). Lane 2, Incubation of precursor protein with mitochondria under conditions that support import. Lane 3, as for lane 2 with proteinase K (PK) added to 0.4 µg mL−1 to digest all protein still exposed on the outer membrane. Note the increase in signal intensity of the 26-kD band compared with lane 2. Lane 4, as for lane 2 with the addition of valinomycin (Val) prior to the commencement of the import uptake assay. Lane 5, as for lane 4 with PK added following the import uptake assay. Lanes 6 and 7, as for lanes 2 and 3 except that, prior to the addition of PK, the outer mitochondrial membrane was ruptured (Mit*OM). Lanes 8 and 9, as for lanes 6 and 7 with the addition of valinomycin prior to the commencement of the import uptake assay. Tim23-2 was used to test mitochondrial import ability and successful rupture of the outer membrane, as evidenced by the generation of a 14-kD inner membrane-located, PK-protected band. Bi, Carbonate extractions following the import of RRL-Tric1, RRL-Tric2, and Tom40 into isolated mitochondria and immunodetection of carbonate-extracted mitochondria followed by immunodetection against endogenous Tric1, Tric2, Tom40, and formate dehydrogenase (FDH). Bii, Immunoblot analysis of Tric protein in chloroplast subfractions. Equal protein amounts of Arabidopsis chloroplast stroma (str), envelopes (env), and thylakoids (thy) were resolved by SDS-PAGE, blotted to nitrocellulose membranes, and probed with antibodies, as indicated. The bottom gel shows pea chloroplast outer envelope (oe), inner envelope (ie), and thylakoids (thy). Marker proteins are stromal LSU (large subunit of ribulose-1,5-bisphosphate carboxylase) and thylakoid LHCP (light-harvesting chlorophyll protein). C, In vivo targeting analysis of Tric1 and Tric2 using fluorescent protein tagging. The full-length coding sequences of Tric1 and Tric2 were fused in frame with GFP and cotransformed into Arabidopsis suspension cell cultures using biolistic transformation. For both Tric proteins, targeting to mitochondria and chloroplasts was observed, although observation of dual targeting within the same cell was rare. Close examination of the GFP fluorescence revealed that it forms halo- or doughnut-type patterns in both mitochondria and chloroplasts. Superimposition of the RFP pattern for mitochondrial targeting (alternative oxidase [AOX]) or chloroplast (SSU) revealed that it was on the periphery of the structures. Bars = 20 mm. m, Mitochondria; pl, plastid. D, Protease accessibility of Tric1 and Tric2 on the mitochondrial outer membrane by protease digestion (PK and trypsin) of Columbia-0 (Col-0) mitochondria followed by immunodetection. Purified mitochondria were subjected to protease treatment as indicated and resolved by SDS-PAGE, blotted to nitrocellulose membranes, and probed with antibodies as indicated. The Tric1 antibody detected at 28 kD produced a breakdown product (asterisk) at the lowest levels of protease treatment, increasing in intensity with increasing concentrations. As controls, the mitochondrial outer membrane proteins Tom20-2, Tom20-3, mtOM64, metaxin, Tom40, the inner membrane protein RISP, and matrix protein (HSP70) also were detected. E, In vitro import of radiolabeled Tim23-2, Tric1, Tric2, Tom40, Tom20-2, MPP-α, and complex I subunit CAL into isolated mitochondria followed by BN-PAGE analysis. Fi, Coimmunoprecipitation analysis of purified mitochondria with Tom40 antibody. Digitonin-ruptured mitochondria were incubated with Tom40 antibody and Protein A-Sepharose. Supernatant (S), wash (W), and pellet (P) fractions were resolved by SDS-PAGE, blotted to nitrocellulose membranes, and probed with antibodies as indicated. The asterisk indicates cross-reactivity toward the small subunit of IgG resolving at 25 kD. Fii, Coimmunoprecipitation analysis as in Fi, except that wheat germ lysate (WGL)-translated radiolabeled Tric1, Tric2, and ceQORH was added to the immunoprecipitation reaction containing either preimmune serum or Tom40 antibody. Pellet fractions were resolved by SDS-PAGE, dried, and exposed to a phosphor-imaging screen.
Figure 3.
Figure 3.
Tric proteins are involved in tRNA but not in protein import into isolated mitochondria. A, In vitro protein uptake assays into mitochondria isolated from wild-type (Col-0) and tric1tric2 plants. Lane 1, Precursor protein alone. Lanes 2 to 4, Incubation of precursor protein with isolated mitochondria for the time period indicated followed by treatment with PK (0.4 μg mL−1). Lanes 5 to 7, As for lanes 2 to 4 except mitochondria were isolated from tric1tric2 plants and used in the protein uptake assays. For precursor proteins without a cleavable presequence, Tim22 and oxaloacetate malate translocator (OMT) were used. Mitoplasts were prepared following import and prior to PK digestion to visualize the incorporation of proteins into the inner mitochondrial membrane. The apparent molecular mass of the precursor (p) and mature (m) proteins are indicated at right in kD. The graphs show the quantification of import from independent assays (n = 3, P < 0.05 by Student’s t test). B, 32P-labeled plant cytosolic tRNAAla was incubated with mitochondria isolated from Col-0 and tric1tric2 plants under conditions that support tRNA uptake into mitochondria. Lane T, The radiolabeled probe represents 1% of that added to the uptake assay. Lanes 1 and 2, Labeled probed that was precipitated after the uptake assay in mitochondria isolated from Arabidopsis wild-type (Col-0) plants. Lanes 3 and 4, As for lanes 1 and 2 except that mitochondria were treated with RNase after the uptake assay to remove all labeled probe outside mitochondria. Lanes 5 to 8, As for lanes 1 to 4 except that mitochondria were isolated from tric1tric2 mutants and used in the uptake assays. Quantification of the probe intensity from RNase-treated (import) tric1tric2 mitochondria relative to the wild type is graphed below (as a percentage relative to Col-0, where Col-0 is 100%). C, Complementation of the tric1tric2 mutant with full-length Tric1 and truncated Tric1ΔSAM. Top, Diagrammatic representation of the Tric proteins used in the complementation. Representative images of the full-length (FL) Tric1 and truncated (TR) Tric1ΔSAM used in the complemented lines are shown. Bottom, In vitro tRNA uptake assays into isolated mitochondria from various lines: Col-0 = wild type plants; tric1tric2 = double knockout T-DNA mutant; FL:A = complementation line 1 with full-length Tric1; FL:B = complementation line 2 with full-length Tric1; TR:A = complementation line 1 with truncated Tric1; and TR:B = complementation line 2 with Tric1. Gel images represent the tRNA probe alone and the RNase-treated samples from the various lines. Shown below is the quantification of probe intensity relative to Col-0 (shown as a percentage). Quantification of three independent assays (n = 3, P < 0.05) is shown. Asterisks indicate significant differences (Student’s t test).
Figure 4.
Figure 4.
The SAM domain of Tric1 binds RNA. A, Structure of the A-, D-, and T-arms of the tRNA for Ala (left). Binding analysis of Tric1SAM and RNA oligonucleotides corresponding to the three arms of tRNAAla (15-base A-arm, 16-base D-arm, and 17-base T-arm) was carried out. Fluorescence polarization (FP) assay (middle) and output from electrophoretic mobility shift assay (EMSA; right) also are shown. The arrow indicates the position of the shifted band. B, Binding analysis of Tric1SAM (wild type [WT], K15A, and K20A) to the T-arm RNA oligonucleotide. The SDS-PAGE gel, Coomassie Blue stained, shows the purity of Tric1SAM variants (left). The FP assay (middle) and output from EMSA (right) also are shown. The arrow indicates the position of the shifted band. C, Three-dimensional digital representations of the crystal structure of Vts1p in complex with RNA (left) and a model for Tric1SAM structure (right) highlighting the key Lys residues involved in RNA binding. These images were generated using PyMOL (http://www.pymol.org/).
Figure 5.
Figure 5.
Deleting Tric1 and Tric2 affects mitochondrial translation and protein abundance. A, In organello translation in mitochondria isolated from wild-type (Col-0), tric1tric2, and tom20-2tom20-3tom20-4 plants. The positions of several mitochondria-encoded proteins are indicated with the apparent molecular mass (kD) and quantification (top). Coomassie Blue staining is shown in the middle to confirm equal loading. At bottom is a quantification of band intensity as identified previously by apparent molecular mass values (Giegé et al., 2005): atp1, α-subunit of ATP synthase; cob, cytochrome b; cox2, subunit 2 of cytochrome oxidase; nad9, subunit 9 of complex I (NADH ubiquinone oxidoreductase); nad6, subunit 6 of complex I; atp9, subunit 9 of ATP synthase. B, Immunodetection of mitochondrial proteins associated with protein import and respiration.
Figure 6.
Figure 6.
The loss of function of Tric proteins alters cellular morphology. A and B, Semithin cross sections of rosette leaves from 17-d-old tric1tric2 plants (A) and Col-0 wild-type plants (B). Asterisks indicate large intracellular spaces in tric1tric2. Bars = 50 µm. C to J, Transmission electron micrographs of mature rosette leaves from 44-d-old tric1tric2 plants (C, D, G, and I) and 22-d-old Col-0 wild-type plants (E, F, H, and J). C to F, Cross sections of leaves. The asterisk indicates a large intracellular space in tric1tric2. c, Chloroplast; m, mitochondria, indicated by arrows. Bars = 50 µm (C and E) and 2 µm (D and F). G to J, Closeup views of chloroplasts and mitochondria. Note that in tric1tric2, plastid thylakoid membranes are reduced while plastoglobuli (arrowheads) accumulate. The majority of the mitochondria from tric1tric2 are larger and spheroidal with fewer cristae and disrupted invaginations. Bars = 1 µm.
Figure 7.
Figure 7.
Transcriptome analyses of tric1tric2 plants. A, All differentially expressed genes in the rosettes and seedlings (Col-0 versus tric1tric2) were analyzed for overrepresented functional categories (FUNCAT) using the PageMan tool (over-representation analysis: Fisher’s test with Benjamini-Hochberg FDR correction). The number of genes in each set is indicated in parentheses. Only significantly overrepresented functional categories (P < 0.05) in one or more gene sets are shown (z score of 1.96 represents an FDR-corrected P value of 0.05). B, Bar graph showing the 49 significantly differentially expressed (FDR < 0.05) mitochondria-encoded genes in rosettes and/or seedlings of tric1tric2 mutants compared with Col-0.
Figure 8.
Figure 8.
In-depth analyses of the mitochondrial transcriptome (nucleus and mitochondria encoded) in tric1tric2 plants. A, All significantly differentially expressed (FDR < 0.05) nuclear genes encoding mitochondria-localized proteins in tric1tric2 compared with Col-0 in rosettes and seedlings grown under normal conditions. Three clusters were identified, and the number of genes in each cluster is shown below the cluster number (C1–C3). Genes in each cluster were analyzed for significantly overrepresented functional categories by z score analysis, and significantly enriched categories (P < 0.05) are indicated by asterisks, with the number of genes and the percentage in each cluster also shown. FC, Fold change. B, MapMan visualization of the changes in transcript abundance encoding mitochondrial proteins. The nucleus-encoded genes are represented by squares, while the mitochondria-encoded genes are represented by circles. The fold changes and functional classification of the proteins encoded by the genes are shown in Supplemental Table S2. TCA, Tricarboxylic acid cycle. C, Northern-blot analysis of total plant and isolated mitochondrial RNA from Col-0 and tric1tric2 using probes specific for nucleus-encoded tRNAAla, nucleus-encoded and cytosolic tRNALys, and mitochondria-encoded tRNALys. Ethidium bromide (EtBr) staining is shown to confirm equal RNA extraction between samples.

Similar articles

Cited by

References

    1. Adams KL, Palmer JD (2003) Evolution of mitochondrial gene content: gene loss and transfer to the nucleus. Mol Phylogenet Evol 29: 380–395 - PubMed
    1. Altschul SF, Koonin EV (1998) Iterated profile searches with PSI-BLAST: a tool for discovery in protein databases. Trends Biochem Sci 23: 444–447 - PubMed
    1. Arbustini E, Diegoli M, Fasani R, Grasso M, Morbini P, Banchieri N, Bellini O, Dal Bello B, Pilotto A, Magrini G, et al. (1998) Mitochondrial DNA mutations and mitochondrial abnormalities in dilated cardiomyopathy. Am J Pathol 153: 1501–1510 - PMC - PubMed
    1. Aronsson H, Jarvis RP (2011) Rapid isolation of Arabidopsis chloroplasts and their use for in vitro protein import assays. Methods Mol Biol 774: 281–305 - PubMed
    1. Aung K, Hu J (2011) The Arabidopsis tail-anchored protein PEROXISOMAL AND MITOCHONDRIAL DIVISION FACTOR1 is involved in the morphogenesis and proliferation of peroxisomes and mitochondria. Plant Cell 23: 4446–4461 - PMC - PubMed

Publication types

MeSH terms