. 2016 Oct 28;354(6311):aaf2786.
doi: 10.1126/science.aaf2786. Epub 2016 Oct 27.

Systems-level analysis of mechanisms regulating yeast metabolic flux

Affiliations

Systems-level analysis of mechanisms regulating yeast metabolic flux

Sean R Hackett et al. Science. .

Abstract

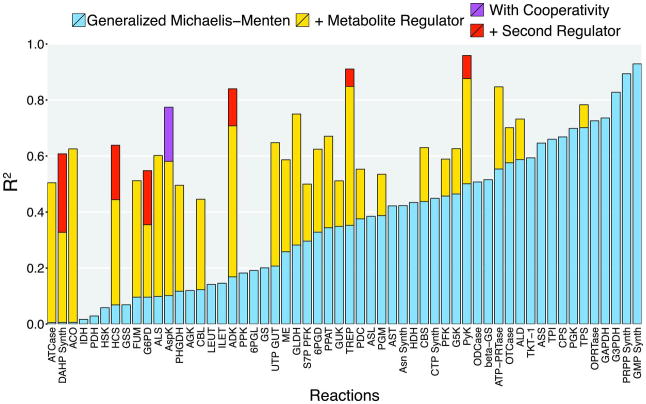
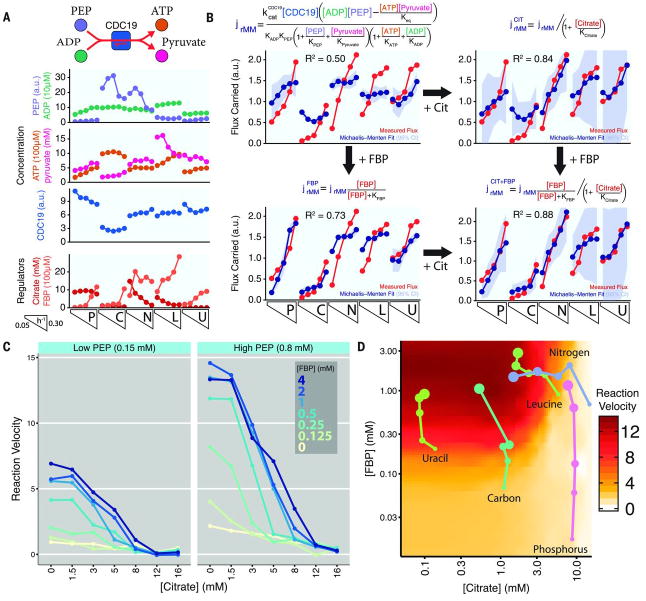
Cellular metabolic fluxes are determined by enzyme activities and metabolite abundances. Biochemical approaches reveal the impact of specific substrates or regulators on enzyme kinetics but do not capture the extent to which metabolite and enzyme concentrations vary across physiological states and, therefore, how cellular reactions are regulated. We measured enzyme and metabolite concentrations and metabolic fluxes across 25 steady-state yeast cultures. We then assessed the extent to which flux can be explained by a Michaelis-Menten relationship between enzyme, substrate, product, and potential regulator concentrations. This revealed three previously unrecognized instances of cross-pathway regulation, which we biochemically verified. One of these involved inhibition of pyruvate kinase by citrate, which accumulated and thereby curtailed glycolytic outflow in nitrogen-limited yeast. Overall, substrate concentrations were the strongest driver of the net rates of cellular metabolic reactions, with metabolite concentrations collectively having more than double the physiological impact of enzymes.


Figures

Figure 1
Figure 1
Integrative analysis of fluxes and metabolite and enzyme concentrations via SIMMER. (A) Measured flux (determined by flux balance analysis constrained with uptake, excretion, and biomass composition data) is related, on a reaction-by-reaction basis, to enzyme and metabolite concentrations via a Michaelis-Menten equation. The extent to which variation in flux across experimental conditions can be explained by enzyme and metabolite abundances is assessed. Heatmaps reflect the measured fluxes, enzyme abundances, and metabolite abundances. Each heatmap contains 5 columns grouped together for each limiting nutrient, arranged from slower to faster growth. The groups of 5 columns are arranged in the order of phosphorus, carbon, nitrogen, leucine, and uracil limitation. For expanded heatmaps, see Fig. S2, S5, and S9. Scenario 1 shows the glycolytic reaction catalyzed by triose phosphate isomerase (see also Fig. 2) and Scenario 2 pyruvate kinase (see also Fig. 5). Each panel compares measured flux (red dots) to the Michaelis-Menten predictions (blue dots) across the 25 nutrient conditions. (B) Identification of allosteric regulators. When a simple Michaelis-Menten expression did not account for the observed fluxes, the impact of adding allosteric regulation by measured metabolites was tested. Physiologically important regulation significantly enhances the fit to the fluxes. Scenario 1 shows regulation of pyruvate kinase by fructose 1,6-bisphosphate and citrate and Scenario 2 shows the lack of regulation of pyruvate kinase by fructose 6-phosphate.
Figure 2
Figure 2
Analysis of flux control through triose-phosphate isomerase and PRPP amidotransferase. (A) Substrate, product, and enzyme concentrations for the triose-phosphate isomerase reaction in glycolysis. The 25 experimental conditions are laid out across the X-axis as per Fig. 1. (B) Michaelis-Menten equation relating concentrations to flux and extent of agreement between measured fluxes (red) and the best Michaelis-Menten fit (blue). (C) Substrate, product, and enzyme concentrations for the PRPP aminotransferase reaction, the committed step of purine biosynthesis. (D) Michaelis-Menten equation relating concentrations to flux and extent of agreement between measured fluxes and the best Michaelis-Menten fit. (E) Concentrations of the reaction inhibitor AMP and extent of agreement between measured fluxes and the best Michaelis-Menten fit after including AMP as a regulator. DHAP, dihydroxyacetone phosphate; GAP, glyceraldehyde 3-phosphate; PRPP, phosphoribosyl pyrophosphate.
Figure 3
Figure 3
Integration of experimental data and literature knowledge to predict physiological regulators of yeast metabolism. Candidate reaction equations with and without regulation follow a standard Michaelis-Menten form, with substrate, product, and enzyme taken from standard metabolic reconstructions and regulators selected based on reported regulators in the BRENDA database of the reaction in any organism (in the Michaelis-Menten equation, R = 1 implies no regulation). A list of 20 gold standard instances of physiological yeast metabolic regulation was assembled based on prior literature, and used to determine the prior probability of a candidate regulator i being a physiological regulator, Pr(Regulationi). On average, Pr(Regulationi) is low, consistent with physiological regulation being rare. The extent of fit between the measured fluxes and those predicted by candidate reaction equation determines Pr(Data ∣ Regulationi). By Bayes’ theorem, the product of these two probabilities is Pr(Regulationi ∣ Data), the probability that regulatory event i is physiologically meaningful. A penalty for the additional parameters introduced by regulation was also included, to yield a final determination of whether the regulatory event is supported. Best supported refers to the lowest AICc. Other supported refers to any alternative regulators that improve upon the unregulated model (AICc < AICcnoreg).
Figure 4
Figure 4
Consistency between measured flux and Michaelis-Menten fits for 56 cellular metabolic reactions. For 29 reactions, inclusion of regulation by a measured metabolite was statistically supported. R2 was determined by Pearson correlation of measured flux with the output of the Michaelis-Menten equation across the 25 experimental conditions. Reaction abbreviations can be found in Table S4.
Figure 5
Figure 5
Pyruvate kinase regulation by fructose 1,6-bisphosphate (FBP) and citrate. (A) Substrate, product, enzyme, and regulator concentrations for the pyruvate kinase reaction that controls exit from glycolysis. (B) Extent of agreement between measured fluxes and the best Michaelis-Menten fit, with and without including FBP, citrate, or both as regulators. The improvement in fit due to both regulators was significant (p < 10-4). FBP is a classical activator of pyruvate kinase, whereas citrate had not been described as an inhibitor. (C) Biochemical confirmation that physiological citrate concentrations inhibit the dominant yeast pyruvate kinase isozyme (Cdc19) across the physiologically relevant range of phosphoenolpyruvate (PEP) and FBP concentrations. (D) Impact of cellular FBP and citrate concentrations across the 25 experimental conditions on Cdc19 activity. Pyruvate kinase activity (per enzyme and assuming fixed substrate concentrations of 0.8 mM PEP and 0.2 mM ADP) was determined by interpolation of the biochemical data shown in Panel C. Each data point reflects a single experimental condition, with the size of the point corresponding to the specific growth rate. Increasing flux with faster specific growth rate is accomplished in phosphorous, carbon, and uracil limitation through increasing concentrations of FBP, whereas in nitrogen and leucine limitation it is achieved through decreasing concentration of citrate.
Figure 6
Figure 6
The primary determinant of net cellular metabolic reaction rates is metabolite concentrations. To capture the impact of metabolite and enzyme concentrations on flux through individual reactions, we determined the metabolic leverage of each species: the fraction of flux variability across experimental conditions that is explained by variation in each species’ concentration, as determined by the sensitivity of the reaction rate to the species and the variance of the species’ concentration across the physiological conditions. (A) Ternary plot displaying breakdown of metabolic leverage into substrates and products (sum of leverage of all such species), enzyme, and regulators. Metabolic reactions containing either no regulation or validated yeast-specific regulation are included (N = 29). (B) The reactions in panel A are grouped according to reversibility. Reactions were classified as reversible or not, based on whether the direction of net flux changes across physiological conditions (18); they were subsequently divided into strongly forward driven versus net forward based on the standard free energy (cutoff -5 kJ/mol) (45). (C) Pie charts displaying the average metabolic leverage of substrate, product, regulator, and enzyme concentrations. Less reversible reactions are subject to greater allosteric regulation.

Comment in

  • Metabolism-Centric Trans-Omics.
    Yugi K, Kuroda S. Yugi K, et al. Cell Syst. 2017 Jan 25;4(1):19-20. doi: 10.1016/j.cels.2017.01.007. Cell Syst. 2017. PMID: 28125790

References

    1. Caspi R, et al. Nucleic acids research. 2014;42:D459. - PMC - PubMed
    1. Kacser H, Burns JA. Symposia of the Society for Experimental Biology. 1973;27:65. - PubMed
    1. Fell D. Understanding the control of metabolism. Portland Press Ltd; 1997.
    1. Tummler K, Lubitz T, Schelker M, Klipp E. The FEBS journal. 2014;281:549. - PubMed
    1. Hauf J, Zimmermann FK, Muller S. Enzyme and microbial technology. 2000;26:688. - PubMed

Publication types

MeSH terms