. 2016 Oct 28;354(6311):aaf3928.
doi: 10.1126/science.aaf3928. Epub 2016 Oct 27.

Increased spatiotemporal resolution reveals highly dynamic dense tubular matrices in the peripheral ER

Affiliations

Increased spatiotemporal resolution reveals highly dynamic dense tubular matrices in the peripheral ER

Jonathon Nixon-Abell et al. Science. .

Abstract

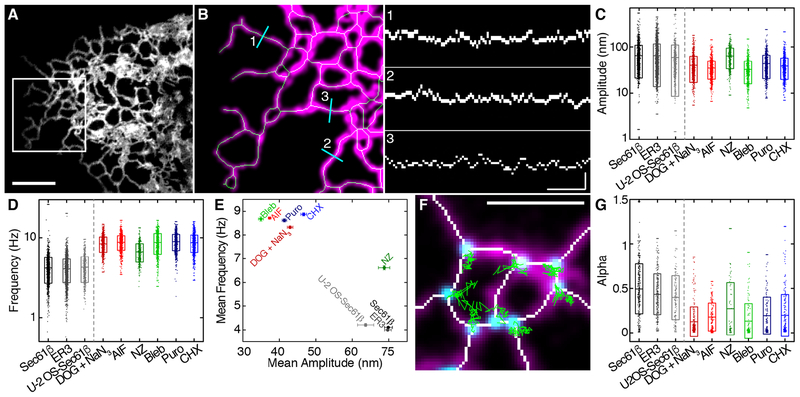
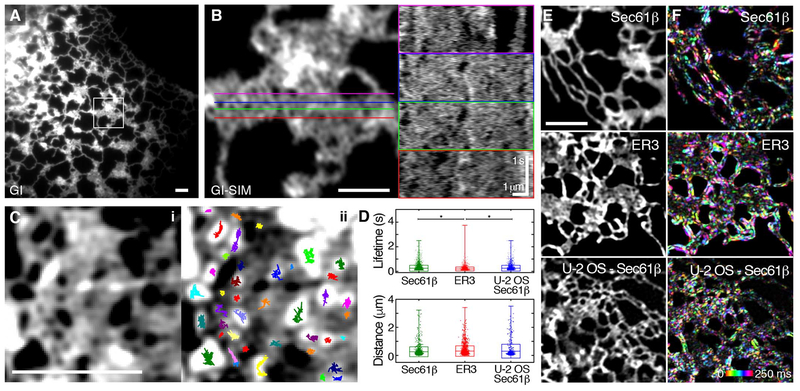
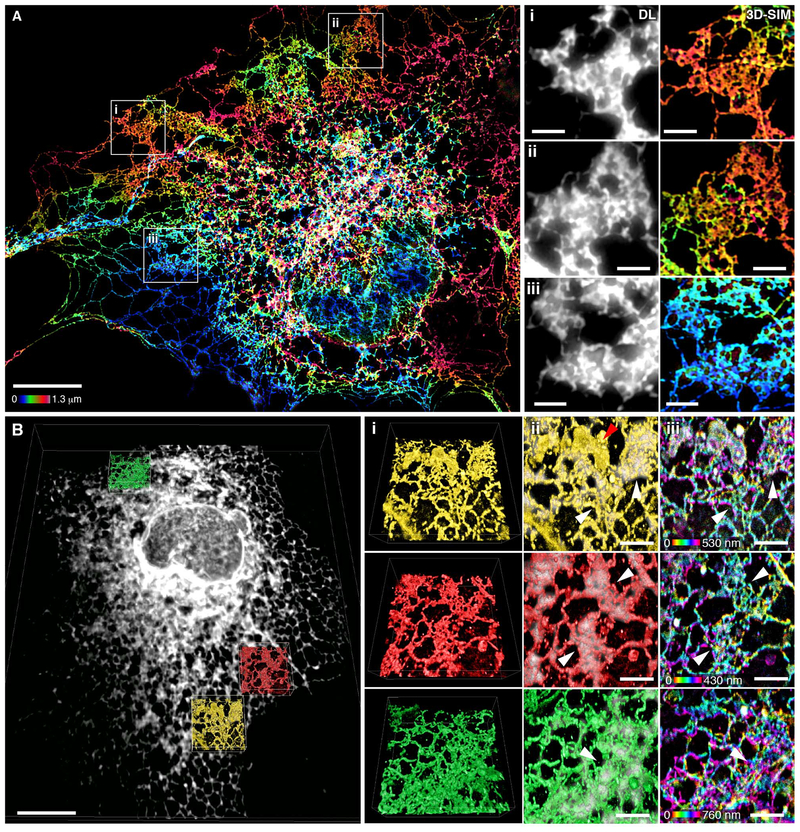
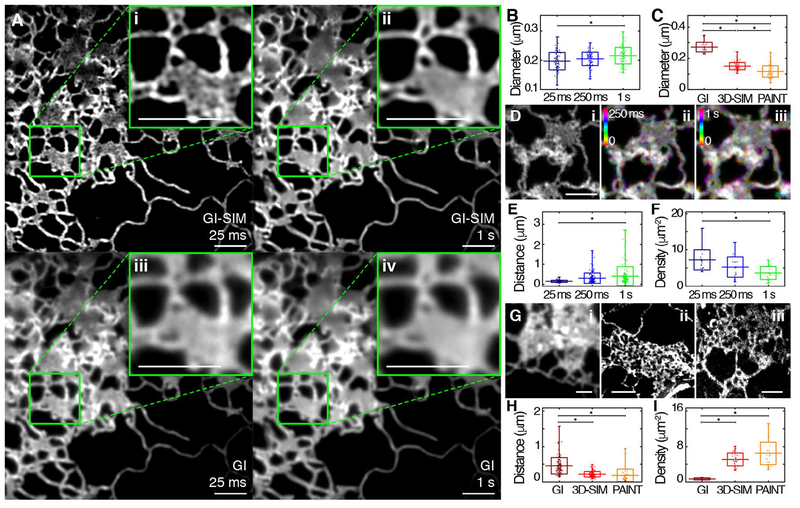
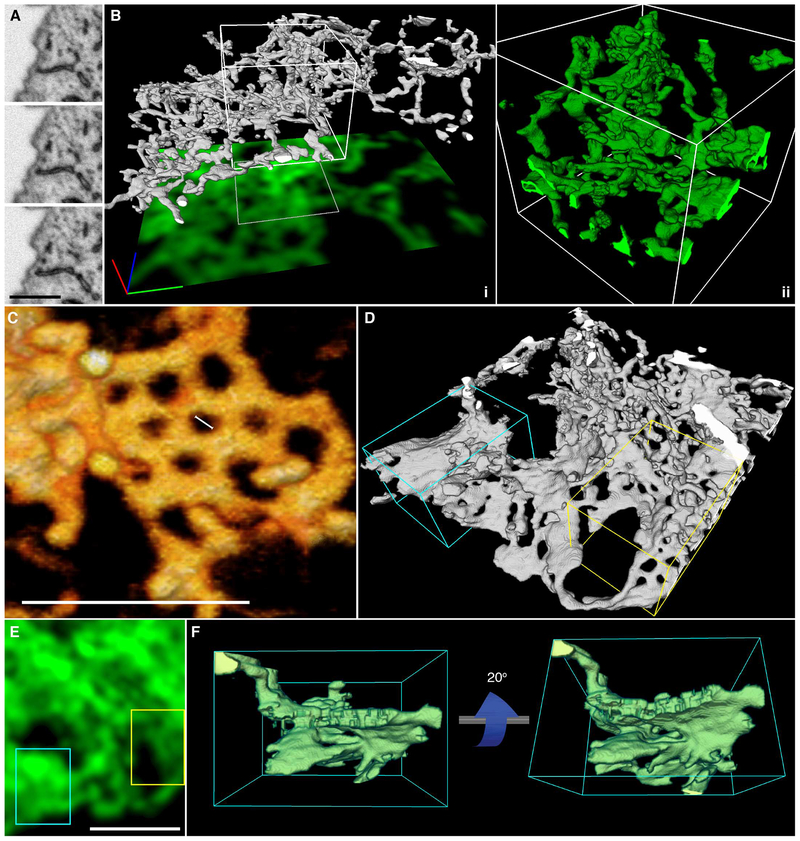
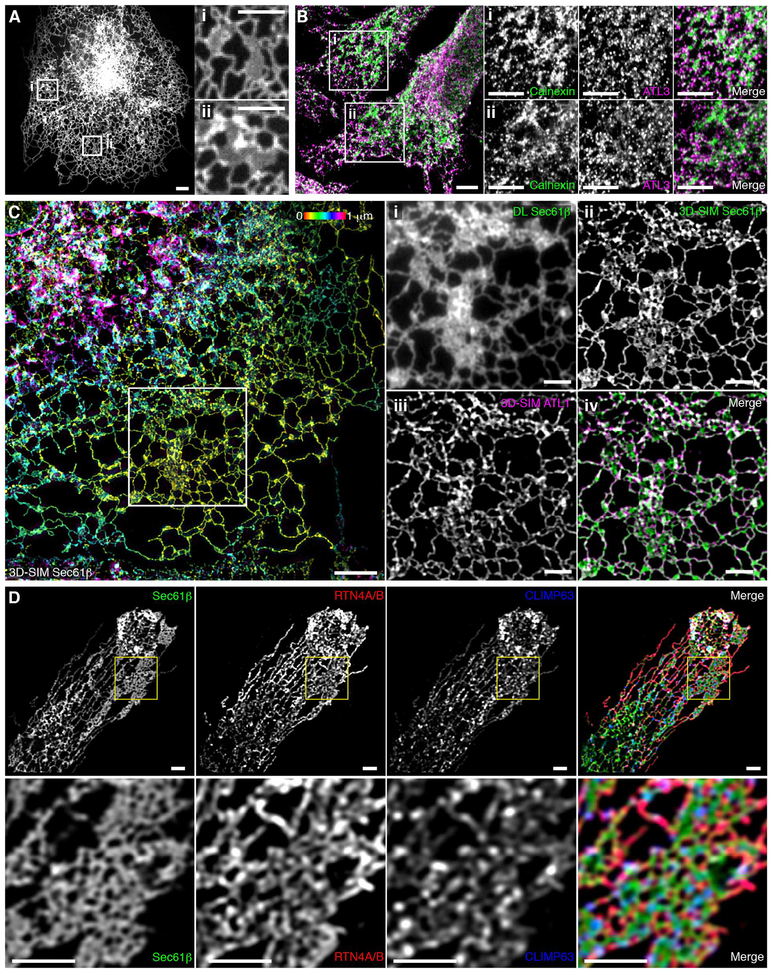
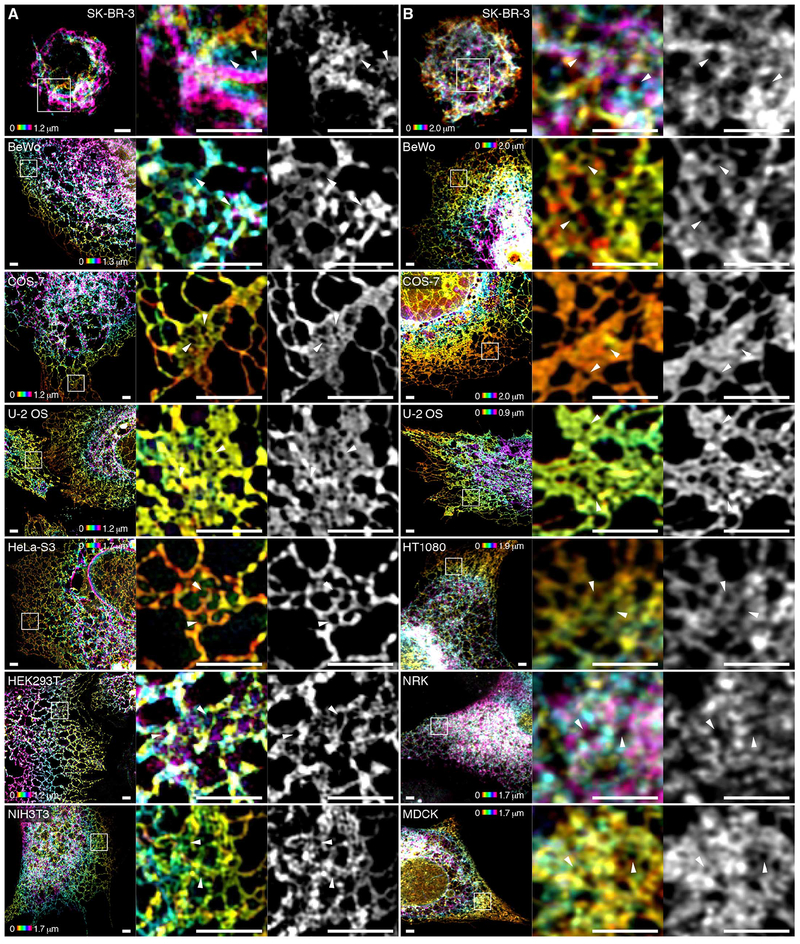
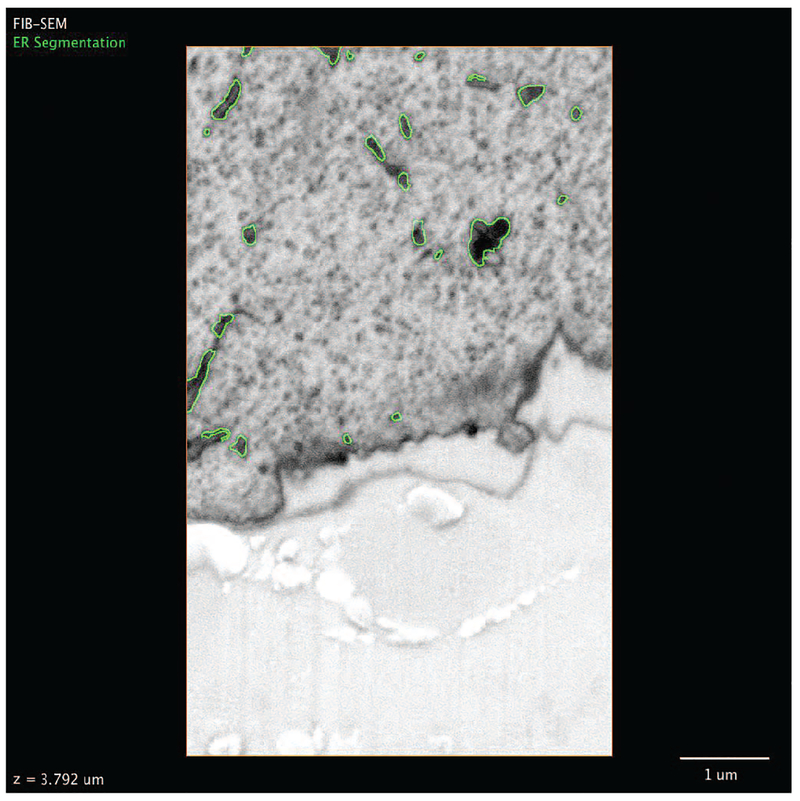
The endoplasmic reticulum (ER) is an expansive, membrane-enclosed organelle that plays crucial roles in numerous cellular functions. We used emerging superresolution imaging technologies to clarify the morphology and dynamics of the peripheral ER, which contacts and modulates most other intracellular organelles. Peripheral components of the ER have classically been described as comprising both tubules and flat sheets. We show that this system consists almost exclusively of tubules at varying densities, including structures that we term ER matrices. Conventional optical imaging technologies had led to misidentification of these structures as sheets because of the dense clustering of tubular junctions and a previously uncharacterized rapid form of ER motion. The existence of ER matrices explains previous confounding evidence that had indicated the occurrence of ER "sheet" proliferation after overexpression of tubular junction-forming proteins.


Figures

Fig. 1.
Fig. 1.. The peripheral ER moves at high speeds.
(A) Tubular ER in the periphery of a COS-7 cell expressing Sec61β imaged live at 40 Hz using GI-SIM microscopy. Scale bar, 2 mm. (B) ER tubules within the boxed region in (A), identified using a skeletonization algorithm. Left: The midline of each tubule (green) is mapped onto the fluorescence (magenta). Right: Positions of the midlines are plotted as kymographs against time for each of the three locations shown in cyan at left; scale bars, 200 nm and 0.5 s. (C and D) Amplitudes (C) and frequencies (D) of tubular ER oscillations in COS-7 cells expressing Sec61β treated with deoxyglucose plus sodium azide (DOG + NaN3), AlF, nocodazole (NZ), blebbistatin (Bleb), puromycin (Puro), and cycloheximide (CHX). Untreated controls using a luminal ER marker (ER3) and results for a different cell line (U-2 OS–Sec61β) are also shown. (E) Plot of frequency versus amplitude for tubular oscillations in treated and untreated cells. Error bars represent SEM. (F) Locations of three-way junctions derived from skeletonized data (white). Original fluorescence is shown in magenta; example tracks of junctions (cyan) over 2.5 s are indicated in green. Scale bar, 2 mm. (G) MSD scaling exponent (α values) for treated and control cells. Box plots indicate the mean and SD in (C), (D), and (G); range is indicated by outer tick marks. See tables S1 and S2 for a detailed list of means and test statistics.
Fig. 2.
Fig. 2.. Peripheral ER “sheets” are highly dynamic and riddled with spaces.
(A) COS-7 cell expressing Sec61β imaged live by GI at 40 Hz exhibits many peripheral sheet-like structures. (B) GI-SIM of the boxed region in (A) shows many discrete spaces throughout the structure. Colored lines at left correspond to the locations of the kymographs shown at right. Voids in intensity within the structure can be seen appearing and disappearing over time. (C) Single-particle tracking (SPT) of dark spaces within the structure. The fluorescence image (i) was inverted and spaces were tracked using SPT algorithms. Tracks overlaid onto the inverted image are shown in (ii), with trajectories shown in different colors. (D) Each track length corresponds to the lifetime of the space; distance across the space (i.e., distance between tubules) is also quantified. The box plot indicates the SD and mean; range is indicated by outer tick marks. The asterisks denote significant difference between means, detailed in table S4. (E and F) Temporal intensity derivative analysis (see materials and methods) of representative peripheral sheet-like structures in a COS-7 cell expressing Sec61β, with a luminal ER marker (ER3) and another cell line (U-2 OS–Sec61β) as controls. (E) Original fluorescence images. (F) Each consecutive frame over a 250-ms time period is color-coded, with intensity corresponding to the magnitude of fluorescence change. Scale bars, 2 μm. See tables S3 and S4 for a detailed list of means and test statistics.
Fig. 3.
Fig. 3.. Many peripheral structures classically identified as sheets are instead dense matrices of tubules.
(A) Left: Fixed COS-7 cell expressing Sec61β, imaged by 3D-SIM and color-coded by z position. Scale bar, 10 μm. Right: Magnified regions (i to iii) show that 3D-SIM reveals dense tubular matrices, which appear as sheets by diffraction-limited (DL) epifluorescence. Scale bars, 2 mm. (B) Left: Deconvolved, diffraction-limited LLS imaging of a fixed COS-7 cell overexpressing Sec61β (gray). All internal lipid membranes were reconstructed using LLS-PAINT microscopy. Data from three regions containing ER matrices are shown in colored insets. Scale bar, 10 μm. Right: The three boxed regions are enlarged, showing (i) 3D orientation of LLS-PAINT volume rendering, (ii) overlay of LLS-PAINT and diffraction-limited LLS imaging volume rendering (gray), and (iii) LLS-PAINT color-coded by z position. White arrowheads mark areas that appear as sheets by diffraction-limited imaging; the red arrowhead [top of (ii)] denotes a mitochondrion. Scale bars, 2 μm.
Fig. 4.
Fig. 4.. Effects of spatiotemporal blurring on imaging ER tubular matrices.
(A) A COS-7 cell expressing Sec61β, imaged live using GI-SIM, showing both single 25-ms frames (i, iii) and 40 frames averaged over 1 s (ii, iv). The top row shows the GI-SIM images; the bottom row shows the corresponding diffraction-limited images with GI illumination, demonstrating the combined effects of spatial and temporal limitations in resolution. (B and C) The measurable diameter of isolated ER tubules found outside of matrices also decreases with increasing temporal (B) and spatial (C) resolution. (D) Structure of a representative tubular ER matrix imaged in a live cell by GI-SIM when integrating image frames for (i) 25 ms (1 frame), (ii) 250 ms (10 frames), or (iii) 1 s (40 frames) as in (A). (E and F) Quantification of the measurable distance between tubules (E) and density of these spaces (F) within tubular matrices for each functional exposure time. (G) Representative images of tubular matrices imaged in fixed cells by diffraction-limited GI (i), 3D-SIM (ii), and LLS-PAINT (iii). (H and I) Quantification of the measurable distance between tubules (H) and density of these spaces (I) in tubular matrices, as identified by imaging modalities of increasing spatial resolution. Scale bars, 2 μm. Box plots indicate the mean and SD in all panels; range is indicated by outer tick marks. The asterisks denote statistical significance between the means, as detailed in tables S5 and S6.
Fig. 5.
Fig. 5.. ER tubules form highly convoluted and intricate structures within the resolvable volume limits of any optical imaging technique.
(A) Three consecutive FIB-SEM slices through an ER matrix spaced by 8 nm. Scale bar, 1 mm. (B) Three-dimensional reconstruction of a tubular matrix in a thin section (~600 to 1200 nm between the plasma membranes) of the cell. (i) The footprint shows the theoretically highest resolution that could be achieved with a single confocal slice through the structure directly shown above. Scale bar, 1 mm in each direction. (ii) Close-up of the reconstruction of the boxed region in (i). (C) 3D rendering of raw EM data showing an example of an approximately planar ER matrix with subresolution spaces (large scale bar, 500 nm; small scale bar, 50 nm). (D) 3D rendering of the ER at the border of perinuclear and peripheral regions of the cell, showing stacked helicoidal sheets (cyan box) and ER matrices (yellow box). (E) A theoretical confocal image of the structure, showing the difficulty in distinguishing these structures by diffraction-limited imaging. (F) Views from the side of a stacked helicoidal sheet in the perinuclear region of the ER [from cyan box in (D)], showing the pitch of the intact membranes.
Fig. 6.
Fig. 6.. Localization of ER-shaping proteins within dense tubular matrices.
(A) COS-7 cell expressing low levels of HaloTag-ATL1 imaged live with conventional spinning disk microscopy. Boxed regions (i) and (ii) demonstrate ATL1 localization throughout structures that appear to be peripheral sheets by spatiotemporally limited imaging techniques. (B) Left: A fixed HeLa cell acquired with conventional scanning point confocal microscopy, stained for the endogenous ER marker calnexin and endogenous ATL3 (merged image); boxed regions (i) and (ii) show endogenous ATL3 localization to structures that appear as sheets. Right: Regions shown in (i) and (ii) were stained for the endogenous ER marker calnexin and endogenous ATL3. (C) A fixed COS-7 cell expressing Sec61β and HaloTag-ATL1 imaged by wide-field SIM. Sec61β fluorescence is color-coded by z position. Boxed region is enlarged in panels at right. Structures that appear as sheets by diffraction-limited imaging (i) are revealed to be dense tubular matrices (ii) that are positive for ATL1 (iii); the merged image of (ii) and (iii) is shown in (iv). (D) U-2 OS cell expressing Sec61β stained for endogenous RTN4A/B and CLIMP63 with the boxed region magnified (bottom row), illustrating localizations of both proteins within a tubular matrix. Merged images are at the far right. Scale bars, 2 μm.
Fig. 7.
Fig. 7.. Tubular ER matrices are present in different cell types.
(A and B) Various cell lines expressing Sec61β were imaged using 3D-SIM (A) or, where fluorescence intensity was insufficient, Airyscan (B).The first four cell lines were imaged using both modalities, demonstrating that the dense matrix structures are not artifacts of any given imaging modality. Boxed regions highlighting representative tubular ER matrices in each cell type are magnified at the right. White arrowheads indicate subdiffraction-limited spaces between tubules. Scale bars, 2 μm. The signal of Sec61β fluorescence is color-coded by z position in the left and center panels corresponding to each cell line and technique.
Movie 1.
Movie 1.. Three-dimensional reconstruction of FIB-SEM data reveals a convoluted ER matrix.
Raw 2D FIB-SEM data of ER tubules are shown in a series of sequential planes. The ER is segmented in green; the 3D reconstruction is shown, revealing an ER matrix. When confocal resolution is simulated, the convoluted nature of the structure is masked.

Comment in

References

    1. Shemesh T et al., A model for the generation and interconversion of ER morphologies. Proc. Natl. Acad. Sci. U.S.A. 111, E5243–E5251 (2014). doi: 10.1073/pnas.1419997111 - DOI - PMC - PubMed
    1. Shibata Y et al., Mechanisms determining the morphology of the peripheral ER. Cell 143, 774–788 (2010). doi: 10.1016/j.cell.2010.11.007 - DOI - PMC - PubMed
    1. Goyal U, Blackstone C, Untangling the web: Mechanisms underlying ER network formation. Biochim. Biophys. Acta 1833, 2492–2498 (2013). doi: 10.1016/j.bbamcr.2013.04.009 - DOI - PMC - PubMed
    1. Blackstone C, Cellular pathways of hereditary spastic paraplegia. Annu. Rev. Neurosci 35, 25–47 (2012). doi: 10.1146/annurev-neuro-062111-150400 - DOI - PMC - PubMed
    1. Lee C, Chen LB, Dynamic behavior of endoplasmic reticulum in living cells. Cell 54, 37–46 (1988). doi: 10.1016/0092-8674(88)90177-8 - DOI - PubMed

Publication types

MeSH terms