. 2016 Jun 14;26(22):3818-3836.
doi: 10.1002/adfm.201504185. Epub 2016 Feb 5.

Magnetic Nanoparticle Facilitated Drug Delivery for Cancer Therapy with Targeted and Image-Guided Approaches

Affiliations

Magnetic Nanoparticle Facilitated Drug Delivery for Cancer Therapy with Targeted and Image-Guided Approaches

Jing Huang et al. Adv Funct Mater. .

Abstract

With rapid advances in nanomedicine, magnetic nanoparticles (MNPs) have emerged as a promising theranostic tool in biomedical applications, including diagnostic imaging, drug delivery and novel therapeutics. Significant preclinical and clinical research has explored their functionalization, targeted delivery, controllable drug release and image-guided capabilities. To further develop MNPs for theranostic applications and clinical translation in the future, we attempt to provide an overview of the recent advances in the development and application of MNPs for drug delivery, specifically focusing on the topics concerning the importance of biomarker targeting for personalized therapy and the unique magnetic and contrast-enhancing properties of theranostic MNPs that enable image-guided delivery. The common strategies and considerations to produce theranostic MNPs and incorporate payload drugs into MNP carriers are described. The notable examples are presented to demonstrate the advantages of MNPs in specific targeting and delivering under image guidance. Furthermore, current understanding of delivery mechanisms and challenges to achieve efficient therapeutic efficacy or diagnostic capability using MNP-based nanomedicine are discussed.


Figures

Figure 1
Figure 1
Properties of MNPs for the development of drug delivery systems, including simple and robust preparation methods, good biocompatibility, facile functionalization through reactive functional groups on surface, and responsiveness to exogenous energy or specific physiological conditions.
Figure 2
Figure 2
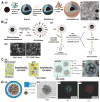
Illustration of the methods used for loading drugs into MNP nanocarriers, including loading through hydrophobic interactions, electrostatic interactions, covalent bonding and direct encapsulation.
Figure 3
Figure 3
MNP carriers developed with different drug loading methods. A) Loading through hydrophobic interactions. a) Illustration of drug (Dox) loaded into the hydrophobic layer of a bi-block polymer and wrapped with milk casein protein (CN-DOX-IO); b) Typical TEM images for obtained CN-DOX-IO. Reproduced with permission.[25] Copyright 2015, Elsevier. B) Loading through covalent bonding. a) Diagram of the conjugation of ATF peptides and GFLG-Gem conjugates to IONPs; b) Typical TEM images for non-targeted IONP-Gem and targeted ATF-IONP-Gem with negative staining; c) Schematic diagram of gemcitabine release from ATF-IONP-Gem by enzyme cleavage. Reproduced with permission.[31] Copyright 2014, American Chemical Society. C) Loading through electrostatic interactions. a) Schematic illustration for preparing lipo-polymersome (LPP) nanocarriers with three-compartment structures: 1) a cationic lipids/pDNA core, 2) an IO nanoparticles–polymer composite interlayer, and 3) a relatively neutral lipids shell; b) Typical TEM images of as-prepared LLP nanocarriers. Reproduced with permission.[35] D) Loading by direct encapsulation. a) Schematic of gold- and IONP-loaded polymeric micelles (GSMs). Gold and IONP are self-assembled into the hydrophobic core of micelles, stabilized with the amphiphilic di-block co-polymer PEG-b-PCL; b) TEM image of a single GSM. (all scale bars = 100 nm); c–d) Energy dispersive X-ray spectroscopy analysis on GSM with Au and Fe signals, respectively. Reproduced with permission.[46]
Figure 4
Figure 4
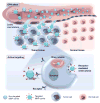
Illustration of the mechanism of MNP-based drug delivery systems. Taking tumor as an example, MNP-based drug carriers may reach the tumor tissue via the EPR effect due to leaky vasculature, and facilitate active targeting to tumor cells through the conjugated targeting ligands interacting with cellular receptors.
Figure 5
Figure 5
Targeted MNP carriers for pancreatic cancer treatment. A) Schematic illustration for conjugation of NIR830-IGF1 to amphiphilic polymer-coated IONPs and encapsulation of Dox to MNPs. B) The level of IGF1R in MIAPaCa-2 cells was examined by immunofluorescence labeling using an anti-IGF1R antibody (red), and Prussian blue staining of cells incubated with IONPs, BSA-IONPs, and IGF1-IONPs at 20 μg/mL of iron equivalent dose for 4 h. Scale bars are 100 um. C) Pre and post 24 h T2-weighted MR images. Numbers shown are relative mean MRI signal intensities of the entire tumor. Bar figure shows quantification of MRI signals in the tumors prior to and 24 h after administration of different IONPs. *p < 0.0001. Pink arrows indicate the location of pancreatic PDX-tumor lesions. Reproduced with permission.[22] Copyright 2015, American Chemical Society.
Figure 6
Figure 6
Enhancing therapeutic effect by tuning the size and charge of MNP carriers through pH-sensitive polymer coating. A) Schematic representation of pH-sensitive magnetic nanogrenades (PMNs) composed of pH-responsive coating, photo-sensitizer and extremely small 3 nm IONPs (ESIONs). B) pH-dependent structural transformation and related magnetic/photoactivity change in PMNs. C) In vivo T1-weighted MR images and color-mapped images of tumor sites before and 1 or 2 h after intravenous injection of PMNs or pH-insensitive nanoparticle assemblies (InS-NPs) into nude mice bearing HCT116 tumors. D) Plot of signal intensity enhancement (ROI) versus time after injection of PMNs and InS-NPs. E) Blood circulation data (plasma iron concentration vs time) for PMNs and InS-NPs in nude mice (n = 3). F) Inductively coupled plasma atomic emission spectroscopy (ICP-AES) analysis of tumor tissue shows >2-fold increase of PMNs than InS-NPs in HCT116 tumors at 12 h after intravenous injection. Reproduced with permission.[106] Copyright 2014, American Chemical Society.
Figure 7
Figure 7
Visualizing drug delivery in vivo with MNP carriers in an orthotopic human pancreatic cancer xenograft model. A) Comparison of short TE (TE = 11 ms) and long TE T2-weighted spin echo (TE = 60 ms) and ultrashort TE (TE = 0.07 ms) MR images from a mouse treated with ATF-IONP-Gem. Both primary (pointed out by yellow arrows) and secondary (pointed out by blue arrows) were visualized obviously by using the UTE imaging. Reproduced with permission.[31] Copyright 2013, American Chemical Society. B) Combination nanoablation and nanoembolization versus nanoembolization alone in VX2 rabbit liver cancer model on 7T MRI. Representative axial T2*W GRE images (TE: 11.9 ms) with corresponding R2* parametric maps from the same animal. Combination therapy resulted in significant signal change within tumor core and periphery, as depicted in red. Right panel is biodistribution of DOX-SPIOs in tumor and liver tissue following combination therapy (nanoembolization followed by nanoablation) in VX2 rabbit model. (p < 0.05). Reproduced with permission.[128] Copyright 2013, American Chemical Society.
Figure 8
Figure 8
Monitoring drug delivery with MNP carriers, composed of a nanoplex of PEI/siRNA-chk/PLL-DOTA-Gd/Cy5.5/bCD-111, in a breast cancer xenograft model. A) Representative in vivo T1-weighted MR images and quantitative T1 maps of a tumor pre- and post-injection of MNP carriers, showing the distribution of MNP carriers in periphery area of the tumor at 60 min after injection, and in the central region of the tumor after 24 h and 48 h. B) Time-dependent mean T1 values of tumors (n = 4) pre- and post-injection of nanoplex; a significant decrease of T1 (P < 0.0023) was observed up to 48 h. C) In vivo 19F MRS demonstrated efficient conversion of prodrug 5-FC to 5-FU and its metabolites F-Nucl by nanoplex localized in the tumor. 5-FC was injected at 24 h after nanoplex injection. D) Representative in vivo tCho maps and color-coded tCho intensity maps overlaid on corresponding T1-weighted images of a tumor before and at 24 and 48 h after nanoplex injection, displaying spatial siRNA-mediated downregulation of Chk-α. Reproduced with permission.[130] Copyright 2010, American Chemical Society.
Figure 9
Figure 9
Combination chemotherapy and hyperthermia with MNP carriers. A) Illustration of MNP carriers that produce heat in response to AMF and sequentially release Dox. B) Illustration of cancer treatment with the combination of magnetic hyperthermia and chemotherapy using the smart NPs. Change of C) tumor volume, D) survival rate, and E) body weight: non-treated mice (black), mice treated with chemotherapy (yellow), mice exposed to AMF (green), mice injected with Fe3O4/Dox/PPy-PEG-FA NPs intratumorally (purple), mice treated with magnetic hyperthermia (blue), and mice treated with the combination of magnetic hyperthermia and chemotherapy (red). F) Photographs of non-treated mice, mice treated with chemotherapy, mice exposed to AMF, mice injected with Fe3O4/Dox/PPy-PEG-FA NPs intratumorally, mice treated with magnetic hyperthermia, and mice treated with the combination of magnetic hyperthermia and chemotherapy 45 days after treatment. Reproduced with permission.[28] Copyright 2015, Ivyspring International Publisher.

References

    1. Dobson J. Drug Dev Res. 2006;67:55.
    2. Sun C, Lee JSH, Zhang M. Adv Drug Delivery Rev. 2008;60:1252. - PMC - PubMed
    1. Veiseh O, Gunn JW, Zhang M. Adv Drug Delivery Rev. 2010;62:284. - PMC - PubMed
    1. Green MR. Ann Oncol. 2006;17:1263. - PubMed
    1. Barenholz Y. J Controlled Release. 2012;160:117. - PubMed
    1. Longmire M, Choyke PL, Kobayashi H. Nanomedicine. 2008;3:703. - PMC - PubMed