. 2016 Oct 18:2:16037.
doi: 10.1038/celldisc.2016.37. eCollection 2016.

Canonical Wnt signalling regulates nuclear export of Setdb1 during skeletal muscle terminal differentiation

Affiliations

Canonical Wnt signalling regulates nuclear export of Setdb1 during skeletal muscle terminal differentiation

Sophie Beyer et al. Cell Discov. .

Erratum in

Abstract

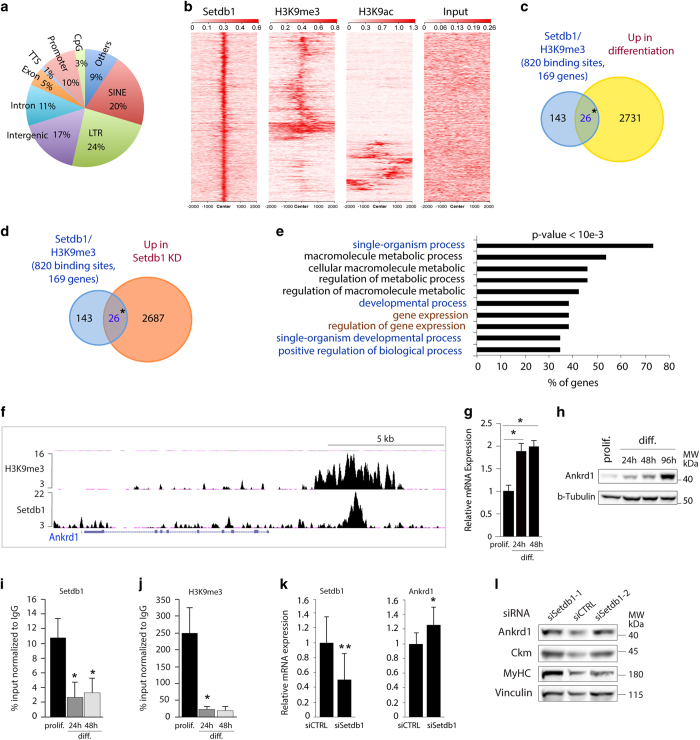
The histone 3 lysine 9 methyltransferase Setdb1 is essential for both stem cell pluripotency and terminal differentiation of different cell types. To shed light on the roles of Setdb1 in these mutually exclusive processes, we used mouse skeletal myoblasts as a model of terminal differentiation. Ex vivo studies on isolated single myofibres showed that Setdb1 is required for adult muscle stem cells expansion following activation. In vitro studies in skeletal myoblasts confirmed that Setdb1 suppresses terminal differentiation. Genomic binding analyses showed a release of Setdb1 from selected target genes upon myoblast terminal differentiation, concomitant to a nuclear export of Setdb1 to the cytoplasm. Both genomic release and cytoplasmic Setdb1 relocalisation during differentiation were dependent on canonical Wnt signalling. Transcriptomic assays in myoblasts unravelled a significant overlap between Setdb1 and Wnt3a regulated genetic programmes. Together, our findings revealed Wnt-dependent subcellular relocalisation of Setdb1 as a novel mechanism regulating Setdb1 functions and myogenesis.

Keywords: SETDB1/ESET/KMT1E; Wnt signalling; differentiation; lysine; methyltransferase; muscle.


Figures

Figure 1
Figure 1
Setdb1 is required for accurate adult skeletal muscle stem cell amplification and negatively regulates terminal differentiation. (a) Setdb1 increases during muscle satellite cells (MuSCs) activation. Single myofibres were isolated from extensor digitorum longus (EDL) muscles of C57BL/6N mice. Myofibres were directly fixed after isolation (upper, T=0 h) or cultured in floating conditions for 24 h (lower, T=24 h). Setdb1 (red) and Pax7 (green) proteins were revealed by indirect immunofluorescence (IF). DNA was labelled with Hoechst (blue). A representative picture of an MuSC is shown. Scale bar=5 μm. (b) Setdb1 knockdown in MuSCs. Freshly isolated EDL mouse single myofibres were transfected with control (siCTRL) or Setdb1 siRNA (siSetdb1) 2 h after isolation and cultured for 48 h post-transfection. IF in MuSCs was done as in (a). Scale bar=10 μm. (c) Setdb1 knockdown reduces MuSCs amplification. Quantification of MuSCs progeny (Myogenin+ or Pax7+) on cultured myofibres transfected with control (siCTRL) or Setdb1 siRNA (siSetdb1) 72 h after transfection. (d) Setdb1 knockdown decreases MuSCs self-renewal. Myofibres were transfected as described in (b). Quantification (in %) of MuSC descendants at the surface of cultured myofibres 72 h post-transfection. The proportion of committed cells (Pax7/MyoD+), proliferating cells (Pax7+/MyoD+) and self-renewing cells (Pax7+/MyoD) in myofibres transfected with control (siCTRL) or Setdb1 siRNA (siSetdb1) is presented. (e) Setdb1 limits MuSCs differentiation. EDL single myofibres were cultured for 72 h following transfection with control (siCTRL) or Setdb1 siRNA (siSetdb1). For detection of proliferating and differentiating MuSCs indirect IF was performed to detect Pax7 (green) and Myogenin (red), respectively. DNA was labelled with Hoechst (blue). Representative myogenic cell clusters are shown. Scale bar=20 μm. See Supplementary Figure S1A for images with lower magnification. (f) Setdb1 knockdown increases the proportion of differentiating MuSCs. % of Myogenin+ MuSCs in myofibres transfected with control (siCTRL) or Setdb1 siRNA (siSetdb1) as described in (d). (g) Setdb1 protein levels decrease during terminal differentiation of C2C12 myoblasts. Western blot (WB) analysis of Setdb1, Myosin Heavy Chain (MyHC), Creatine Kinase Muscle (Ckm) and Myogenin in whole-cell extracts from proliferating C2C12 myoblasts (prolif.) and after 24, 48 and 96 h of differentiation (diff.). Vinculin served as a loading control for Setdb1 and Myogenin and α-Tubulin for Ckm and MyHC. A typical experiment in shown. * Shifted Setdb1 signals. Images are representative of a minimum of three independent experiments. For Setdb1 signal quantification see Supplementary Figure S1D. (h) Setdb1 knockdown promotes differentiation and fusion of myotubes. Proliferating C2C12 myoblasts, at 80–90% confluence, were transfected with control (siCTRL) or Setdb1 (siSetdb1) siRNA and simultaneously switched to differentiation media for 72 h. Cellular Ckm was revealed by indirect IF (green) and DNA with DAPI (red). Images are representative of a minimum of three independent experiments. Relative fusion index (number of nuclei in myotubes divided by total number of nuclei) is indicated (in blue) for each condition. A minimum of 300 nuclei was counted. Data are presented as mean±s.e.m. of three independent experiments. P-values are indicated. Scale bar=20 μm. See Supplementary Figure S1A for additional images. (i) Setdb1 knockdown increases Ckm mRNA levels. C2C12 cells were transfected with control (siCTRL) or Setdb1 siRNA (siSetdb1) and differentiated as described in (h). Relative mRNA expression of Setdb1 and Ckm were represented as fold change relative to siCTRL and normalised to Cyclophilin A (CycloA) and TATA-box-binding protein (TBP). Data are presented as mean±s.e.m. of three independent experiments. For significance Student paired t-test was applied. *P-values <0.05 and are considered significant. **P-values <0.01. For (a, b, e): all images are representative of a minimum of three independent experiments using three different mice. For (c,d, f): data are presented as mean±s.e.m. of three independent experiments using three different mice. For each mouse at least 30 fibres were counted. For significance Student paired t-test was applied. *P-values <0.05 and are considered significant. See also Supplementary Figure S1.
Figure 2
Figure 2
Identification of new Setdb1 target genes, such as Ankrd1, in proliferating C2C12 myoblasts. (a) Genomic distribution of Setdb1 binding in proliferating C2C12 myoblasts. Enrichments were analysed by ChIP-seq. We performed two independent Setdb1 ChIP-seq experiments (see also Figure 6a) with a Pearson correlation value of 0.7 (not shown). We thus used the most enriched ChIP-seq for peak calling and Genomic. See Supplementary Figure S2A for fold enrichments. (b) Heatmap presentation of Setdb1-binding sites (±2 kb from the peak summit) enriched for either H3K9me3 or H3K9ac. Setdb1 and H3K9me3 ChIP-seq were performed in proliferating C2C12 myoblasts. We used MACS software for Setdb1 ChIP-seq analysis and combined MACS and SICER for H3K9me3 ChIP-seq. H3K9ac ChIP-seq was from Asp et al. [44] Red intensity corresponds to enrichments, which were subjected to hierarchical clustering. (c) Venn Diagram showing the overlap between Setdb1/H3K9me3-enriched genes with upregulated genes in differentiated myotubes. ChIP-seq of Setdb1 and H3K9me3 were performed in proliferating C2C12 myoblasts. Genome-wide data of Setdb1 and H3K9me3-positive genes (±10 kb from TSS) (blue) were crossed with upregulated genes in differentiating myotubes (yellow), from Blais et al. [40] For significance Student’s paired t-test was applied. *P-values <0.05. (d) Venn diagram showing the overlap between Setdb1/H3K9me3-enriched genes with upregulated genes upon Setdb1 knockdown in proliferating myoblasts (Abca7, Ankrd1, Atxn10, Atxn7l3b, Cd97, Cnn2, Copb1, Fn1, Fstl3, Gnas, Gtf2a1, Hspa2, Irf2, Orai2, Plaur, Prdx1, Prkab2, Ptprs, Rnf215, Srp14, Tmbim6, Tmeff1, Trim24, Tsc22d1, Zfp110, 6430531B16Rik). Genome-wide data of Setdb1 and H3K9me3-positive genes (±10 kb from TSS) (blue) were crossed with upregulated genes after Setdb1 acute knockdown (siSetdb1) in proliferating C2C12 myoblasts (orange) we measured by RNA-seq. For significance Student’s paired t-test was applied. *P-values <0.05. (e) Gene Ontology (GO) analysis of 26 genes enriched for Setdb1 and H3K9me3 and upregulated after Setdb1 knockdown in proliferating C2C12 myoblasts (from d). Preesented are the top 10 biological functions with a P-value <10e−3. Fisher's exact test was performed to proof significance. (f) Genome Browser presentation of Setdb1- and H3K9me3-binding profiles, analysed by ChIP-seq, at the Ankrd1 gene in proliferating C2C12 myoblasts. (g) Ankrd1 mRNA levels increase during differentiation in primary myoblasts. Cells were proliferating (prolif.) or differentiated (diff.) for the indicated time (24 or 48 h). Data are represented as fold change relative to proliferation and normalised to CycloA and TBP mRNA. (h) Ankrd1 protein expression increases during C2C12 myoblasts differentiation. Whole-cell extracts from proliferating C2C12 myoblasts (prolif.) or differentiated for the indicated time (24, 48, 72 or 96 h) were analysed by WB. α-Tubulin; loading control. (i) Setdb1 and (j) H3K9me3 enrichment at the Ankrd1 enhancer decrease during differentiation in C2C12 myoblasts. ChIP-qPCR results are presented as immunoprecipitated DNA compared with input DNA (% input). Owing to different properties of chromatin compaction during proliferation and differentiation, we normalised specific enrichments (% input) of Setdb1 and H3K9me3 to the corresponding IgGs, which served as a negative control. In addition, according to both our ChIP-Seq data and published ones, we used COPB1 gene promoter at which Setdb1 binding is constant between proliferating and differentiating; Nnat as a positive target and Ankrd1 regions outside the Setdb1 binding peak as a negative control (not shown). For data presentation as only % input see Supplementary Figure S3D. (k) Setdb1 knockdown in differentiating myoblasts increases Ankrd1 mRNA level. Proliferating C2C12 myoblasts were transfected, at 80–90% confluence, with control siRNA (siCTRL) or Setdb1 siRNA (siSetdb1) and simultaneously switched to differentiation media for 72 h. Relative mRNA expression levels of Setdb1 and Ankrd1 were measured. Data are represented as fold change relative to siCTRL and normalised to CycloA and TBP mRNA. (l) Setdb1 knockdown decreases Ankrd1 protein level in differentiating C2C12 myoblasts. Cells were treated as described in (k). Two specific Setdb1 siRNA were used (siSetdb1-1; siSetdb1-2) for validation. WB analysis of Setdb1, Ankrd1, Ckm and MyHC were performed in whole-cell extracts. Vinculin served as a loading control. For (g, ik): Presented data are mean±s.e.m. of a minimum of three independent experiments. For significance Student’s paired t-test was applied. *P-values <0.05 and are considered significant. P-values <0.01 are marked as **For (h, l): Images are a representative of a minimum of three different experiments. See also Supplementary Figures S2 and S3.
Figure 3
Figure 3
The newly identified Setdb1 target Ankrd1 is crucial for myoblast terminal differentiation. (a) Downregulation of Ankrd1 increases MuSC amplification in single myofibres. Control siRNA (siCTRL) or Ankrd1 siRNA (siAnkrd1) were transfected directly after isolation and cultured in suspension for 72 h. Indirect IF was conducted to visualise Pax7 (green) and Myogenin (red) in MuSCs. DNA was detected with Hoechst (blue). Scale bar=5 μm. (b) Quantification of MuSCs progeny (Pax7+ or Myogenin+) in myofibres transfected with control siRNA (siCTRL) or Ankrd1 siRNA (siAnkrd1). (c) Quantification of differentiating MuSCs (Myogenin+) in myofibres transfected with control siRNA (siCTRL) or Ankrd1 siRNA (siAnkrd1). (d) Ankrd1 knockdown impairs myotube formation. Proliferating C2C12 myoblasts, at 80–90% confluence, were transfected with control siRNA (siCTRL) or Ankrd1 siRNA (siAnkrd1) and simultaneously switched to differentiation media for 72 h post-transfection. Cellular Ckm was stained by indirect IF (green). DNA was co-stained with DAPI (red). Scale bar=20 μm. Fusion index (number of nuclei in myotubes divided by total number of nuclei) is indicated (in blue) for each condition. A minimum of 300 nuclei was counted. Data are presented as mean±s.e.m. of three independent experiments. P-values are indicated. (e) Ankrd1 downregulation reduces Ckm mRNA levels. Proliferating C2C12 myoblasts were transfected and cultured as described in (d). Relative mRNA expression levels of Ankrd1 and Ckm were evaluated by qPCR. Data are represented as fold change relative to siCTRL and normalised to CycloA and TBP. (f) Proliferating C2C12 myoblasts were transfected and differentiated as described in (d). Apoptotic cells were stained by performing the TdT-mediated dUTP-biotin nick-end labelling (TUNEL) reaction. Cells containing a signal inside the nucleus were considered as apoptotic. A minimum of 400 cells was counted. For (a, d): Images are representative of at least three independent experiments. For (b, c): Presented data are mean±s.e.m. of four independent experiments using four different mice. For each experiment at least 25 fibres were evaluated. For significance Student’s paired t-test was applied. *P-values <0.05 are considered significant. For (e, f): Presented data are mean±s.e.m. of a minimum of three independent experiments. For significance Student’s paired t-test was applied. *P-values <0.05 are considered significant.
Figure 4
Figure 4
Setdb1 subcellular localisation changes upon terminal muscle differentiation and is dependent on Exportin-1. (a) Setdb1 localisation changes in C2C12 myoblasts during differentiation. Cells were proliferating (prolif.) or differentiating for 24 h (24 h diff.). Cellular Setdb1 (green) was detected by indirect IF. Cells were DAPI-stained to reveal DNA (red) prior to confocal fluorescent microscopy analyses. Scale bar=10 μm. (b) Quantification of Setdb1 localisation in proliferating (prolif.) and differentiating (24 h diff.) C2C12 myoblasts. Setdb1 localisation was classified as nuclear (N), homogeneous (H), or cytoplasmic (C). A minimum of 100 cells was counted for each condition. (c) Setdb1 delocalisation in differentiating C2C12 myoblasts is restricted by blocking nuclear export. Indirect IF of Setdb1 (green) and confocal microscopy were performed as described in (a). C2C12 myoblasts were differentiated for 24 h and non-treated (24 h diff.) or incubated in parallel with LMB for the last 18 h (24 h diff.+LMB). Scale bar=10 μm. (d) Quantification of Setdb1 localisation in C2C12 myoblasts differentiated for 24 h and non-treated (24 h diff.) or incubated in parallel with LMB for the last 18 h (24 h diff.+LMB). Setdb1 localisation was classified as described for (b). A minimum of 100 cells was counted for each condition. For (a, c): Images are representative of a minimum of three independent experiments. For (b, d): Data are presented as mean±s.e.m. of a minimum of three independent experiments. See also Supplementary Figure S4.
Figure 5
Figure 5
Setdb1 cellular relocalisation upon terminal differentiation is dependent on Wnt3a signalling. (a) Setdb1 localisation changes in C2C12 myoblasts with increased Wnt3a signalling. Indirect IF and confocal microscopy of Setdb1 (green) was conducted in proliferating C2C12 myoblasts (prolif.) and stimulated with Wnt3a protein for 24 h (prolif.+Wnt3a). DNA was stained with DAPI (red). Scale bar=10 μm. (b) Quantification of a minimum of 100 cells described in (a) according to their phenotype. Setdb1 localisation is cytoplasmic (C), homogeneous (H) or mainly nuclear (N). (c) Setdb1 delocalisation is restricted in differentiating C2C12 myoblasts when Wnt signalling is inhibited. Indirect IF of Setdb1 as explained in (a). C2C12 myoblasts were differentiating for 24 h (24 h diff.) and treated with IWP2 (24 h diff.+IWP2), an inhibitor of Wnt production, in parallel for the same period of time. (d) Quantification of a minimum of 100 cells described in (c) according to their phenotype. Setdb1 localisation is cytoplasmic (C), homogeneous (H) or mainly nuclear (N). (e) Wnt3a signalling is sufficient for Setdb1 delocalisation in C2C12 myoblasts. Left panels: Proliferating cells, at 80–90% confluence, were transfected with control siRNA (siCTRL) or Myogenin siRNA (siMyog) and simultaneously switched to differentiation media for 24 h. Additionally, cells were treated with Wnt3a. Indirect IF was performed, as described in (a). Scale bar=2 μm. Right panel: knockdown efficiency of Myogenin was analysed in parallel in whole-cell extracts by WB. α-Tubulin, loading control. (f) Wnt3a signalling is sufficient for Setdb1 delocalisation in primary myoblasts. Proliferating cells were transfected with control (siCTRL) or Myogenin siRNA (siMyog) and concomitantly stimulated by Wnt3a protein (+Wnt3a) for 24 h. Setdb1 localisation was classified as homogeneous (homogen.) or cytoplasmic (cyto.) and the ratio was calculated. A minimum of 100 cells was counted for each condition. (g) Inhibition of Wnt signalling reduces Ankrd1, Ckm and MyHC levels. WB was performed in whole-cell extracts from C2C12 cells, differentiated (diff.) for the indicated time (in h) and simultaneously treated with IWP2. Vinculin; loading control. For (a, c, e and g): Images are representative of a minimum of three independent experiments. For (b and d): Data are presented as mean of a minimum of three independent experiments. For (f): Data are presented as mean±s.e.m. of a minimum of three independent experiments. For significance Student’s paired t-test was applied. *P-values <0.05 are considered significant. See also Supplementary Figure S5.
Figure 6
Figure 6
Wnt3a changes occupancy of Setdb1 at certain target gene promoters. (a) Setdb1 genome-wide recruitment is reduced after Wnt3a stimulation. ChIP-seq was performed in proliferating C2C12 myoblasts non-treated (Control) or treated with Wnt3a (Wnt3a). Graphic presents average Setdb1 binding density of genomic regions surrounding (±5 kb) Setdb1-binding sites (as in Figure 2a, FDR<1%, fourfold enrichment over the input and P-value<10−5). Setdb1 occupancy and input density are plotted as average of reads density (every 50 bp) and normalised to total number of reads. (b) Setdb1 and canonical Wnt signalling have common target genes in myoblasts. Deregulated genes upon Setdb1 acute knockdown in proliferating C2C12 myoblasts (red), analysed by RNA-sequencing, were crossed with deregulated genes upon Wnt3a stimulation in proliferating primary myoblasts (grey), analysed by microarray. Results are presented as Venn diagram. The correlation is determined as highly significant by hypergeometric test. P-value<10−16. (c) GO analysis of 245 (out of 270) commonly (in the same way) deregulated genes after Setdb1 acute knockdown in proliferating C2C12 myoblasts and Wnt3a stimulation in primary myoblasts as described in (b). Fisher's exact test was performed to proof significance. P-value between 10−30 and 10−100. (d) Genome Browser presentation of Setdb1-binding profile at the Ankrd1 enhancer in proliferating C2C12 myoblasts non-treated (control) or treated with Wnt3a for 24 h (Wnt3a). (e) Wnt3a increases Ankrd1 expression in proliferating primary and C2C12 myoblasts. Cells were untreated or stimulated with Wnt3a protein for 24 h (primary myoblasts) and 50–72 h (C2C12 myoblasts). Relative mRNA expression analysis of Ankrd1 was performed. Data are represented as fold change relative to untreated cells and normalised to CycloA and TBP. Data are presented as mean±s.e.m. of three independent experiments. For significance Student paired t-test was applied. *P-values <0.05 and are considered significant. (f) Model of Wnt3a-dependent nuclear export of Setdb1 and subsequent gene activation. In myoblasts (left) Setdb1 is located in the nucleus, where it occupies its target genes, such as Ankrd1, and represses their transcription by methylating H3K9. Hereby, interaction with other proteins are likely and require further investigation. When canonical Wnt signalling is repressed, β-Catenin is phosphorylated and degraded. In myotubes (right) Setdb1 is released from certain target genes and exported from the nucleus in a Wnt3a-dependent manner. Owing to the lack of H3K9me3 a subset of target genes are transcribed. It is possible that Setdb1 is replaced at certain promoters/enhancers by β-Catenin due to its translocation to the nucleus. The exported Setdb1 could be marked for nuclear export by certain post-translational modifications, such as phosphorylation. Proteasomal degradation of Setdb1 in the cytoplasm is possible. P, phosphrylation; X, any transcription factor; me in red circle, methylation. See also Supplementary Figure S6.

References

    1. Yin H, Price F, Rudnicki MA. Satellite cells and the muscle stem cell niche. Physiol Rev 2013; 93: 23–67. - PMC - PubMed
    1. Aziz A, Sebastian S, Dilworth FJ. The origin and fate of muscle satellite cells. Stem Cell Rev 2012; 8: 609–622. - PubMed
    1. Sartorelli V, Juan AH. Sculpting chromatin beyond the double helix: epigenetic control of skeletal myogenesis. Curr Top Dev Biol 2011; 96: 57–83. - PMC - PubMed
    1. Guasconi V, Puri PL. Chromatin: the interface between extrinsic cues and the epigenetic regulation of muscle regeneration. Trends Cell Biol 2009; 19: 286–294. - PMC - PubMed
    1. Zentner GE, Henikoff S. Regulation of nucleosome dynamics by histone modifications. Nat Struct Mol Biol 2013; 20: 259–266. - PubMed