. 2016 Dec;283(24):4528-4548.
doi: 10.1111/febs.13943. Epub 2016 Nov 20.

Neighboring phosphoSer-Pro motifs in the undefined domain of IRAK1 impart bivalent advantage for Pin1 binding

Affiliations

Neighboring phosphoSer-Pro motifs in the undefined domain of IRAK1 impart bivalent advantage for Pin1 binding

Monique J Rogals et al. FEBS J. 2016 Dec.

Abstract

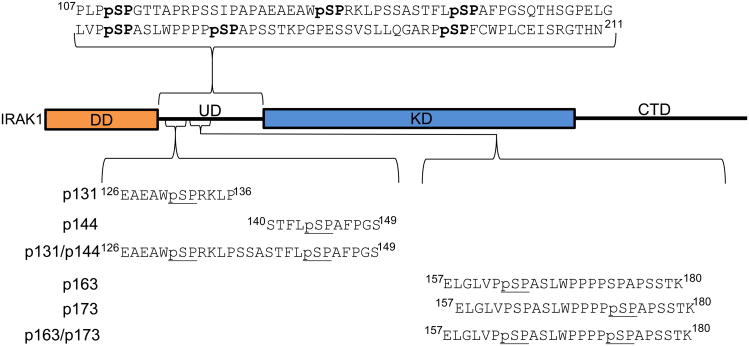
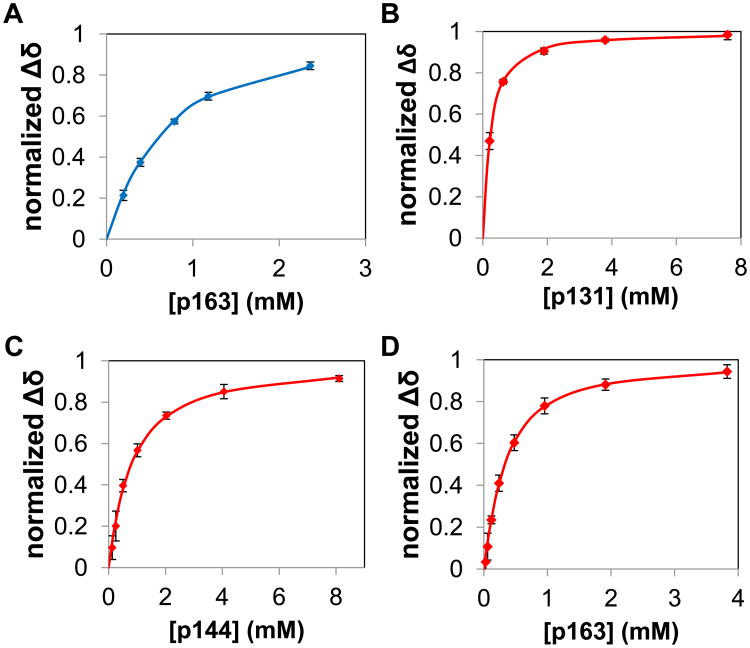
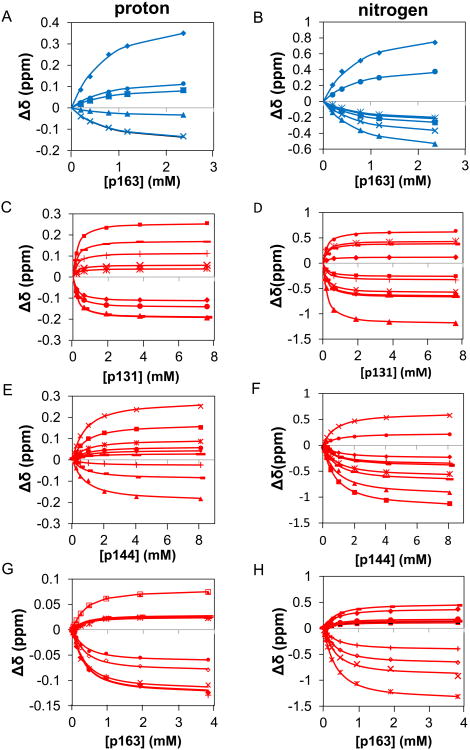
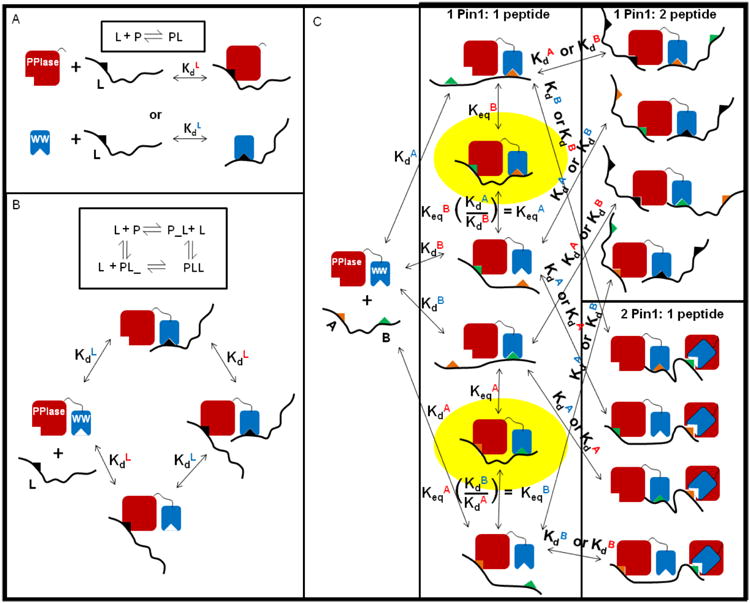
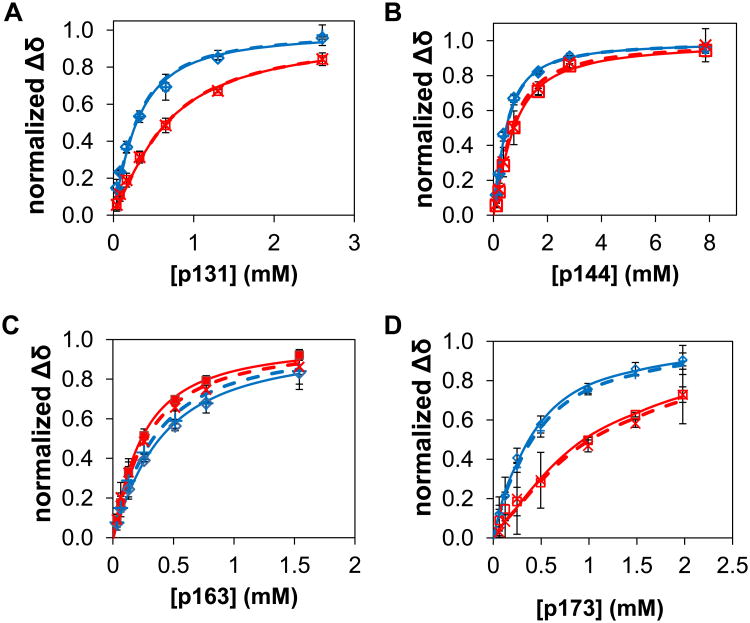
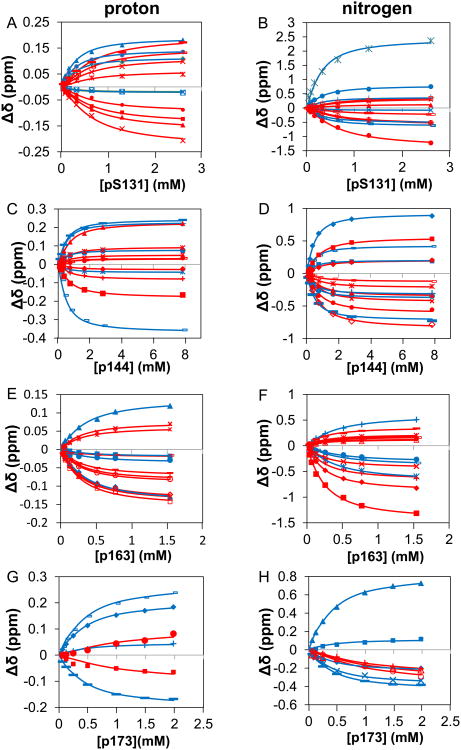
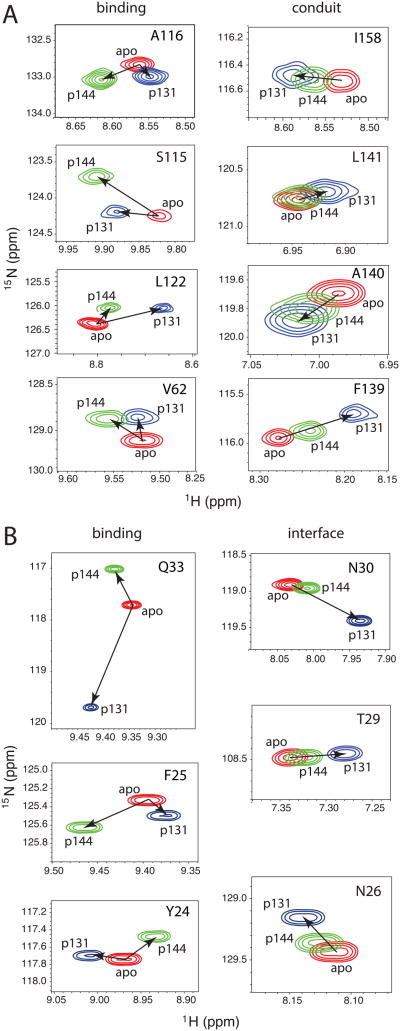
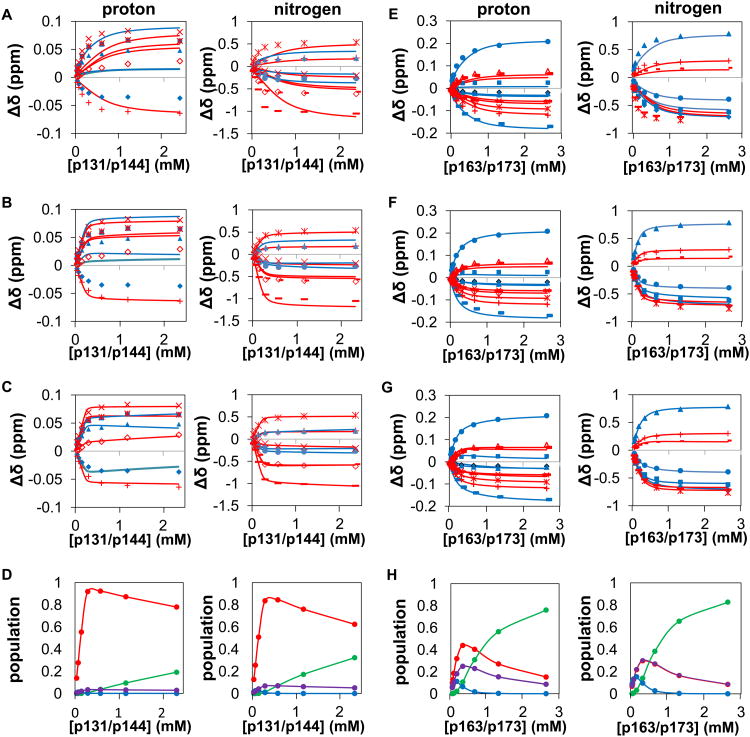
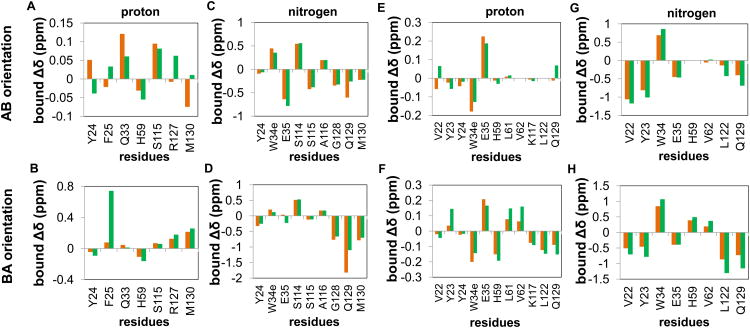
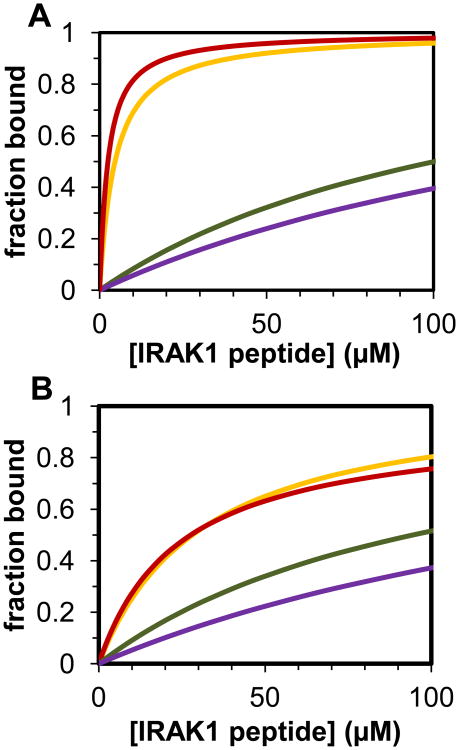
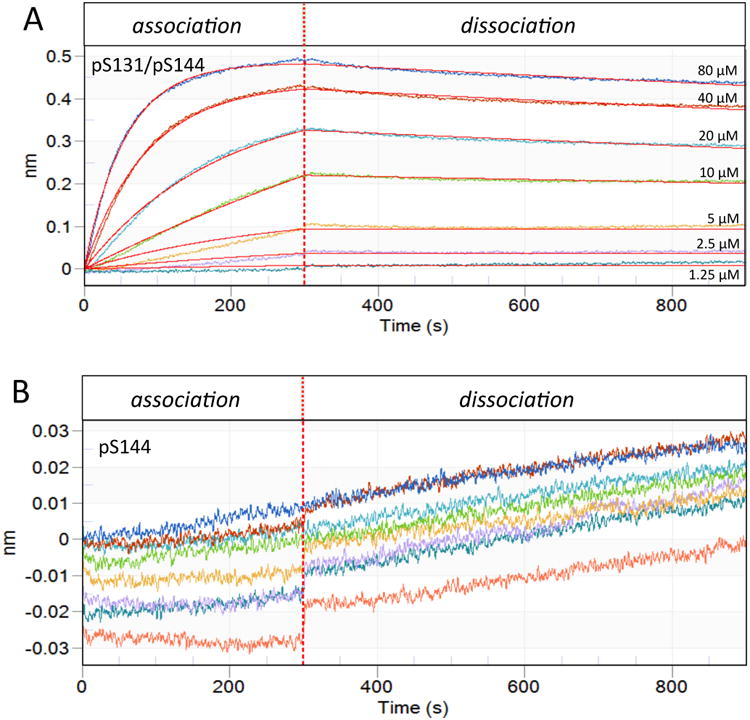
The peptidyl prolyl isomerase Pin1 has two domains that are considered to be its binding (WW) and catalytic (PPIase) domains, both of which interact with phosphorylated Ser/Thr-Pro motifs. This shared specificity might influence substrate selection, as many known Pin1 substrates have multiple sequentially close phosphoSer/Thr-Pro motifs, including the protein interleukin-1 receptor-associated kinase-1 (IRAK1). The IRAK1 undefined domain (UD) contains two sets of such neighboring motifs (Ser131/Ser144 and Ser163/Ser173), suggesting possible bivalent interactions with Pin1. Using a series of NMR titrations with 15N-labeled full-length Pin1 (Pin1-FL), PPIase, or WW domain and phosphopeptides representing the Ser131/Ser144 and Ser163/Ser173 regions of IRAK1-UD, bivalent interactions were investigated. Binding studies using singly phosphorylated peptides showed that individual motifs displayed weak affinities (> 100 μm) for Pin1-FL and each isolated domain. Analysis of dually phosphorylated peptides binding to Pin1-FL showed that inclusion of bivalent states was necessary to fit the data. The resulting complex model and fitted parameters were applied to predict the impact of bivalent states at low micromolar concentrations, demonstrating significant affinity enhancement for both dually phosphorylated peptides (3.5 and 24 μm for peptides based on the Ser131/Ser144 and Ser163/Ser173 regions, respectively). The complementary technique biolayer interferometry confirmed the predicted affinity enhancement for a representative set of singly and dually phosphorylated Ser131/Ser144 peptides at low micromolar concentrations, validating model predictions. These studies provide novel insights regarding the complexity of interactions between Pin1 and activated IRAK1, and more broadly suggest that phosphorylation of neighboring Ser/Thr-Pro motifs in proteins might provide competitive advantage at cellular concentrations for engaging with Pin1.

Keywords: NMR titration; Pin1; bivalent interaction; interleukin-1 receptor-associated kinase-1; multi-state equilibrium.


Conflict of interest statement

Dr. Lu declares that he is an inventor of Pin1 technology, which was licensed by BIDMC to Pinteon Therapeutics. Dr. Lu owns equity in, and consults for, Pinteon. His interests were reviewed and are managed by BIDMC in accordance with its conflict of interest policy.

Figures

Figure 1
Figure 1. Diagram of the peptide sequences used, shown in context of full length IRAK1
The synthetic peptides used in these experiments are aligned by shared phosphorylation sites. The separation between the sets of proximal sites used in the bivalent binding-capable peptides is shown with regards to a diagram of FL IRAK1 where the DD (in orange) is the death domain (residues 27-106), UD is the undefined domain (107-211), KD (in blue) is the kinase domain (212-521), and CTD is the C-terminal domain (521-691). The rectangles represent areas of predicted stable 3D structure and the lines are predicted intrinsically disordered regions.
Figure 2
Figure 2. Goodness of fit of bimolecular model to data for titrations of isolated Pin1 domains with singly phosphorylated IRAK1-UD peptides
Binding curves are shown, where lines are calculated curves and the points are the normalized mean of the chemical shift perturbation of the binding of different IRAK1-UD-derived peptides to isolated domains of Pin1. The WW domain is represented by blue and PPIase is represented by red. Chemical shift perturbations were normalized by dividing the measured perturbation by the final chemical shift perturbation for each residue. The x-axis is the concentration of the individual peptide in mM and the y-axis is the mean of the normalized chemical shift perturbation of selected residues (see methods section). Error bars are the SEM of the individual residues. Plots are of A) WW domain binding to p163 (residues used were S18, R21, V22, W34e, W34, and E35 in the proton dimension and S18, R21, V22, Y23, Y24, W34, and E35 in the nitrogen dimension, providing n=13), B) PPIase domain binding to p131 (residues used were H59, R68, R69, S114, K117, L122, R127, G128, and M130 in the proton dimension, and H59, V62, R68, R69, S114, K117, L122, R127, G128, and M130 in the nitrogen dimension, providing n=19), C) PPIase domain binding to p144 (residues used were V62, R68, R69, S114, S115, A116, L122, G128, and Q129 in both dimensions, providing n=18), and D) PPIase domain binding to p163 (residues used were H59, L61, V62, R69, S115, A116, A118, R119, R127 and Q129 in both dimensions, providing n=20).
Figure 3
Figure 3. The simultaneous fits of isolated domains of Pin1 titrated with singly phosphorylated IRAK1-UD derived peptides shown in terms of chemical shift perturbation of selected residues in individual dimensions
The x-axis represents the amount of peptide titrated in and the y-axis is the chemical shift perturbations. The points represent the data and the lines represent the two-state fit of said data. The WW residues are shown as blue and the PPIase residues are in red. A) selected residues in the proton dimension (S18 filled◊, R21 unfilled□, V22 filledΔ, W34 *, W34e ×, E35 filled ○) for WW domain titrated with p163. B) selected residues in the nitrogen dimension (S18 filled◊, R21 filled□, V22 filledΔ, Y23 ×, Y24 *, W34 filled ○, E35 +) for WW domain titrated with p163 C) selected residues in the proton dimension (H59 filled◊, R68 filled□, R69 filledΔ, S114 ×, K117 *, L122 filled ○, R127 +, G128 -, M130—) for PPIase domain titrated with p131 D) selected residues in the nitrogen dimension (H59 filled◊, V62 filled□, R68 filledΔ, R69 ×, S114 *, K117 filled ○, L122 +, R127 -, G128 —, M130 filled◊) for PPIase domain titrated with p131 E) selected residues in the proton dimension (V62 filled◊, R68 filled□, R69 filledΔ, S114 ×, S115 *, A116 filled ○, L122 +, G128 -, Q129 —) for PPIase domain titrated with p144 F) selected residues in the nitrogen dimension (V62 filled◊, R68 filled□, R69 filledΔ, S114 ×, S115 *, A116 filled ○, L122 +, G128 -, Q129 —) for PPIase domain titrated with p144 G) selected residues in the proton dimension (H59 filled◊, L61 unfilled□, V62 filledΔ, R69 ×, S115 *, A116 filled ○, A118 +, R119 small unfilled□, R127 —, Q129 unfilled◊) for PPIase domain titrated with p163 H) selected residues in the nitrogen dimension (H59 filled◊, L61 filled□, V62 filledΔ, R69 ×, S115 *, A116 filled ○, A118 +, R119 -, R127 —, Q129 unfilled◊) for PPIase domain titrated with p163.
Figure 4
Figure 4. Models for interactions of monovalent and bivalent peptides with Pin1
A) Simple bimolecular binding equilibrium, [L] + [P] ↔ [LP], where P is either isolated WW or PPIase domain and L is a singly phosphorylated (monovalent) peptide. B) The four-state model for Pin1-FL (P in diagram) binding to a monovalent peptide (L) in a 1:1 fashion bound to either the WW domain (PL_) or the PPIase domain (P_L) or in a 2:1 fashion with two peptides bound to Pin1, one in each domain (PLL). C) Multi-state model for Pin1-FL binding to a bivalent peptide where A (orange triangle) is the N-terminal site (either p131 or p163) and B (green triangle) is the C-terminal site (either p144 or p173). For simplicity, black triangles represent either site and the overlaid binding sites on Pin1 represent binding to either domain.
Figure 5
Figure 5. Goodness of fit of four-state model to data for titrations of Pin1-FL with singly phosphorylated IRAK1-UD peptides
In these binding curves, datapoints represent the normalized mean of the observed chemical shift perturbations across selected domain-specific residues in Pin1-FL induced by titration with a given peptide, and lines are the resulting fits to the four-state model. Chemical shift perturbations were normalized by dividing the measured or calculated perturbation by the fitted Δδij,bound for each residue i. For Pin1-FL titrations, WW domain data are denoted by blue open diamonds (nitrogen dimension) and blue + (proton dimension), and PPIase domain data by red open squares (nitrogen dimension) and red × (proton dimension). Dashed lines represent the fits in the nitrogen dimension and solid lines represent the corresponding fits in the proton dimension. The error bars are the SEM of the individual residues used in each dimension. Plots of Pin1-FL binding to A) p131, where selected residues for the proton dimension were F25, Q33, W34, W34e, and E35 in the WW domain (n=5) and H59, R69, S114, S115, R127, G128, Q129, and M130 in the PPIase domain (n=8). Selected residues for the nitrogen dimension were Y23, Y24, Q33, W34, W34e, and E35 in the WW domain (n=6) and V62, R69, S114, A116, R127, G128, Q129, and M130 in the PPIase domain (n=8). B) p144, where selected residues in the proton dimension were Y24, F25, W34, W34e, and E35 in the WW domain (n=5) and H59, V62, R69, S114, S115, A116, G128, and Q129 in the PPIase domain (n=8). In the nitrogen dimension, selected residues were Y23, Y24, F25, Q33 W34, W34e in the WW domain (n=6) and V62, R69, S114, S115, A116, R127, G128, and Q129 in the PPIase domain (n=8). C) p163, where selected residues in the proton dimension were Y23, Y24, W34, and W34e in the WW domain (n=4) and H59, V61, V62, R69, A116, K117, A118, G128, and Q129 in the PPIase domain (n=9). In the nitrogen dimension, selected residues were Y23, Y24, W34, and E35 in the WW domain (n=4) and H59, V62, R69, S115, A116, A118, R127, Q129 and K132 in the PPIase domain (n=9). D) p173, where selected residues in the proton dimension were F25, W34, and W34e in the WW domain (n=3) as well as S114 and S115 in the PPIase domain (n=2). In the nitrogen dimension, selected residues were Y23, Y24, F25, W34, and E35 in the WW domain (n=5) and R68, Q129, and M130 in the PPIase domain (n=3).
Figure 6
Figure 6. The simultaneous fits of intact Pin1 with singly phosphorylated IRAK1-UD derived peptides shown in terms of chemical shift perturbation of selected residues in individual dimensions
The x-axis is the concentration of peptide titrated in and the y-axis is the chemical shift perturbation. Blue represents WW domain residues while red represents PPIase residues. The symbols are the experimental data and the lines are the simultaneous fits. A) selected residues in the proton dimension (F25 unfilled□, Q33 filled◊, W34 filled ○, W34e ×, E35 filledΔ, H59 filled○, R69 ×, S114 -, S115 *, R127 ×, G128 filledΔ, Q129 filled□, and M130 —) for Pin1 titrated with p131. B) selected residues in the nitrogen dimension (Y23 filledΔ, Y24 ×, Q33 *, W34 filled ○, W34e +, E35 -, V62 —, R69 filled◊, S114 unfilled□, A116 filledΔ, R127 ×, G128 unfilled ○, Q129 filled ○, M130 +) for Pin1 titrated with p131. C) selected residues in the proton dimension (Y24 *, F25 filled ○, W34 +, W34e -, E35 —, H59 filled◊, V62 -, R69 filled□, S114 filledΔ, S115 *, A116 ×, G128 +, Q129 filled ○) for Pin1 titrated with p144. D) selected residues in the nitrogen dimension (Y23 filled ○, Y24 +, F25 -, Q33 —, W34 filled◊, W34e filled□, V62 *, R69 unfilled◊, S114 filled□, S115 ×, A116 filled◊, R127 -, G128 filledΔ, Q129 filled ○) for Pin1 titrated with p144. E) selected residues in the proton dimension (Y23 filled□, Y24 filled ○, W34 filledΔ, W34e filled◊, H59 unfilledΔ, L61 ×, V62 *, R69 unfilled□, A116 unfilled ○, K117 —, A118 unfilled◊, G128 -, Q129 +) for Pin1 titrated with p163. F) selected residues in the nitrogen dimension (Y23 *, Y24 filled ○, W34 filled◊, E35 -, H59 —, V62 -, R69 filled◊, S115 filled□, A116 unfilledΔ, A118 ×, R127 filled ○, Q129 filled◊, K132 *) for Pin1 titrated with p163. G) selected residues in the proton dimension (F25 +, W34 -, W34e —, E35 filled◊, S114 filled□, S115 filled ○) for Pin1 titrated with p173 H) selected residues in the nitrogen dimension (Y23 —, Y24 filled◊, F25 filled□, W34 filledΔ, E35 ×, R68 unfilledΔ, Q129 unfilled ○, M130 +) for Pin1 titrated with p173.
Figure 7
Figure 7. Difference between peak movements attributable to interdomain interactions versus protein-peptide binding induced by titration with p131 and p144
Regions extracted from 15N-1H HSQC spectra of Pin1-FL in apo (red), the most saturated spectrum from titration with p131 (blue), and the most saturated spectrum from titration with p144 (green). A) PPIase residues in either the binding site or implicated in conduit that informs on allostery[44, 45]. B) WW residues in either the binding site or at the interface between the two domains.
Figure 8
Figure 8. Modeling of data for titrations of Pin1 FL with dually phosphorylated peptides
The data points and corresponding globally fit or simulated binding curves (panels A – C and E – G) are color-coded by domain (blue = WW residues, red = PPIase residues), for titrations of Pin1-FL with p131/p144 (A – D) and with p163/173 (E – H), showing simulations without the bivalent states (A,E), fitting for the two global Keq values (B,F) and fitting for the two global Keq values and the the residue-specific bound chemical shift perturbations for the bivalent species (C,G). For p131/p144 plots (A-C), in the proton dimension Y24 is filled◊, F25 filled Δ, H59 +, S115 ×, R127 *, M130 open ◊; additionally in the nitrogen dimension, W34ε filled Δ, E35 filled ○, S114 *, A116 +, G128 -, and Q129 —). For p163/173 plots (E-G), in the proton dimension V22 is filled ◊, Y23 filled large □, Y24 filled Δ, W34ε filled small □, E35 filled ○, H59 +, L61 open Δ, V62 -, K117 ×, L122 *, Q129 —; additionally, in the nitrogen dimension V22 is filled ◊, Y23 filled □, W34 filled Δ, E35 filled ○, H59 +, V62 -, L122 *, and Q129 —. D) Equilibrium populations of the different types of species resulting from the fit in C, where species are grouped into: bivalent species (red), 2 pin1: 1 peptide species (blue), 1 Pin1:2 peptide species (green) and non-bivalent 1 Pin1:1 peptide species (purple). H) The equilibrium populations given different concentrations of peptide of the different types of species resulting from the fit where the species are grouped into: Bivalent species (red), 2 pin1: 1 peptide species (blue), 1 Pin1:2 peptide species (green) and non-bivalent 1 Pin1:1 peptide species (purple).
Figure 9
Figure 9. Comparison between fitted bound Δδ values for bivalent and corresponding non-bivalent species of Pin1-FL
Residue-specific bound Δδ values (Δδij,bound) obtained by fitting of data from Pin1-FL titrated with dually phosphorylated peptides (green bars) and the corresponding fitted values from fitting of data from Pin1-FL titrated with singly phosphorylated peptides (orange bars) are shown for the residues used in the bivalent fits shown in Fig. 6C and 6G. The AB orientation is the species with WW bound to the first site (pS131-P132 or pS163-P164) and PPIase bound to the second site (pS144-P145 or pS173-P174). The BA orientation is the species with WW bound to the second site (pS144-P145 or pS173-P174) and PPIase bound to the first site (pS131-P132 or pS163-P164). A-D) Comparisons of fitted proton and nitrogen Δδ values obtained for p131/p144, p131, and p144. E-G) Comparisons of fitted proton and nitrogen Δδ values obtained for p163/p173, p163, and p173.
Figure 10
Figure 10. Prediction of significance of bivalent binding at low (micromolar) concentrations
Simulation of fraction of Pin1-FL bound (sum of all species including bound Pin1 in the system) when 0.5 μM Pin1-FL is titrated with various IRAK1-UD derived, phosphorylated peptides using the models from Figure 3. A) Comparison of predicted fraction bound for Pin1-FL with IRAK1 where S131-P132 is phosphorylated (green), S144-P145 is phosphorylated (purple), or both S131-P132 and S144-P145 are phosphorylated (orange and red). The KD and Keq values were taken from the fits of titrations with p131, p144 (where in both cases the simulation in the proton dimension is recapitulated with the nitrogen dimension), and the nitrogen (orange) and proton (red) dimension based fits of the p131/p144 titration. B) Comparison of calculated fraction bound for Pin1-FL and phosphorylated S163-P164 (green), pS173-P174 (purple), or pS163-P164 and pS173-P174, where the parameters used are based on fits of the p163, p173 (where in both cases the simulation in the proton dimension is recapitulated with the nitrogen dimension), and p163/p173 titrations (nitrogen dimension based parameters yielded the solid line simulation and the proton dimension yielded the short dashed line.
Figure 11
Figure 11. Biolayer Interferometry demonstrates bivalent advantage of IRAK1-Pin1 interaction at low micromolar concentrations
Pin1 was immobilized on the biosensor tip and dipped into peptide-containing well (association) then buffer only well (dissociation). The X-axis is the residence time in each well and the Y-axis denotes the change in wavelength upon binding. The vertical dotted line represents transfer of the biosensor between the association phase (containing peptide) and the dissociation phase (lacking peptide). A) Association-dissociation curves for p131/p144 peptide concentrations of 80, 40, 20, 10, 5, 2.5 and 1.25 μM (as marked, also color-coded) were fit to a simple bimolecular binding model (red lines). B) Association-dissociation curves for p144 peptide concentrations as in A (with same color-coding), plotted on a vertical scale amplified by an order of magnitude relative to A. Binding was insufficient for curve fitting. Since analysis could not be performed, the control spectrum is also shown (salmon).

Similar articles

Cited by

References

    1. Lu KP, Zhou XZ. The prolyl isomerase PIN1: a pivotal new twist in phosphorylation signalling and disease. Nat Rev Mol Cell Biol. 2007;8:904–16. - PubMed
    1. Zheng H, You H, Zhou XZ, Murray SA, Uchida T, Wulf G, Gu L, Tang X, Lu KP, Xiao ZX. The prolyl isomerase Pin1 is a regulator of p53 in genotoxic response. Nature. 2002;419:849–53. - PubMed
    1. Shaw PE. Peptidyl-prolyl cis/trans isomerases and transcription: is there a twist in the tail? EMBO Rep. 2007;8:40–5. - PMC - PubMed
    1. Ciarapica R, Methot L, Tang Y, Lo R, Dali R, Buscarlet M, Locatelli F, del Sal G, Rota R, Stifani S. Prolyl isomerase Pin1 and protein kinase HIPK2 cooperate to promote cortical neurogenesis by suppressing Groucho/TLE:Hes1-mediated inhibition of neuronal differentiation. Cell Death Differ. 2014;21:321–32. - PMC - PubMed
    1. Nakamura K, Kosugi I, Lee DY, Hafner A, Sinclair DA, Ryo A, Lu KP. Prolyl isomerase Pin1 regulates neuronal differentiation via beta-catenin. Mol Cell Biol. 2012;32:2966–78. - PMC - PubMed

Publication types

MeSH terms