. 2016 Oct 25;113(43):12059-12064.
doi: 10.1073/pnas.1603348113. Epub 2016 Oct 10.

Thermogenic methane release as a cause for the long duration of the PETM

Affiliations

Thermogenic methane release as a cause for the long duration of the PETM

Joost Frieling et al. Proc Natl Acad Sci U S A. .

Abstract

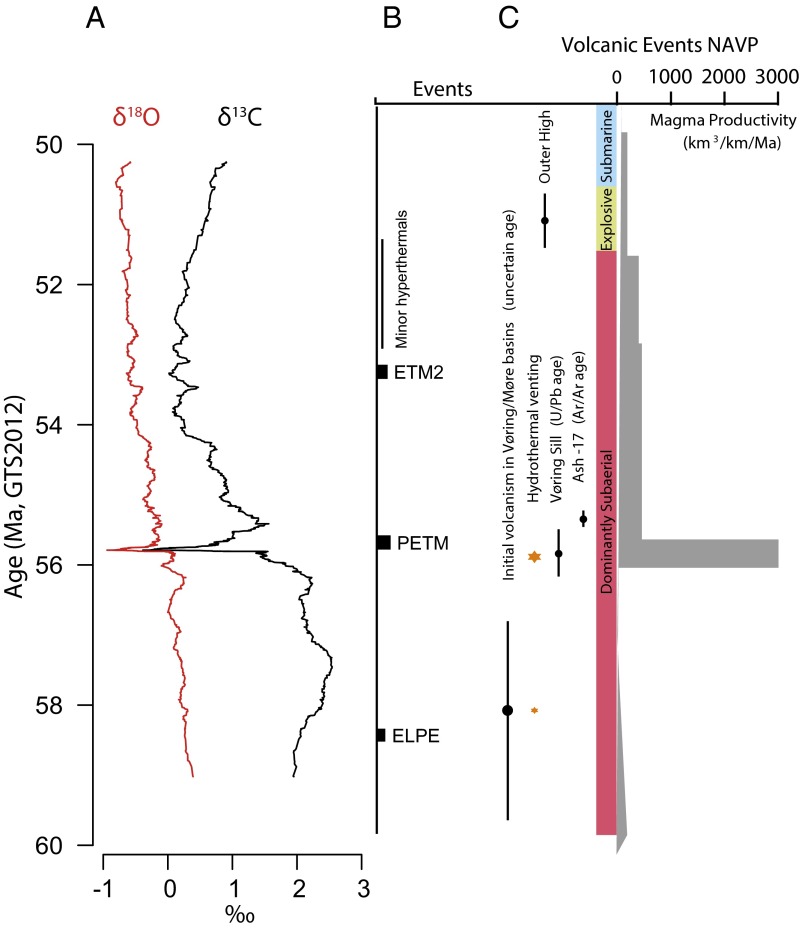
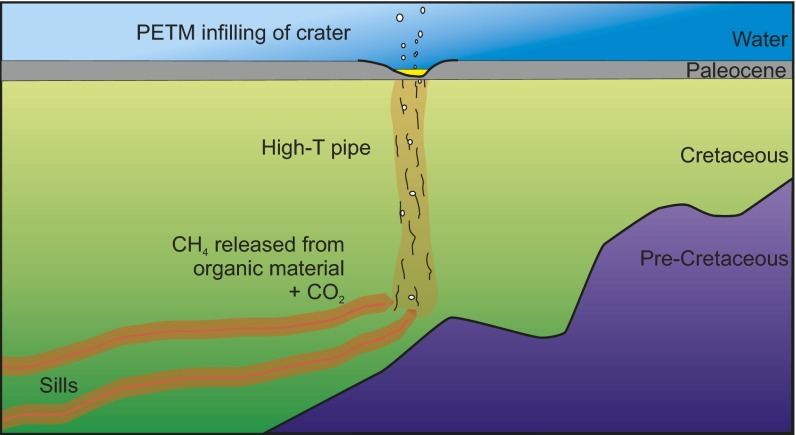
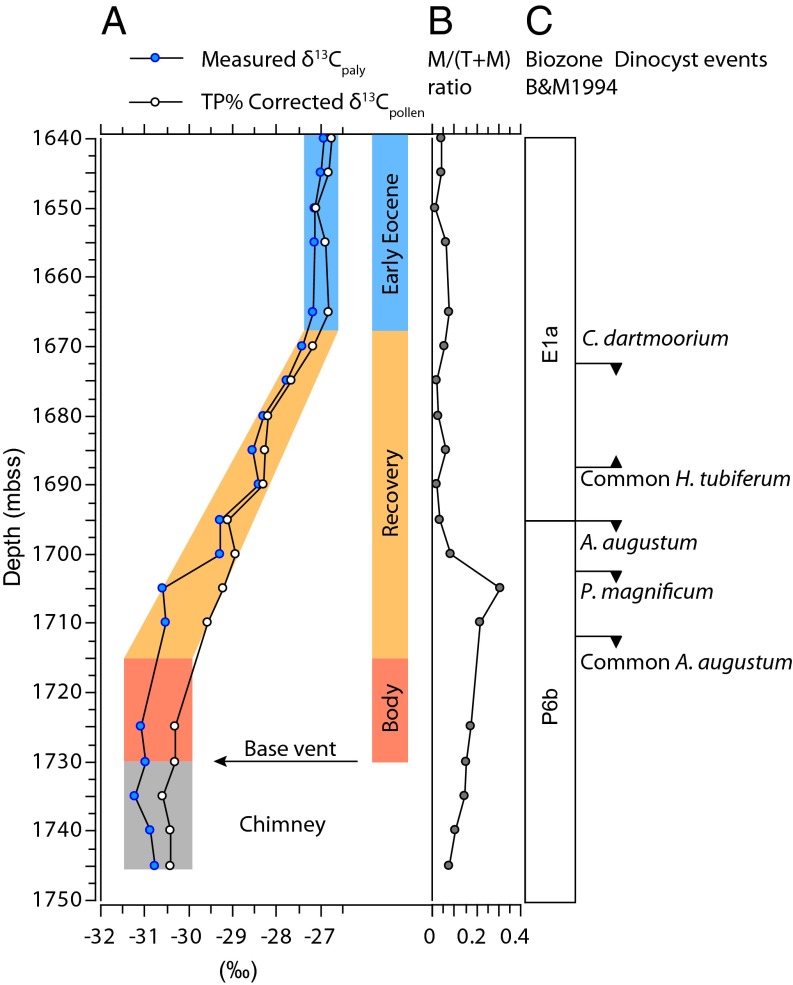
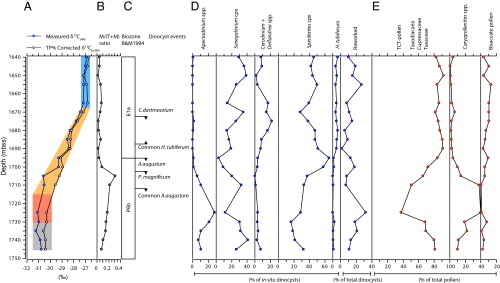
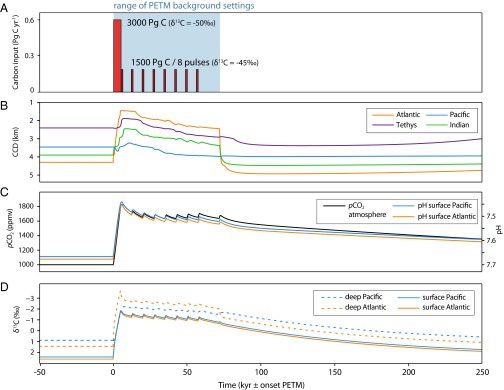
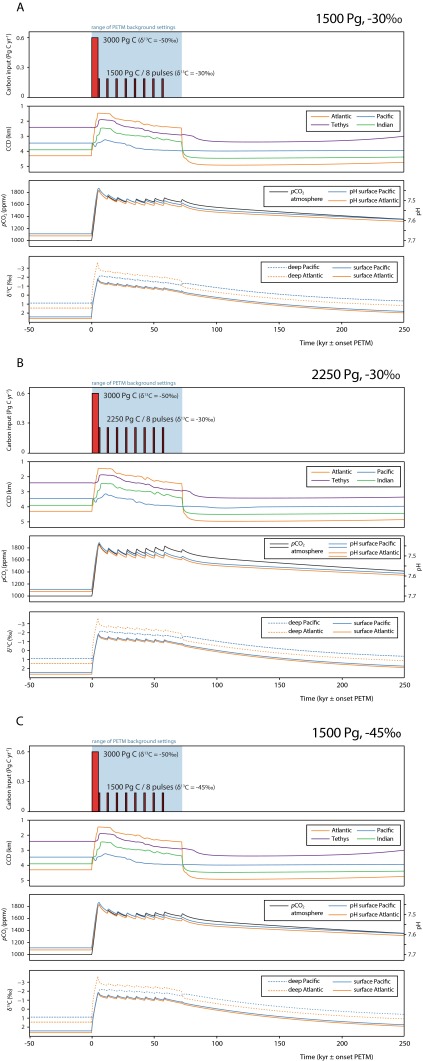
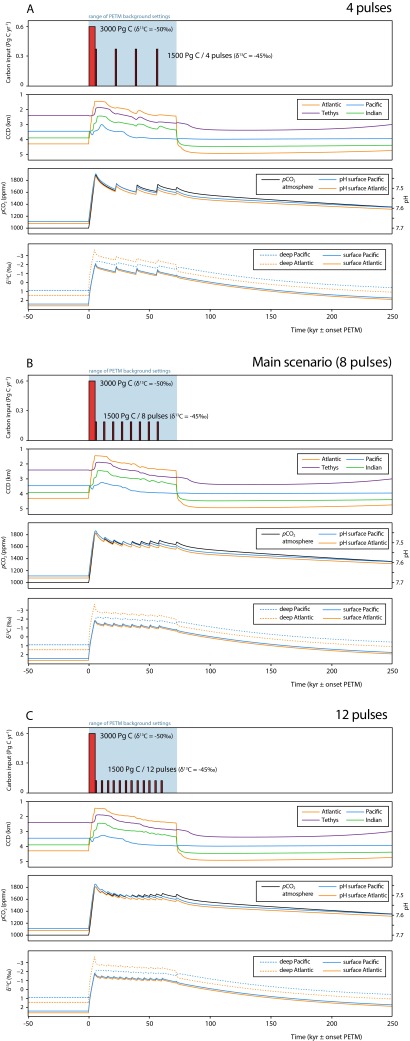
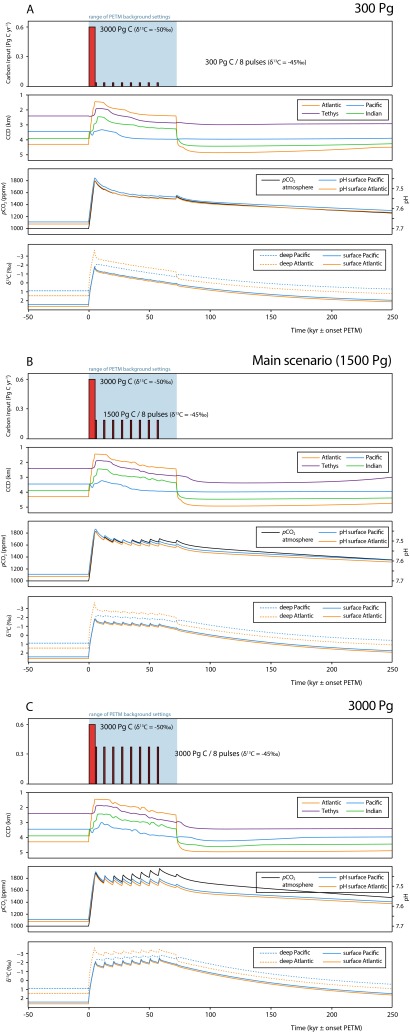
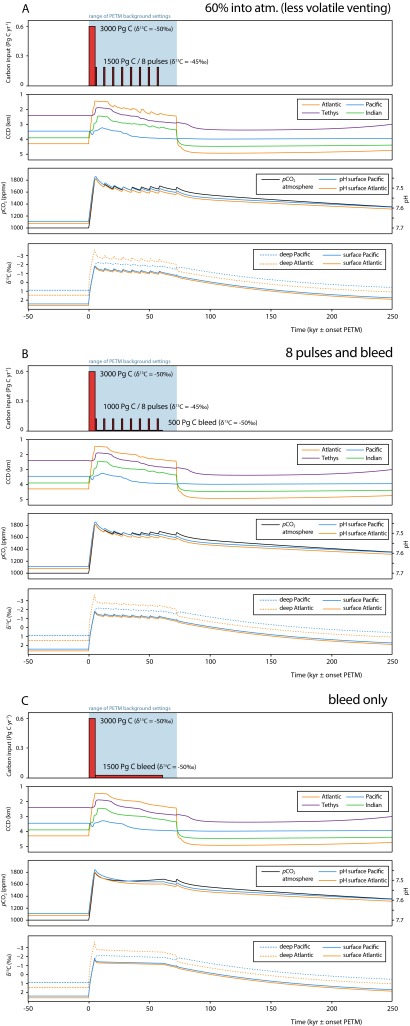
The Paleocene-Eocene Thermal Maximum (PETM) (∼56 Ma) was a ∼170,000-y (∼170-kyr) period of global warming associated with rapid and massive injections of 13C-depleted carbon into the ocean-atmosphere system, reflected in sedimentary components as a negative carbon isotope excursion (CIE). Carbon cycle modeling has indicated that the shape and magnitude of this CIE are generally explained by a large and rapid initial pulse, followed by ∼50 kyr of 13C-depleted carbon injection. Suggested sources include submarine methane hydrates, terrigenous organic matter, and thermogenic methane and CO2 from hydrothermal vent complexes. Here, we test for the contribution of carbon release associated with volcanic intrusions in the North Atlantic Igneous Province. We use dinoflagellate cyst and stable carbon isotope stratigraphy to date the active phase of a hydrothermal vent system and find it to postdate massive carbon release at the onset of the PETM. Crucially, however, it correlates to the period within the PETM of longer-term 13C-depleted carbon release. This finding represents actual proof of PETM carbon release from a particular reservoir. Based on carbon cycle box model [i.e., Long-Term Ocean-Atmosphere-Sediment Carbon Cycle Reservoir (LOSCAR) model] experiments, we show that 4-12 pulses of carbon input from vent systems over 60 kyr with a total mass of 1,500 Pg of C, consistent with the vent literature, match the shape of the CIE and pattern of deep ocean carbonate dissolution as recorded in sediment records. We therefore conclude that CH4 from the Norwegian Sea vent complexes was likely the main source of carbon during the PETM, following its dramatic onset.

Keywords: PETM; carbon cycle; climate change; thermogenic methane; volcanism.


Conflict of interest statement

The authors declare no conflict of interest.

Figures

Fig. S1.
Fig. S1.
North Atlantic Volcanism and long-term Paleocene–Eocene climate. (A) Oxygen and carbon isotope compilation from Cramer et al. (75) showing long-term warming from 60 to 51 Ma. (B) Significant climatic and biological events. ELPE, Early Late Paleocene Event; ETM2, Eocene Thermal Maximum 2. (C) Volcanic events and approximate magma production from Storey et al. (17).
Fig. 1.
Fig. 1.
Map showing the location of wildcat 6607/12-1 (red rectangle) and other vent complexes (black dots and white triangles) and volcanics in the Vøring and Møre basins, redrawn from Svensen et al. (23).
Fig. 2.
Fig. 2.
Schematic view of vent structures. Ages of important regional sedimentary formations are indicated on the left and maturity of the organic matter on the right. Note that the base of the vent complex is at 1,730 mbss, ∼30 m lower than the average depth of the Top Paleocene horizon outside the vent complex. TD, total depth.
Fig. S2.
Fig. S2.
Seismic data around the studied vent system. (A) Seismic profile across the hydrothermal vent system penetrated by 6607/12-1; green lines indicate sill intrusions, and the yellow line represents the top Paleocene reflector. Two-way travel time (twt) is indicated. (B) Three-dimensional visualization of the hydrothermal vent system, with pronounced crater and overlying eye structure.
Fig. S3.
Fig. S3.
Conceptual image of carbon release through hydrothermal venting.
Fig. 3.
Fig. 3.
Stratigraphy of the 6607/12-1 borehole. (A) Isotope records of isolated palynological residue (δ13C paly) and pollen (δ13C pollen). (B) Fraction of marine palynomorphs calculated as marine/marine plus terrestrial [M/(T+M)]. (C) Dinocyst zonation is based on Bujak and Mudge (B&M) (35) and stratigraphically important dinocyst events.
Fig. S4.
Fig. S4.
(A) δ13C records, color coded as in Fig. 3A: chimney (gray), body of the CIE (red), recovery (orange), and Early Eocene (blue). (B) Fraction of marine palynomorphs calculated as marine/marine + terrestrial [M/(T+M)]. (C) Dinocyst zonation based on Bujak and Mudge [B&M (35)] and stratigraphically important dinocyst events. (D) Dinoflagellate cyst assemblages (relative abundances in percentages). (E) Pollen assemblages (relative abundances in percentages).
Fig. 4.
Fig. 4.
LOSCAR model output of pulsed carbon release. (A) Emission scenario showing the release of carbon with eight distinct pulses of 187.5 Pg over 1 kyr each following an initial release of 3,000 Pg over 5 kyr. Selected background conditions were changed during the PETM body and are highlighted in blue (SI Text). (B) Response of CCD in different ocean boxes. (C) Response of δ13C of dissolved inorganic carbon in different ocean boxes. (D) Response of atmospheric CO2 concentrations in parts per million and pH of different ocean boxes.
Fig. S5.
Fig. S5.
LOSCAR model output for carbon release with variable δ13C (−30 and −45‰) during the body of the CIE, showing CCD, pCO2 and pH, and δ13C change in different ocean boxes. (A) Emission scenario showing the release of 1,500 Pg of carbon with a δ13C of −30‰. (B) Release of 2,250 Pg of carbon and δ13C of −30‰. (C) Release of 1,500 Pg of carbon and δ13C of −45‰ (identical to Fig. 4).
Fig. S6.
Fig. S6.
LOSCAR model output for carbon release scenarios with variable number of pulses during the body of the CIE, showing CCD, pCO2 and pH, and δ13C change in different ocean boxes. (A) Emission scenario showing the release of carbon in four distinct pulses. (B) Same for eight pulses (identical to Fig. 4). (C) Same for 12 pulses.
Fig. S7.
Fig. S7.
LOSCAR model output of variable carbon release during the body of the CIE (300, 1,500, and 3,000 Pg) in eight pulses, showing CCD, pCO2 and pH, and δ13C change in different ocean boxes. (A) Emission scenario showing the release of 300 Pg of carbon. (B) Same for 1,500 Pg (see also Fig. 4). (C) Same for 3,000 Pg.
Fig. S8.
Fig. S8.
LOSCAR model output of other alternative carbon release during the body of the CIE showing CCD, pCO2 and pH, and δ13C change in different ocean boxes. (A) Emission scenarios showing the pulsed release of carbon consisting of eight distinct pulses of 187.5 Pg (60% into the atmosphere, compared with 90% in Fig. 4). (B) Emission scenario showing pulsed release of carbon (1,000 Pg/−45‰) but with continuous background carbon “leakage” (500 Pg/−50‰). (C) Emission scenario showing continuous release of 1,500 Pg/−50‰ across 60 kyr.

References

    1. Dunkley Jones T, et al. Climate model and proxy data constraints on ocean warming across the Paleocene–Eocene Thermal Maximum. Earth Sci Rev. 2013;125:123–145.
    1. Zachos JC, et al. Rapid acidification of the ocean during the Paleocene-Eocene thermal maximum. Science. 2005;308(5728):1611–1615. - PubMed
    1. Sluijs A, et al. Warming, euxinia and sea level rise during the paleocene-eocene thermal maximum on the gulf coastal plain: Implications for ocean oxygenation and nutrient cycling. Clim Past. 2014;10(4):1421–1439.
    1. Sluijs A, Bowen GJ, Brinkhuis H, Lourens LJ, Thomas E. The Palaeocene-Eocene Thermal Maximum super greenhouse: Biotic and geochemical signatures, age models and mechanisms of global change. In: Williams M, Hayward A, Gregory J, Schmidt D, editors. Deep Time Perspectives on Climate Change: Marrying the Signal from Computer Models and Biological Proxies: The Micropalaeontological Society, Special Publications. The Geological Society; London: 2007. pp. 323–349.
    1. Schmitz B, Pujalte V. Abrupt increase in seasonal extreme precipitation at the Paleocene-Eocene boundary. Geology. 2007;35(3):215–218.

Publication types

LinkOut - more resources