. 2016 Oct 25;113(43):12071-12075.
doi: 10.1073/pnas.1604386113. Epub 2016 Oct 10.

Hurricane Sandy's flood frequency increasing from year 1800 to 2100

Affiliations

Hurricane Sandy's flood frequency increasing from year 1800 to 2100

Ning Lin et al. Proc Natl Acad Sci U S A. .

Abstract

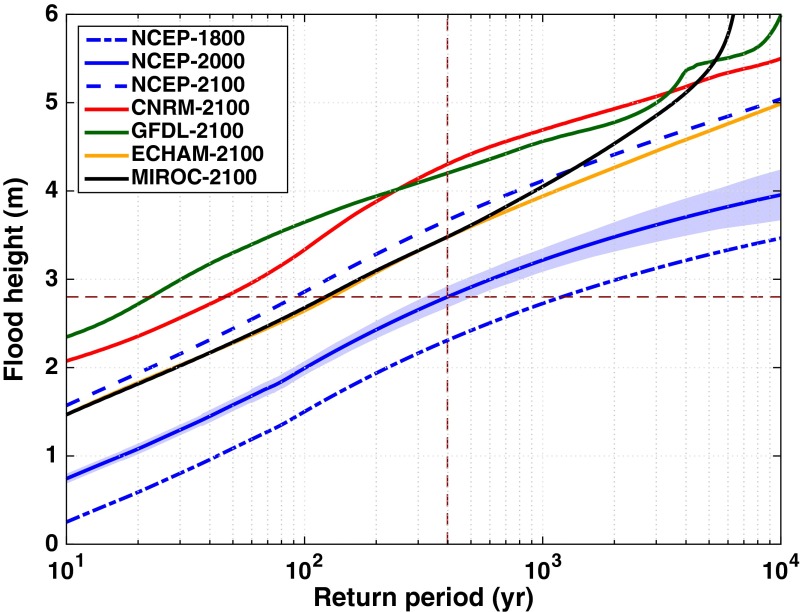
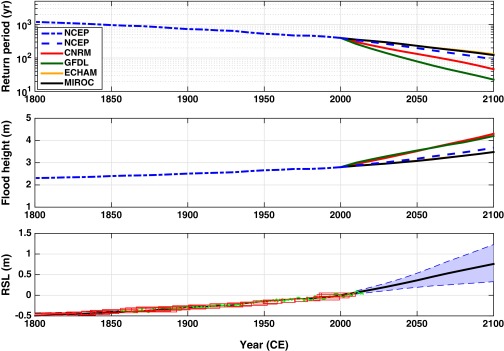
Coastal flood hazard varies in response to changes in storm surge climatology and the sea level. Here we combine probabilistic projections of the sea level and storm surge climatology to estimate the temporal evolution of flood hazard. We find that New York City's flood hazard has increased significantly over the past two centuries and is very likely to increase more sharply over the 21st century. Due to the effect of sea level rise, the return period of Hurricane Sandy's flood height decreased by a factor of ∼3× from year 1800 to 2000 and is estimated to decrease by a further ∼4.4× from 2000 to 2100 under a moderate-emissions pathway. When potential storm climatology change over the 21st century is also accounted for, Sandy's return period is estimated to decrease by ∼3× to 17× from 2000 to 2100.

Keywords: Hurricane Sandy; New York City; climate change; sea level rise; storm surge.


Conflict of interest statement

The authors declare no conflict of interest.

Figures

Fig. 1.
Fig. 1.
Return periods of flood heights (relative to the mean sea level of the baseline year 2000) in NYC, estimated for years 1800, 2000, and 2100. The solid blue curve shows the return period of flood heights (also storm surges as RSL = 0 m) for year 2000, estimated based on NCEP reanalysis. Other solid curves show the return period of flood heights for 2100, based on the projected RSL distributions and surge climatology projected by the various climate models(CNRM-CM3, GFDL-CM2.0, ECHAM5, and MIROC3.2). The dashed blue curve shows the return period of flood heights for 2100 based on the projected RSL of 2100 and the NCEP surge climatology (of 2000, neglecting the change of surge climatology from the baseline). The dash-dotted blue curve shows the return period of flood heights for 1800 based on the estimated RSL of 1800 and the NCEP surge climatology (of 2000, neglecting the change of surge climatology). The blue shading shows the 90% confidence interval of the 2000 NCEP curve (the statistical confidence interval for the other curves is similar). The red dashed lines highlight Sandy’s flood height of 2.8 m (horizontal) and Sandy’s estimated return period in 2000 of 398 y (vertical).
Fig. 2.
Fig. 2.
Estimated temporal evolution of Sandy’s return period and flood height and of RSL from year 1800 to 2100 (relative to the sea level of the baseline year 2000). (Top) Return period of Sandy’s flood height of 2.8 m. (Middle) Flood height with Sandy’s estimated return period of 398 y (in 2000). As in Fig. 1, solid curves show the estimates accounting for the change in both RSL and surge climatology, and dashed and dash-dotted blue curves show the estimates accounting for only the change in RSL. (Bottom) Estimated past and projected future RSL (black solid curve, mean; shading, 5% to 95% quantile range). Annual mean sea level observed at the Battery tide gauge is shown by the green curve, and the proxy reconstruction from Barnegat Bay is represented by the red rectangles, showing 2σ vertical and geochronological uncertainties.
Fig. 3.
Fig. 3.
Maximum grain size of event beds from Seguine Pond, Staten Island. D90 is the grain size (in millimeters) where 90% of the grains are finer. Likely storms responsible for each event bed are noted. Labels in black are historically documented hurricanes, and labels in gray are extratropical storms. (In some cases, definitive attribution is difficult because multiple events occur close together in time and, given age model uncertainties, more than one storm is a plausible candidate.) Six of the event deposits from the late 17th to 20th centuries are coarser than the deposit associated with Hurricane Sandy (dashed line). Data were obtained from the proxy record of ref. .

References

    1. Hall TM, Sobel AH. On the impact angle of Hurricane Sandy’s New Jersey landfall. Geophys Res Lett. 2013;40(10):2312–2315.
    1. Brandon CM, Woodruff JD, Donnelly JP, Sullivan RM. How unique was Hurricane Sandy? Sedimentary reconstructions of extreme flooding from New York Harbor. Sci Rep. 2014;4:7366. - PMC - PubMed
    1. Sweet W, Zervas C, Gill S, Park J. Hurricane Sandy inundation probabilities today and tomorrow. Bull Am Meteorol Soc. 2013;94(9):S17–S20.
    1. Lopeman M, Deodatis G, Franco G. Extreme storm surge hazard estimation in lower Manhattan. Nat Hazards. 2015;78(1):1–37.
    1. Nicholls RJ, Cazenave A. Sea-level rise and its impact on coastal zones. Science. 2010;328(5985):1517–1520. - PubMed

Publication types