. 2016 Oct 25;113(43):12214-12219.
doi: 10.1073/pnas.1608016113. Epub 2016 Oct 10.

Gene transfers from diverse bacteria compensate for reductive genome evolution in the chromatophore of Paulinella chromatophora

Affiliations

Gene transfers from diverse bacteria compensate for reductive genome evolution in the chromatophore of Paulinella chromatophora

Eva C M Nowack et al. Proc Natl Acad Sci U S A. .

Abstract

Plastids, the photosynthetic organelles, originated >1 billion y ago via the endosymbiosis of a cyanobacterium. The resulting proliferation of primary producers fundamentally changed global ecology. Endosymbiotic gene transfer (EGT) from the intracellular cyanobacterium to the nucleus is widely recognized as a critical factor in the evolution of photosynthetic eukaryotes. The contribution of horizontal gene transfers (HGTs) from other bacteria to plastid establishment remains more controversial. A novel perspective on this issue is provided by the amoeba Paulinella chromatophora, which contains photosynthetic organelles (chromatophores) that are only 60-200 million years old. Chromatophore genome reduction entailed the loss of many biosynthetic pathways including those for numerous amino acids and cofactors. How the host cell compensates for these losses remains unknown, because the presence of bacteria in all available P. chromatophora cultures excluded elucidation of the full metabolic capacity and occurrence of HGT in this species. Here we generated a high-quality transcriptome and draft genome assembly from the first bacteria-free P. chromatophora culture to deduce rules that govern organelle integration into cellular metabolism. Our analyses revealed that nuclear and chromatophore gene inventories provide highly complementary functions. At least 229 nuclear genes were acquired via HGT from various bacteria, of which only 25% putatively arose through EGT from the chromatophore genome. Many HGT-derived bacterial genes encode proteins that fill gaps in critical chromatophore pathways/processes. Our results demonstrate a dominant role for HGT in compensating for organelle genome reduction and suggest that phagotrophy may be a major driver of HGT.

Keywords: coevolution; endosymbiosis; genome evolution; horizontal gene transfer; organellogenesis.


Conflict of interest statement

The authors declare no conflict of interest.

Figures

Fig. S1.
Fig. S1.
Histogram depicting the probability of observing frequent 31-mers (observed two or more times) in a 10% random subsample of P. chromatophora Illumina HiSeq reads. Reads were truncated to 150 bp from 250 bp to exclude low-quality bases from the analysis. The exponential distribution of k-mer frequencies, as opposed to an expected normal distribution, is indicative of a sequence coverage predominantly derived from unique or nonoverlapping DNA amplicons and evidences low-coverage sequencing of an extremely large genome.
Fig. S2.
Fig. S2.
Forty-seven-kbp genomic contig that encodes all or most of the P. chromatophora mitochondrial genome.
Fig. 1.
Fig. 1.
Metabolic pathways and DNA replication in P. chromatophora. The distribution of chromatophore-encoded (within green rectangles) and nuclear-encoded genes is shown, although the subcellular localization of the gene products is unknown. Numbers associated with chromatophore-encoded enzymes are locus tags for the respective genes (e.g., 1234 represents PCC_1234). Pale lettering/arrows indicate that the gene is missing from the chromatophore genome or absent in nuclear transcriptome data. Circles and rectangles adjacent to the enzymes indicate their phylogenetic origin and targeting prediction (TargetP prediction; mTP and SP predictions with a reliability class <3 are shown), respectively; they are defined immediately below the figure. Multiples of the individual symbols represent the presence of multiple protein versions encoded by the transcript dataset. 3-PGA, 3-phosphoglycerate; PII, the PII nitrogen-sensing protein (see text); PEP, phosphoenolpyruvate; SSB, single-strand binding protein. The pathways shown are for the synthesis of serine and methionine (Ser, Met, A), arginine (Arg, B), peptidoglycan (C) and the precursor of aromatic amino acids (chorismate) and cysteine (Cys, E) as well as for DNA replication (D).
Fig. 2.
Fig. 2.
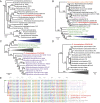
Phylogeny of HGT-derived genes in P. chromatophora. Maximum likelihood phylogenetic trees from amino acid alignments of (A) MurF, (B) PolA, (C) LigA, and (D) AroE. Numbers at the branches represent bootstrap values. Color code: purple, α-; black, β-; and gray, γ-proteobacteria; blue, α-; and green, β-cyanobacteria; orange, thermodesulfobacteria; pink, Eukarya; and red, P. chromatophora. (E) Portion of amino acid alignment of nuclear and chromatophore-encoded copies of P. chromatophora AroE with proteobacterial and cyanobacterial sequences. The tree (left) represents “species” phylogeny based on the ribosomal operon. The lineages are marked as follows: green, S. elongatus; pink, marine Synechococcus clade; blue, Prochlorococcus clade; orange, Cyanobium clade; red, P. chromatophora (nuclear and chromatophore genes); black, β-; and gray, γ-proteobacteria.
Fig. S3.
Fig. S3.
Amino acid biosynthetic pathways in P. chromatophora. The distribution of chromatophore-encoded (within the green rectangle) and nuclear-encoded genes is shown, although the subcellular localization of their gene products is unknown. Numbers associated with chromatophore-encoded enzymes are the locus tags of the respective gene (e.g., 1234 stands for PCC_1234). Represented by dark blue, green, or violet arrows are enzymes involved in biosynthesis of neutral, negatively charged, or basic amino acids, respectively. Pale lettering/arrows indicate that the gene is missing from the chromatophore genome or in the nuclear transcriptome data. The circles and rectangles adjacent to the enzymes indicate their phylogenetic origin and targeting prediction, respectively. Targeting predictions for full-length proteins were obtained using TargetP and mTP and SP predictions with a reliability class (RC) <3 are shown. Multiples of the individual symbols represent the presence of multiple protein versions encoded by the transcript dataset. Question marks indicate uncertainties in enzymatic activity. 3-PGA, 3-phosphoglycerate; PEP, phosphoenolpyruvate; PRPP, 5-phosphoribosyl 1-pyrophosphate; THF, tetrahydrofolate; unspec. TA, unspecific transaminase.
Fig. S4.
Fig. S4.
Nucleotide biosynthetic pathways in P. chromatophora. The distribution of chromatophore-encoded (within the green rectangle) and nuclear-encoded genes is shown, although the subcellular localization of their gene products is unknown. Numbers associated with chromatophore-encoded enzymes are the locus tags of the respective gene (e.g., 1234 stands for PCC_1234). Pale lettering/arrows indicate that the gene is missing from the chromatophore genome or in the nuclear transcriptome data. The circles and rectangles adjacent to the enzymes indicate their phylogenetic origin and targeting prediction, respectively. Targeting predictions for full-length proteins were obtained using TargetP and mTP and SP predictions with a RC <3 are shown. Multiples of the individual symbols represent the presence of multiple protein versions encoded by the transcript dataset.
Fig. S5.
Fig. S5.
Origin of HGT genes (A and B) and functional categories of HGT (C) and EGT genes (D) in the P. chromatophora nuclear genome. (A and B) Total number of bacterial genes identified in this study in the P. chromatophora nuclear transcriptome broken down by their presumptive sources (for explanation of classification of phylogenetic support see Dataset S1). Because gene acquisition was often followed by gene family expansion, the total number of genes (A) is higher than the number of presumed individual transfers (B). (C and D) Numbers of acquired genes broken down by their presumed cellular functions (see also Dataset S1). Because HGT was often followed by gene family expansion, the total number of genes (light gray) is higher than the number of presumed single transfers (dark gray).
Fig. S6.
Fig. S6.
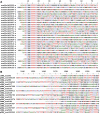
P. chromatophora spliced leader sequences. (A) Thirty typical transspliced transcripts aligned by their SL sequence. (B) Transspliced transcripts aligned with their encoding genes; SL sequences are represented in pale colors.
Fig. S7.
Fig. S7.
ClustalX alignment of cyanobacterial and P. chromatophora PII proteins. Accession numbers are as follows: Cyanobium sp. PCC 7001 (WP 006909858.1); Gloeobacter violaceus (WP 011140260.1); Leptolyngbya sp. PCC 6406 (WP 008313271.1); Microcystis aeruginosa TAIHU98 (ELP55889.1); P. chromatophora CCAC0185 (YP 002048850.1); Prochlorococcus marinus (WP 011133091.1); Prochlorococcus sp. MIT 0601 (WP 036900543.1); Synechococcus sp. WH 5701 (WP 006171995.1); Synechococcus sp. WH 8102 (WP 011127336.1); and Synechocystis sp. PCC 6803 (WP 010873156.1).
Fig. S8.
Fig. S8.
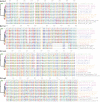
(AD) Synapomorphies in cyanobacterial and in P. chromatophora/bacterial proteins. Portion of amino acid alignments of various cyanobacterial genes with HGT-derived P. chromatophora genes and closely related bacterial gene versions. The tree (left) represents “species” phylogeny based on the ribosomal operon. The lineages are marked as follows: green, S. elongatus; pink, the marine Synechococcus clade; blue, the Prochlorococcus clade; orange, the Cyanobium clade; and red, P. chromatophora. Sequences are arranged according to their position in the rDNA phylogeny. Note the numerous synapomorphies across cyanobacterial gene versions on the one hand and the P. chromatophora gene with bacterial sequences on the other hand.
Fig. 3.
Fig. 3.
Evolution of phototrophy from a phagotrophic ancestor in the Paulinella clade. In step 1a a mixotrophic cell evolved by maintaining a α-cyanobacterial endosymbiont and exploiting its photosynthetic ability. Over time, the host targeted proteins to the symbiont and inserted membrane transporters to gain control over symbiont growth and division, leading to vertical inheritance of the nascent organelle. Step 1b indicates heterotrophic Paulinella species that did not acquire permanent endosymbionts. In step 2 efficient metabolite exchange led to loss of phagotrophy and relaxed functional constraint on many chromatophore genes, leading to massive chromatophore genome reduction. Colored sections represent HGT (multicolor) and EGT (green) components of the nuclear genome; arrow thickness represents prevalence of the particular gene transfer type during different evolutionary stages.

Similar articles

Cited by

References

    1. Falkowski PG, et al. The evolution of modern eukaryotic phytoplankton. Science. 2004;305(5682):354–360. - PubMed
    1. Yoon HS, Hackett JD, Ciniglia C, Pinto G, Bhattacharya D. A molecular timeline for the origin of photosynthetic eukaryotes. Mol Biol Evol. 2004;21(5):809–818. - PubMed
    1. Gould SB, Waller RF, McFadden GI. Plastid evolution. Annu Rev Plant Biol. 2008;59:491–517. - PubMed
    1. Martin W, Herrmann RG. Gene transfer from organelles to the nucleus: How much, what happens, and Why? Plant Physiol. 1998;118(1):9–17. - PMC - PubMed
    1. Schleiff E, Becker T. Common ground for protein translocation: Access control for mitochondria and chloroplasts. Nat Rev Mol Cell Biol. 2011;12(1):48–59. - PubMed

Publication types

LinkOut - more resources