. 2016 Oct 25;113(43):12220-12225.
doi: 10.1073/pnas.1613448113. Epub 2016 Oct 10.

Differential roles of the RNases H in preventing chromosome instability

Affiliations

Differential roles of the RNases H in preventing chromosome instability

Anjali D Zimmer et al. Proc Natl Acad Sci U S A. .

Abstract

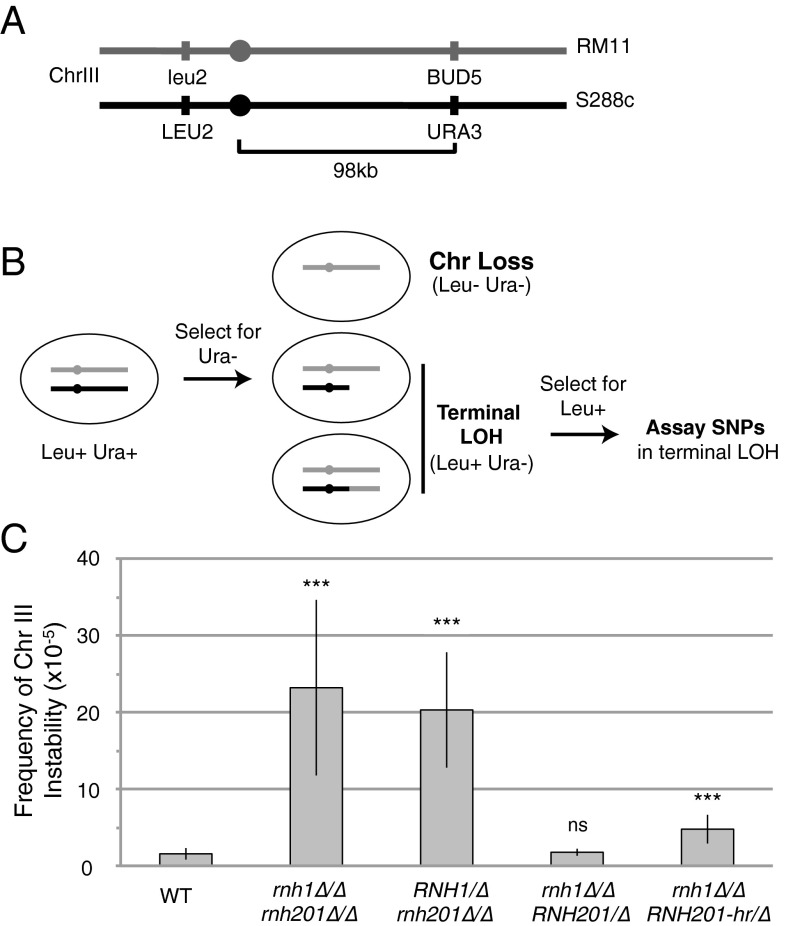
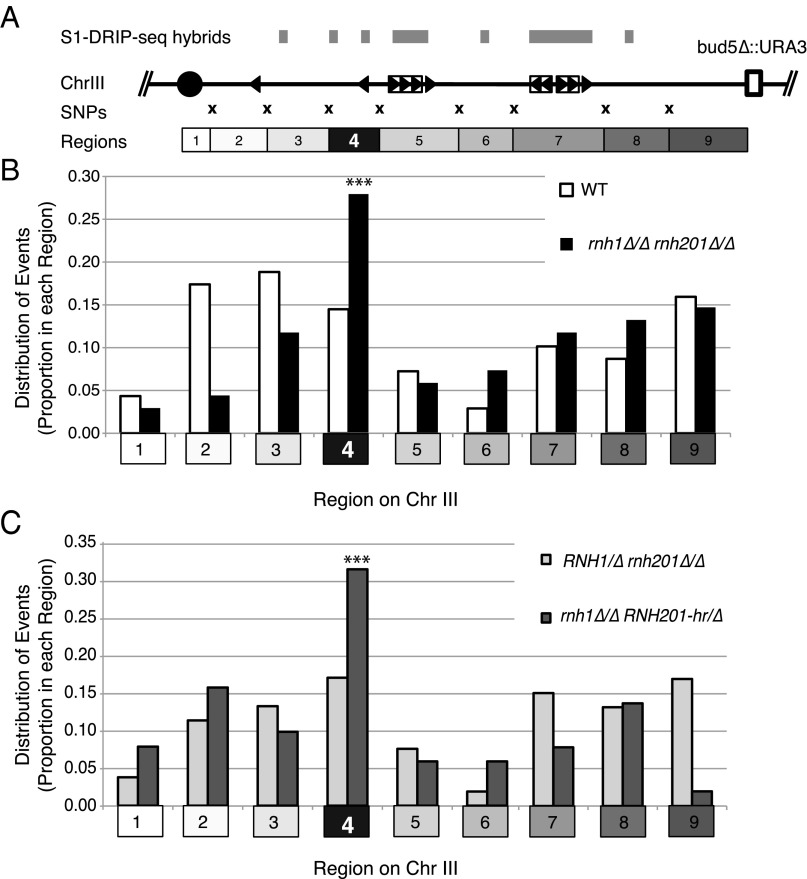
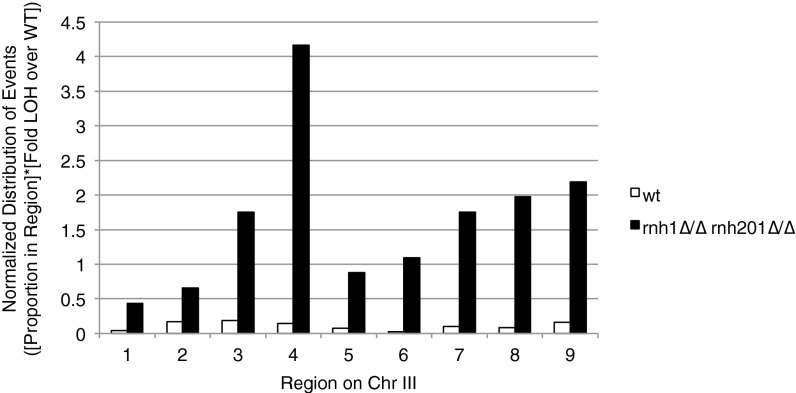
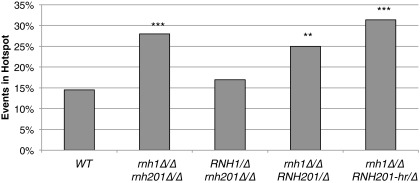
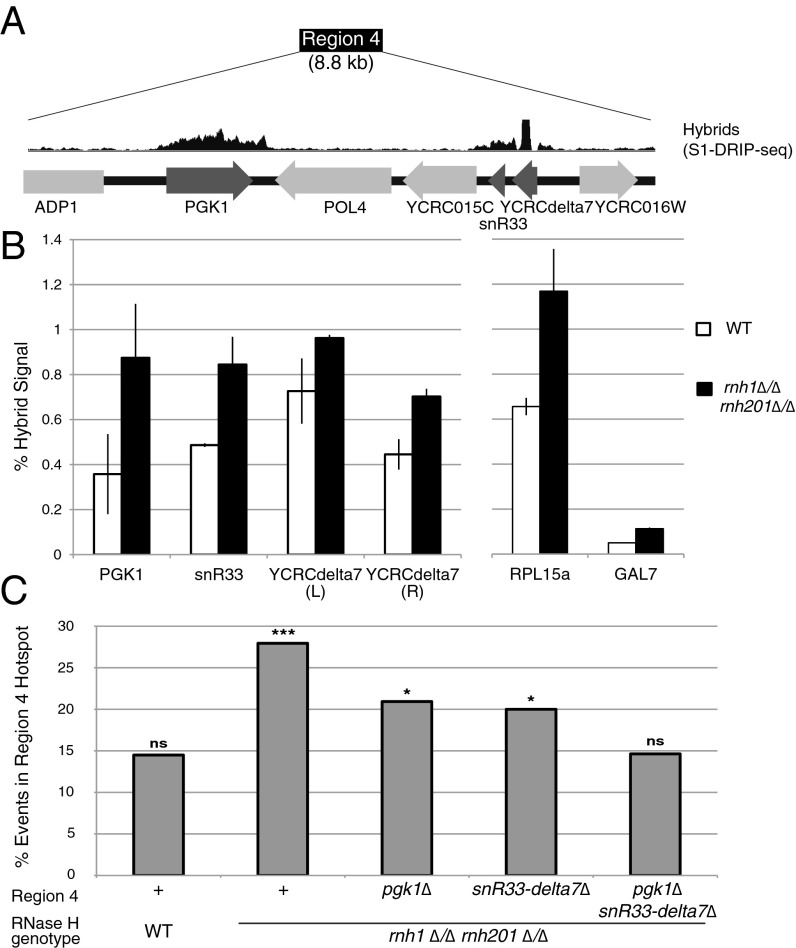
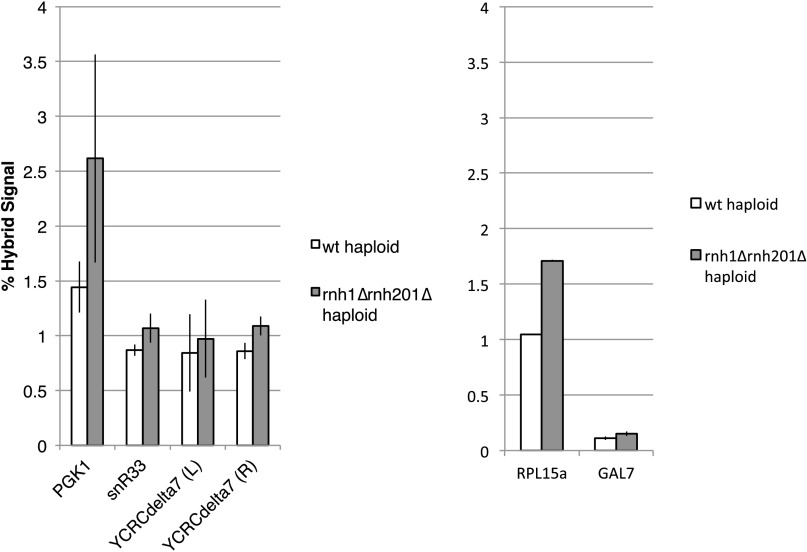
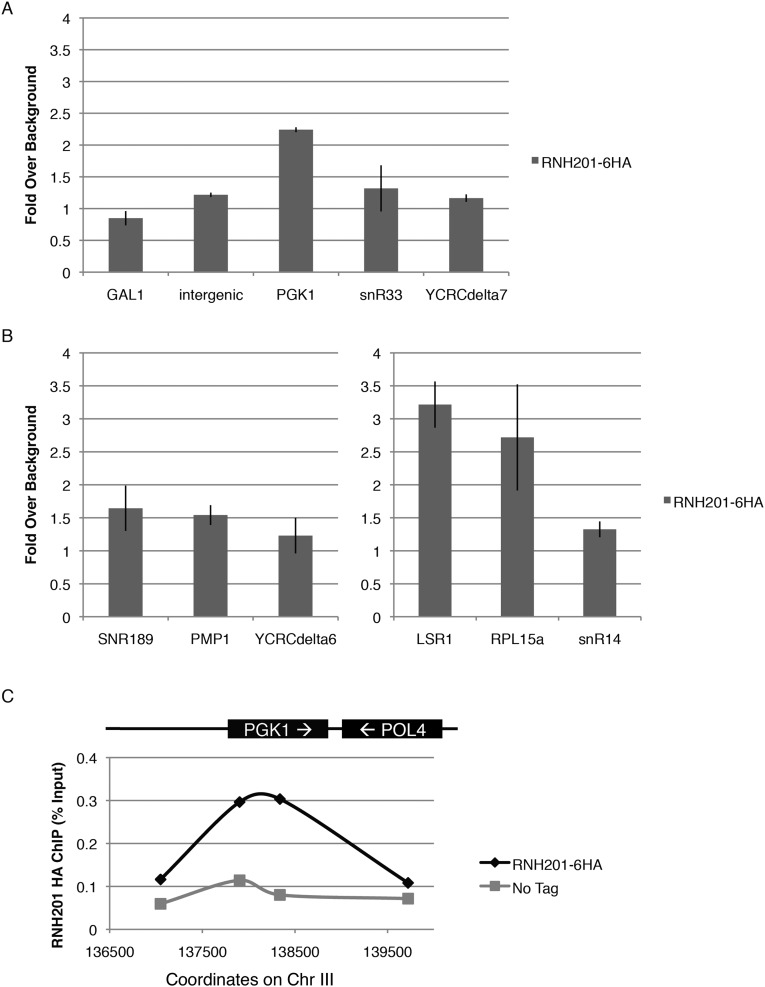
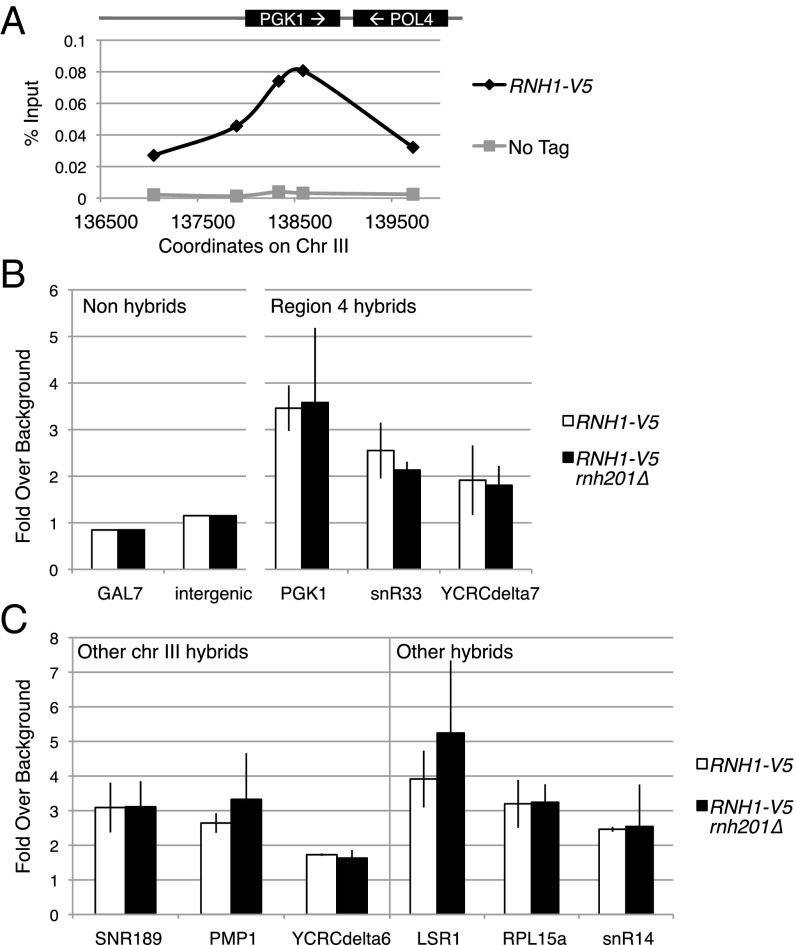
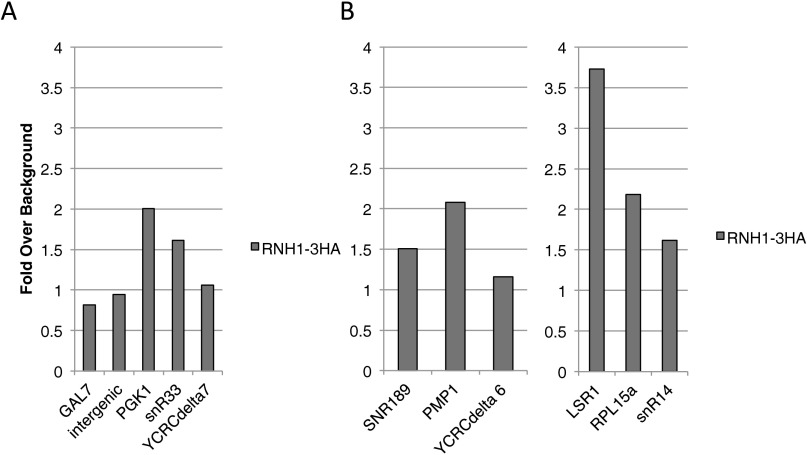
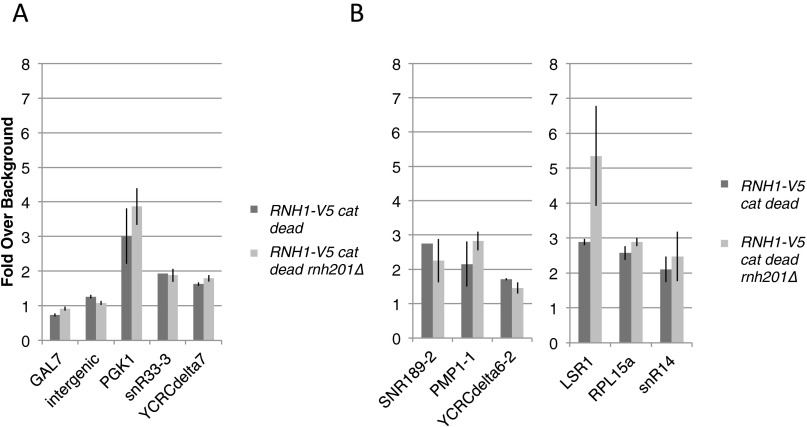
DNA:RNA hybrids can lead to DNA damage and genome instability. This damage can be prevented by degradation of the RNA in the hybrid by two evolutionarily conserved enzymes, RNase H1 and H2. Indeed, RNase H-deficient cells have increased chromosomal rearrangements. However, the quantitative and spatial contributions of the individual enzymes to hybrid removal have been unclear. Additionally, RNase H2 can remove single ribonucleotides misincorporated into DNA during replication. The relative contribution of DNA:RNA hybrids and misincorporated ribonucleotides to chromosome instability also was uncertain. To address these issues, we studied the frequency and location of loss-of-heterozygosity (LOH) events on chromosome III in Saccharomyces cerevisiae strains that were defective for RNase H1, H2, or both. We showed that RNase H2 plays the major role in preventing chromosome III instability through its hybrid-removal activity. Furthermore, RNase H2 acts pervasively at many hybrids along the chromosome. In contrast, RNase H1 acts to prevent LOH within a small region of chromosome III where the instability is dependent upon two hybrid-prone sequences. This restriction of RNase H1 activity to a subset of hybrids is not the result of its constrained localization, because we found it at hybrids genome-wide. This result suggests that the genome-protection activity of RNase H1 is regulated at a step after hybrid recognition. The global function of RNase H2 and the region-specific function of RNase H1 provide insight into why these enzymes with overlapping hybrid-removal activities have been conserved throughout evolution.

Keywords: DNA:RNA hybrids; R-loops; RNase H; chromosome instability; genome instability.


Conflict of interest statement

The authors declare no conflict of interest.

Figures

Fig. 1.
Fig. 1.
Assay for LOH of chromosome III in RNase H mutants. (A) Diagram of chromosome III genetic markers relevant for the LOH assay. (B) Schematic of the workflow of the LOH assay and possible outcomes for chromosome III. The marked S288c-derived chromosome is diagramed in black, and the RM11-derived chromosome is diagrammed in gray. Diploid cells (Leu+ Ura+) are propagated on medium lacking uracil. Individual colonies then are plated onto medium containing 5-FOA, selecting for loss of the URA3 marker. Resultant colonies may have complete chromosome loss or terminal LOH, shown here as a de novo telomere addition and a recombination repair event. Colonies then are replica plated to medium lacking leucine to select for Leu+ colonies. The SNPs of resultant colonies are assayed for heterozygosity by Sanger sequencing. (C) Frequency of LOH in wild-type cells and RNase H mutants. The mean of 40 parent colonies is shown with error bars indicating ±1 SD. Statistical analysis comparing mutants to wild-type using an unpaired t test: ***P < 0.001; ns, not significant at P < 0.1.
Fig. S1.
Fig. S1.
Percent terminal LOH. The percent of colonies that underwent LOH that had terminal LOH events (Leu+, Ura) as opposed to whole chromosome loss (Leu, Ura) in wild-type and RNase H mutants.
Fig. 2.
Fig. 2.
Distribution of LOH junctions. (A) Diagram of the region of the right arm of chromosome III assayed for LOH junctions. The first row shows the locations of hybrid-prone sequences mapped in ref. . The second line shows chromosome III with the centromere diagramed as a circle, Ty elements diagrammed as boxed triangles, solo delta elements as triangles, and the location of the URA3 marker inserted at the BUD5 locus shown as a square. The third row shows the locations of the SNPs (marked as “X”) assayed for heterozygosity. The fourth row shows the nine regions in which LOH junctions may occur. (B and C) Locations of LOH boundaries. Boundaries in wild-type cells (n = 69) and RNase H double-mutant cells (n = 68) (B) and RNase H2-deficient cells (n = 53) and H1-deficient cells (n = 51) (C) were mapped. The proportion of LOH boundaries occurring in each of the nine regions is plotted. ***P < 0.001; χ2 test.
Fig. S2.
Fig. S2.
Chromosome III size in colonies that have undergone terminal LOH. (Upper) An ethidium bromide-stained pulsed-field electrophoresis gel. (Lower) A Southern blot of that gel with a probe against LEU2, which probes for the S288c-derived chromosome III homolog. Chromosomes are shown for wild-type (lanes 1–2 and 2728), rnh1∆/∆ rnh201∆/∆ (lanes 3–12 and 25–26), rnh1∆/∆ RNH201/∆ (lanes 13–17 and 21–24), and RNH1/rnh201∆/∆ (lanes 17–20). The parental size of chromosome III in a non-rearranged cell is shown in the rightmost lane 29.
Fig. S3.
Fig. S3.
Normalized distribution of LOH boundaries. The distribution of LOH boundary events in each SNP-defined interval was normalized to the fold frequency of LOH in RNase H-deficient cells over wild-type cells.
Fig. S4.
Fig. S4.
LOH boundary events in the region 4 hotspot. The percent of LOH boundary events in the region 4 hotspot in wild-type and RNase H mutants. RNase H1-deficient cells with either wild-type RNH201 or RNH201-hr display an instability hotspot. ***P < 0.001; **P < 0.01; χ2 test.
Fig. 3.
Fig. 3.
Characterization of hybrid-prone sequences in the region 4 hotspot. (A) Diagram of the region 4 hotspot. Hybrids by S1-DRIP-seq reads (9) are shown above sequence features. (B) Hybrid signal by DRIP-qPCR. Hybrid signals (as percent input) at hybrid-prone sequences in the hotspot [PGK1, snR33, unique sequences just left (L) and right (R) of YCRCdelta7, another known hybrid-prone sequence (RPL15a), and a non–hybrid-prone sequence (GAL7)] are shown. Error bars indicate ±1 SD. (C) Percent of LOH boundary events in the region 4 hotspot in wild-type and RNase H double-mutants with deletions of hybrid-forming sequences. ***P < 0.001; *P < 0.01; ns, not significant at P < 0.1 using the χ2 test.
Fig. S5.
Fig. S5.
Hybrid signal in haploids. Hybrid signal by DRIP-qPCR in S288c haploids. Hybrid signals are shown at hybrid-prone sequences in the hotspot (Left) and at another known hybrid-prone sequence (RPL15a) and at a non–hybrid-prone sequence (GAL7) (Right). Error bars indicate ±1 SD.
Fig. S6.
Fig. S6.
Localization of RNase H2. (A and B) Enrichment of Rnh201 with the 6×HA tag at the region 4 hotspot (A) and at other hybrid-prone loci (B). Fold enrichment over nonhybrid background loci is shown. Two of these background loci (GAL7 and an intergenic sequence upstream of RGS2) are shown. Error bars indicate ±1 SD. (C) Percent enrichment of HA in HA-tagged Rnh201 and untagged cells at primers in the hybrid-prone PGK1 locus and in up- and downstream non–hybrid-prone loci.
Fig. 4.
Fig. 4.
RNase H1 localization by ChIP. (A) Percent enrichment of V5 in V5-tagged Rnh1 cells and untagged cells at primers in the hybrid-prone PGK1 locus and up- and downstream non–hybrid-prone loci. (B and C) Enrichment of Rnh1 at the region 4 hotspot (B) and at other hybrid-prone loci (C) in wild-type and rnh201∆ cells. Fold enrichment over nonhybrid background loci is shown. Two of these background loci (GAL7 and an intergenic sequence upstream of RGS2) are shown in B. Error bars indicate ±1 SD.
Fig. S7.
Fig. S7.
Localization of RNase H1 with an HA tag. (A and B) Enrichment of Rnh1 with 3×HA at the region 4 hotspot (A) and at other hybrid-prone loci (B). Fold enrichment over nonhybrid background loci is shown. Two of these background loci (GAL7 and an intergenic sequence upstream of RGS2) are shown.
Fig. S8.
Fig. S8.
Localization of RNase H1 catalytically dead mutant. (A and B) Enrichment of the Rnh1 catalytically dead mutant at the region 4 hotspot (A) and other hybrid-prone loci (B) in wild-type and rnh201∆ cells. Fold enrichment over nonhybrid background loci is shown. Two of these background loci (GAL7 and an intergenic sequence upstream of RGS2) are shown. Error bars indicate ±1 SD.

References

    1. Santos-Pereira JM, Aguilera A. R loops: New modulators of genome dynamics and function. Nat Rev Genet. 2015;16(10):583–597. - PubMed
    1. Cerritelli SM, Crouch RJ. Ribonuclease H: The enzymes in eukaryotes. FEBS J. 2009;276(6):1494–1505. - PMC - PubMed
    1. Wahba L, Amon JD, Koshland D, Vuica-Ross M. RNase H and multiple RNA biogenesis factors cooperate to prevent RNA:DNA hybrids from generating genome instability. Mol Cell. 2011;44(6):978–988. - PMC - PubMed
    1. O’Connell K, Jinks-Robertson S, Petes TD. Elevated genome-wide instability in yeast mutants lacking RNase H activity. Genetics. 2015;201(3):963–975. - PMC - PubMed
    1. Conover HN, et al. Stimulation of chromosomal rearrangements by ribonucleotides. Genetics. 2015;201(3):951–961. - PMC - PubMed

Publication types

MeSH terms