. 2016 Oct 25;113(43):12250-12255.
doi: 10.1073/pnas.1600067113. Epub 2016 Oct 10.

Notch3 drives development and progression of cholangiocarcinoma

Affiliations

Notch3 drives development and progression of cholangiocarcinoma

Rachel V Guest et al. Proc Natl Acad Sci U S A. .

Abstract

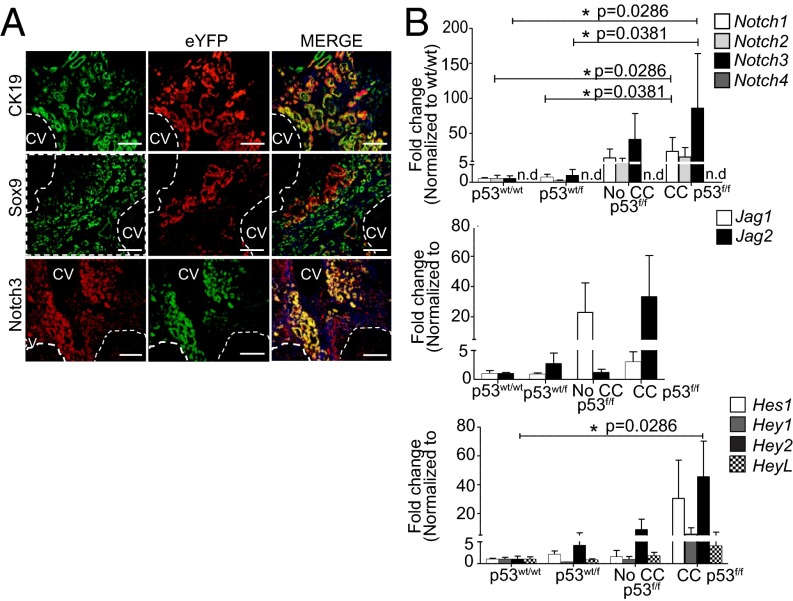
The prognosis of cholangiocarcinoma (CC) is dismal. Notch has been identified as a potential driver; forced exogenous overexpression of Notch1 in hepatocytes results in the formation of biliary tumors. In human disease, however, it is unknown which components of the endogenously signaling pathway are required for tumorigenesis, how these orchestrate cancer, and how they can be targeted for therapy. Here we characterize Notch in human-resected CC, a toxin-driven model in rats, and a transgenic mouse model in which p53 deletion is targeted to biliary epithelia and CC induced using the hepatocarcinogen thioacetamide. We find that across species, the atypical receptor NOTCH3 is differentially overexpressed; it is progressively up-regulated with disease development and promotes tumor cell survival via activation of PI3k-Akt. We use genetic KO studies to show that tumor growth significantly attenuates after Notch3 deletion and demonstrate signaling occurs via a noncanonical pathway independent of the mediator of classical Notch, Recombinant Signal Binding Protein for Immunoglobulin Kappa J Region (RBPJ). These data present an opportunity in this aggressive cancer to selectively target Notch, bypassing toxicities known to be RBPJ dependent.

Keywords: Notch; bile duct; cancer; cholangiocarcinoma; noncanonical.


Conflict of interest statement

The authors declare no conflict of interest.

Figures

Fig. 1.
Fig. 1.
Notch3 is differentially activated in human CC. (A) Volcano plot of rt-PCR Notch array in human CC and patient-matched liver (n = 5, n = 5). Gray line represents P value of 0.05. Red labels, up-regulation at least fourfold; green, down-regulation at least fourfold. (B) Notch expression in human CC (n = 48) and healthy liver (n = 42) (RT-PCR). Medians compared with Mann–Whitney U test. (C) Tissue microarray human CC (n = 77) and noncancerous liver (n = 47). Representative Notch1 and Notch3 immunostaining (positive and isotype controls; Fig. S1 B and C). Filled arrowheads, Notch3+ ductules and vascular smooth muscle in healthy liver. Pixel analysis of CC and controls compared with Mann–Whitney U test. (D) Dual fluorescence of Notch3 (green) in human CC with αSMA, CD31+, or CD68+ (red) (Scale bar, 100 µm.) (E) N3-ICD (green) in human CC (white filled arrowheads). (Scale bar, 50 µm.) Data are means ± SEM. *P ≤ 0.05, **P ≤ 0.01, ***P ≤ 0.001.
Fig. S1.
Fig. S1.
Supporting data for Notch expression in human liver and cholangiocarcinoma. (A) Immunofluorescent staining of Notch1 (red) and Notch3 (red) in healthy human liver (counterstained with DAPI). (Scale bars, 100 µm.) (B) Positive control for Notch1 staining: liver from AhCre+Mdm2fl/fl mice (day 3 after induction) that demonstrate a florid Notch1-driven progenitor reaction in response to large-scale hepatocyte senescence (27). Notch1 is observed around blood vessels and ductules. (C) Rabbit isotype controls for immunohistochemical staining of Notch1 and Notch3 in Fig. 1C (antibodies to Notch1 and Notch3 both raised in rabbit). (D) Notch3 immunostaining of tissue microarray of human CC and noncancerous liver controls. Filled arrowheads indicate stromal Notch3 positivity. (E) Immunoblot for Notch3 intracellular domain (N3-ICD) in human CC and patient-matched noncancerous liver lysates (samples as in Fig. 1A). Blots were probed for β-actin as loading control to which N3-ICD signal was standardized for densitometric analysis. (F) Jagged1 (red) expression in human CC in the tumor-associated stroma. (Scale bars, 100 µm.) All data are expressed as mean ± SEM. *P ≤ 0.05.
Fig. 2.
Fig. 2.
Notch3 is differentially up-regulated during CC development. (A) PCR Notch pathway array in rats after 600 mg/L TAA for 8–10 wk (inflamed) (n = 6) vs. control (Left) and 24–26 wk (adenocarcinoma) (n = 6) vs. control (n = 6) (Right). Red labels, at least fourfold up-regulation; green, at leat fourfold down-regulation. (B) qRT-PCR of Notch expression in TAA rat liver normalized to uninjured controls at 8–10 (inflamed), 12–14 (fibrotic), 20 (early malignant), and 26 wk (late malignant) (n = 3; n = 6 control). (C) IHC of TAA time course. CK19 (DAB). Notch3, green; Jagged1, red; αSMA, green. (Scale bar, 100 µm.)
Fig. S2.
Fig. S2.
Time course of rat model of TAA-induced liver injury with bile duct carcinogenesis. Representative H&E-stained liver sections from the TAA time course (at 10, 14, 16, 22, and 26 wk) and uninjured rat controls. (Scale bars, 100 µm.)
Fig. 3.
Fig. 3.
Pan-inhibition of Notch reduces CC progression. (A) Tiled low power photomicrographs of rat liver after TAA with DAPT or vehicle during weeks 21–26. (Scale bar, 100 mm.) (B) (Left) Proportion of liver infiltrated by CC after DAPT (n = 8) vs. vehicle (n = 10) (P = 0.0148). (Right) Tumor number in rats treated with DAPT or vehicle (P = 0.2856). Data are means ± SEM. Medians compared with Mann–Whitney U test (*P ≤ 0.05). (C) High- and low-power H&E sections of rat liver after vehicle (Upper) or TAA (Lower). Dashed lines are tumor boundary. (D) Ki67 immunostaining and quantification of rat liver sections after vehicle or TAA. (Scale bar, 100 µm.) Number of Ki67-positive tumor cells per ×40 field (30 fields per rat) compared using Student t test. *P ≤ 0.05, **P ≤ 0.01, ***P ≤ 0.001.
Fig. S3.
Fig. S3.
Supporting data for rat CC model treated with Notch inhibitor. (A) Rats had 26 wk of injury with TAA and thrice weekly 10 mg/kg DAPT (n = 8) or vehicle (n = 10) during weeks 21–26. (B) Serum biochemical markers of liver injury and function in rats treated with DAPT or vehicle [bilirubin, P = 0.2848; alanine aminotransferase (ALT), P = 0.3494; aspartate aminotransferase (AST), P = 0.0676; AlkPhos, P = 0.5148; albumin, P = 0.7528] (data are represented as means ± SEM). (C) Liver-to-body weight ratio of rats treated with DAPT or vehicle (P = 0.0121). (D) Representative Notch3 DAB immunostaining in TAA + vehicle– and TAA + DAPT–treated rats. Filled arrows denote N3-ICD positivity. (Scale bars, 100 µm.)
Fig. 4.
Fig. 4.
Notch3 is overexpressed in a transgenic mouse model of CC. (A) Cofluorescence of CK19 (green) and eYFP (red) (Top); Sox9 (green) and eYFP (red) (Middle), and Notch3 (red) with eYFP (green) (Bottom) in CC foci from CK19CreERTR26ReYFPp53f/f mice after 26-wk TAA (CV, central vein; dashed line tumor boundary) (Scale bar, 100 µm.) (B) qRT-PCR of whole liver from CK19CreYFPp53f/f mice after 26-wk TAA. Comparisons between single groups are represented on a single graph for clarity; however, individual Mann–Whitney U tests used to compare individual genes between genotypes (p53wt/wt, n = 4; p53wt/f, n = 6; p53f/f no CC, n = 3; p53f/f with CC, n = 4) Data are means ± SEM.
Fig. S4.
Fig. S4.
Characterization of CK19CreERT eYFPp53 CC mouse model. Representative photomicrographs of H&E-stained livers from CK19CreERT eYFPp53wt/wt, CK19CreERT eYFPp53wt/f, and CK19CreERT eYFPp53f/f mice following 26 wk of TAA or vehicle (n = 5/group). (Scale bars, 100 µm.)
Fig. 5.
Fig. 5.
Genetic deletion of Notch3 reduces CC formation and progression. (A) Photographs and tiled low-power photomicrographs of livers from CK19CreYFPp53f/fN3+/+ (n = 9) and CK19CreYFPp53f/fN3+/− mice (n = 8) after 26-wk TAA. (Scale bar, 100 mm.) (B) Tumor number and total and % infiltrated liver area in N3+/+, N3+/−, and N3−/− mice after 26-wk TAA. Comparisons made with one-way ANOVA and Dunn’s multiple comparison test for post hoc analyses. (C) Representative H&E-, pan-CK–, and pERK-stained sections from N3+/+, N3+/−, and N3−/− mice after 26-wk TAA. Dashed line, tumor boundary. (Scale bar, 100 µm.) (D) Tumor mass and volume of NOTCH3 shRNA xenografts (n = 6) vs. scrambled control (n = 11). *P ≤ 0.05, **P ≤ 0.01, ***P ≤ 0.001.
Fig. S5.
Fig. S5.
Supporting data for in vivo and in vitro Notch3 inhibition experiments. (A) Area of sampled liver from CK19CreYFPp53f/fN3+/+ and CK19CreYFPp53f/fN3+/− mice for analysis of tumor burden following 26 wk of TAA. (B) qRT-PCR data for Notch receptor expression in CK19CreYFPp53f/fN3+/+, N3+/−, and N3−/− mice after 26-wk TAA. Data are mean ± SEM. (C) Kaplan–Meier survival analyses of CK19CreYFPp53f/fN3+/+-, CK19CreYFPp53f/fN3+/−, CK19CreYFPp53f/fN3−/−, and CK19CreYFPp53f/fN1f/f mice during 26 wk of TAA injury. (D) Immunocytochemistry of Notch 1, 2, 3, and 4 and Jagged1 in human CC lines; CC-LP-1, CC-SW-1, and SNU-1079 with isotype controls. Counterstained with DAPI. (Scale bars, 50 µm.) (E) NOTCH3 gene expression in human CC cells (CC-LP-1) following transfection and puromycin selection of NOTCH3 shRNA and scrambled sequence and untransfected controls. (F) NOTCH3 and N3-ICD immunoblots of CC cells (CC-LP-1) following transfection and puromycin selection of NOTCH3 shRNA and scrambled sequence and untransfected controls. Clone 1 was taken forward for further analysis as a Notch3 knockdown cell line. (G) HES/HEY expression in NOTCH3 knockdown human CC cells (clone1 from C and D; fold change: HES1, +1.4-fold, P = 0.7922; HES4, −5.1-fold, P = 0.0303; HEY1, −15.58-fold, P = 0.1775; HEY2, −9.16-fold, P = 0.0043; HEYL, −6.03-fold, P = 0.0823). (H) MTT viability assessment of Notch3 WT, scrambled control, and Notch3 knockdown human CC cells following 72 h of culture at a cell density of 1.0 × 10⁵ cells/mL (n = 6 per group; comparison made between N3 KD cells and scrambled shRNA control). (I) Assessment of neoangiogenesis using CD31+ immunostaining and quantification in human CC xenografts from NOTCH3 KD cells compared with scrambled controls (n = 6/group). Data are mean ± SEM. *P ≤ 0.05; **P ≤ 0.01; ***P ≤ 0.001.
Fig. 6.
Fig. 6.
Genetic silencing of Notch3, but not RBPJ, reduces PI3k-AKT transcription. (A) Human (CC-LP-1) cells transfected with NOTCH3 or RBPJ siRNA and analyzed with oncogene PCR array. Three independent siRNA sequences were used, and RNA was pooled from three replicate wells for each sequence. Gene expression measured 48 h after transfection and compared with scrambled controls (dotted line represents no change in transcription). Genes in color are at least fourfold down-regulated. (B) IHC of pAKT(Thr308), pmTor, and pS6 with pixel analysis in Notch3 shRNA/scrambled CC-LP-1 xenografts. (Scale bar, 100 µm.)
Fig. S6.
Fig. S6.
Data supporting efficacy of NOTCH3 and RBPJ knockdown in siRNA experiments. (A) qRT-PCR and immunoblots of NOTCH3 and RBPJ expression in human CC cells (CC-LP-1) 48 h following transfection with NOTCH3 and RBPJ siRNA, respectively, with comparison with scrambled sequences and untransfected controls. Comparisons between groups performed using Kruskal–Wallis test. (B) qRT-PCR analysis of HES/HEY gene family expression in CC cells 48 h following transfection with NOTCH3 or RBPJ siRNA or scrambled and untransfected controls. Data are expressed as mean ± SEM in A and as single measurements of gene expression (qRT-PCR performed in triplicate) in C. *P ≤ 0.05; **P ≤ 0.01; ***P ≤ 0.001. (C) AKT target gene expression in xenografted Notch3 shRNA CC cells and scrambled controls. *P ≤ 0.05, **P ≤ 0.01.
Fig. 7.
Fig. 7.
Genetic silencing of Notch3 reduces activity through the PI3k-AKT cascade. Immunoblots and corresponding densitometry for p-Akt, p-mTor, p-S6, and p-p70 S6k from CK19CreYFPp53f/fN3+/+ and CK19CreYFPp53f/fN3+/− livers after TAA. *P ≤ 0.05.
Fig. S7.
Fig. S7.
Supporting data for the role of PI3K/AKT pathway in Notch3 driven cholangiocarcinogenesis. (A) AKT target expression in CK19CreYFPp53f/fN3+/+ and CK19CreYFPp53f/fN3+/− mice after 26 wk of TAA. (B) CC xenograft size after 14-d treatment with the PI3k inhibitor PI-103 (30 mg/kg) or vehicle. *P ≤ 0.05.

References

    1. Zong Y, et al. Notch signaling controls liver development by regulating biliary differentiation. Development. 2009;136(10):1727–1739. - PMC - PubMed
    1. Boulter L, et al. Macrophage-derived Wnt opposes Notch signaling to specify hepatic progenitor cell fate in chronic liver disease. Nat Med. 2012;18(4):572–579. - PMC - PubMed
    1. Ortica S, Tarantino N, Aulner N, Israel A, Gupta-Rossi N. The 4 Notch receptors play distinct and antagonistic roles in the proliferation and hepatocytic differentiation of liver progenitors. FASEB J. 2014;28(2):603–614. - PubMed
    1. Mazur PKEH, et al. Notch2 is required for progression of pancreatic intraepithelial neoplasia and development of pancreatic ductal adenocarcinoma. Proc Natl Acad Sci USA. 2010;107(30):13438–13443. - PMC - PubMed
    1. Font-Burgada J, et al. Hybrid periportal hepatocytes regenerate the injured liver without giving rise to cancer. Cell. 2015;162(4):766–779. - PMC - PubMed

Publication types

Substances

LinkOut - more resources