. 2016 Oct 25;113(43):12286-12291.
doi: 10.1073/pnas.1525309113. Epub 2016 Oct 10.

Functional connectivity with the retrosplenial cortex predicts cognitive aging in rats

Affiliations

Functional connectivity with the retrosplenial cortex predicts cognitive aging in rats

Jessica A Ash et al. Proc Natl Acad Sci U S A. .

Abstract

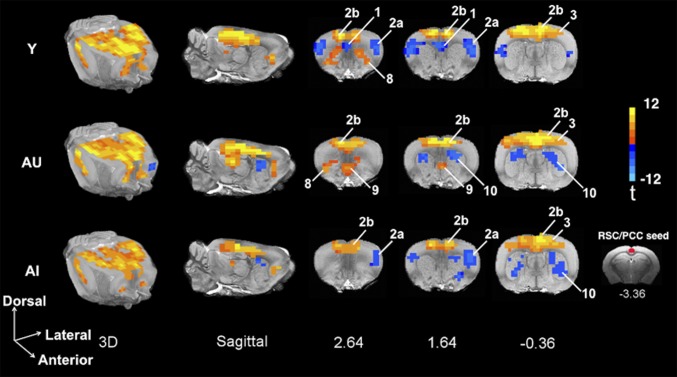
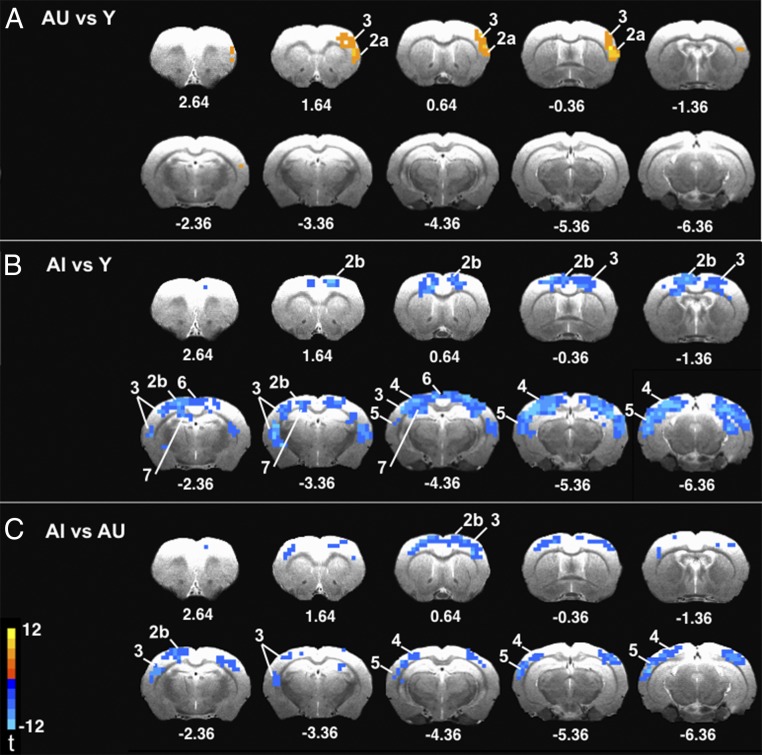
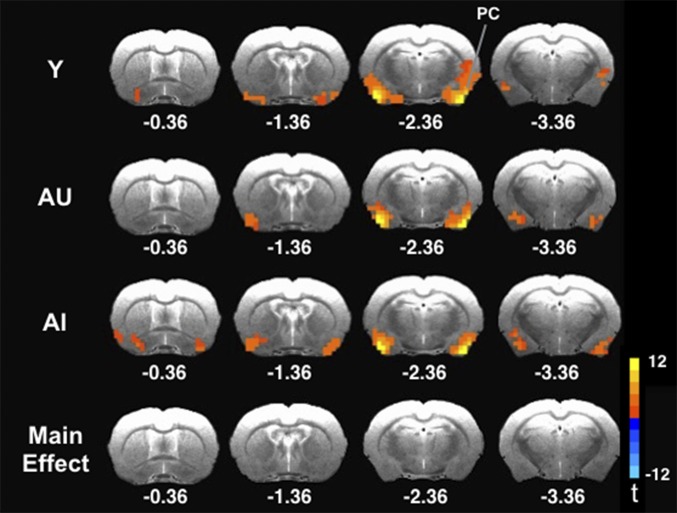
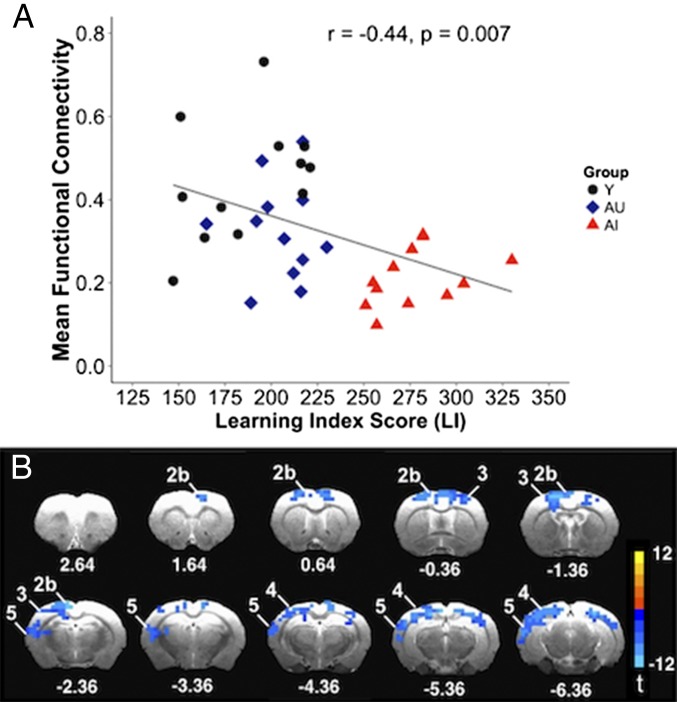
Changes in the functional connectivity (FC) of large-scale brain networks are a prominent feature of brain aging, but defining their relationship to variability along the continuum of normal and pathological cognitive outcomes has proved challenging. Here we took advantage of a well-characterized rat model that displays substantial individual differences in hippocampal memory during aging, uncontaminated by slowly progressive, spontaneous neurodegenerative disease. By this approach, we aimed to interrogate the underlying neural network substrates that mediate aging as a uniquely permissive condition and the primary risk for neurodegeneration. Using resting state (rs) blood oxygenation level-dependent fMRI and a restrosplenial/posterior cingulate cortex seed, aged rats demonstrated a large-scale network that had a spatial distribution similar to the default mode network (DMN) in humans, consistent with earlier findings in younger animals. Between-group whole brain contrasts revealed that aged subjects with documented deficits in memory (aged impaired) displayed widespread reductions in cortical FC, prominently including many areas outside the DMN, relative to both young adults (Y) and aged rats with preserved memory (aged unimpaired, AU). Whereas functional connectivity was relatively preserved in AU rats, they exhibited a qualitatively distinct network signature, comprising the loss of an anticorrelated network observed in Y adults. Together the findings demonstrate that changes in rs-FC are specifically coupled to variability in the cognitive outcome of aging, and that successful neurocognitive aging is associated with adaptive remodeling, not simply the persistence of youthful network dynamics.

Keywords: default mode network; functional connectivity; neurocognitive aging; rat model; resting-state fMRI.


Conflict of interest statement

The authors declare no conflict of interest.

Figures

Fig. 1.
Fig. 1.
LI scores from MWM performance for individual Y (n = 12, black circle), AU (n = 12, blue diamond), and AI (n = 12, red triangle) rats. Aged animals with scores comparable to values for young rats in this model were classified as AU, whereas aged animals with scores outside the normative Y distribution were classified as AI, reflecting less accurate searching in the vicinity of the escape platform across probe trials.
Fig. S1.
Fig. S1.
Mean body weight (+SEM) for Y (n = 12), AU (n = 12), and AI (n = 12) animals. An ANOVA showed no significant differences between groups (P > 0.05).
Fig. S2.
Fig. S2.
Box plots of median heart rate (beats per minute, bpm) during rs-fMRI scans for Y (n = 12), AU (n = 12), and AI (n = 12) animals. A Mann–Whitney test showed no significant differences between AU and AI groups (P > 0.05).
Fig. S3.
Fig. S3.
Box plot of median respiration rate (breaths per minute, bpm) during rs-fMRI scans for Y (n = 12), AU (n = 12), and AI (n = 12) animals. A Mann–Whitney test showed a trend toward differences between the AU and AI groups (P = 0.053).
Fig. 2.
Fig. 2.
Maps of mean FC for Y, AU, and AI rats based on a region of interest analysis using a seed (Bottom Right) in the RSC/PCC. In all groups, the maps (Left) reveal a network qualitatively similar to the rodent DMN homolog described previously in young rats and other species (Results). The 2D slices (Right) illustrate the distribution of both positive (red-yellow) and anticorrelated (blue) networks at three anterior–posterior levels in the Y, AU, and AI groups (Fig. 4). All P < 0.05 are corrected for multiple comparisons. Key: 1, cingulate cortex; 2a, insular cortex; 2b, motor cortex; 3, somatosensory cortex; 8, orbitofrontal cortex; 9, infralimbic/prelimbic cortex; and 10, caudate putamen. Coordinates represent distance relative to bregma (in millimeters).
Fig. 3.
Fig. 3.
A significant main effect of group revealed differences in FC with the RSC/PCC (P < 0.05, corrected for multiple comparisons) of five clusters: 1, cingulate cortex; 2b, motor cortex; 3, somatosensory cortex; 4, posterior parietal cortex/secondary visual cortex; and 5, dorsal auditory cortex/temporal association cortex. Coordinates represent distance relative to bregma (in milliliters).
Fig. 4.
Fig. 4.
Contrast maps plotting the distribution of significant differences in FC with the RSC/PCC (P < 0.05, corrected for multiple comparisons). (A) AU vs. Y. (B) AI vs. Y. (C) AI vs. AU. Whereas AI rats showed prominent reductions in connectivity compared with Y rats, distributed across both DMN and non-DMN areas, AU animals showed relatively preserved positive FC, together with a loss of an anticorrelated network observed in Y. Key: 2a, insular cortex; 2b, motor cortex; 3, somatosensory cortex; 4, posterior parietal cortex/secondary visual cortex; 5, dorsal auditory cortex/temporal association cortex; 6, retrosplenial cortex; and 7, hippocampus. Coordinates represent distance relative to bregma (in milliliters).
Fig. S4.
Fig. S4.
Maps of mean FC with the PC for Y, AU, and AI rats, and the distribution of main-group effects (Bottom row). There were no significant group differences in FC in this analysis (P > 0.05).
Fig. 5.
Fig. 5.
Results from a linear regression showing (A) scatterplot of the correlation between mean functional connectivity with the RSC/PCC and spatial memory performance (LI score) for all Y (black circle), AU (blue diamond), or AI (red triangle) rats; and (B) the distribution of regions showing significant associations (P < 0.05, corrected for multiple comparisons). Although poor spatial learning was associated with low FC across a variety of regions that displayed significant functional connectivity reductions in the AI group, correlations computed for each group considered separately were not statistically significant. Fig. 4 shows key. Coordinates represent distance relative to bregma (in milliliters).

References

    1. Raichle ME, et al. A default mode of brain function. Proc Natl Acad Sci USA. 2001;98(2):676–682. - PMC - PubMed
    1. Greicius MD, Krasnow B, Reiss AL, Menon V. Functional connectivity in the resting brain: A network analysis of the default mode hypothesis. Proc Natl Acad Sci USA. 2003;100(1):253–258. - PMC - PubMed
    1. Buckner RL, Andrews-Hanna JR, Schacter DL. The brain’s default network: Anatomy, function, and relevance to disease. Ann N Y Acad Sci. 2008;1124:1–38. - PubMed
    1. Biswal B, Yetkin FZ, Haughton VM, Hyde JS. Functional connectivity in the motor cortex of resting human brain using echo-planar MRI. Magn Reson Med. 1995;34(4):537–541. - PubMed
    1. Hampson M, Driesen NR, Skudlarski P, Gore JC, Constable RT. Brain connectivity related to working memory performance. J Neurosci. 2006;26(51):13338–13343. - PMC - PubMed

Publication types

LinkOut - more resources