. 2016 Oct 25;113(43):E6649-E6658.
doi: 10.1073/pnas.1611445113. Epub 2016 Oct 10.

A conserved αβ transmembrane interface forms the core of a compact T-cell receptor-CD3 structure within the membrane

Affiliations

A conserved αβ transmembrane interface forms the core of a compact T-cell receptor-CD3 structure within the membrane

Logesvaran Krshnan et al. Proc Natl Acad Sci U S A. .

Abstract

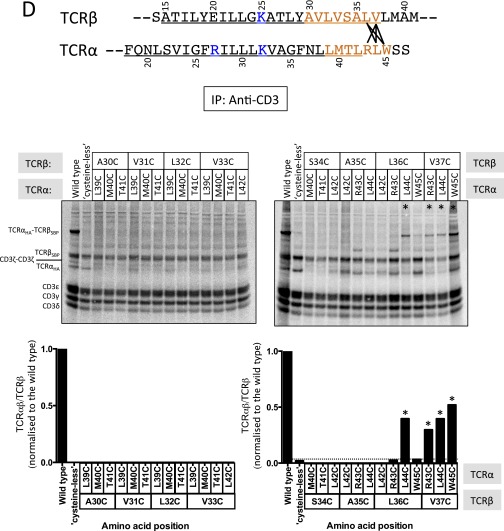
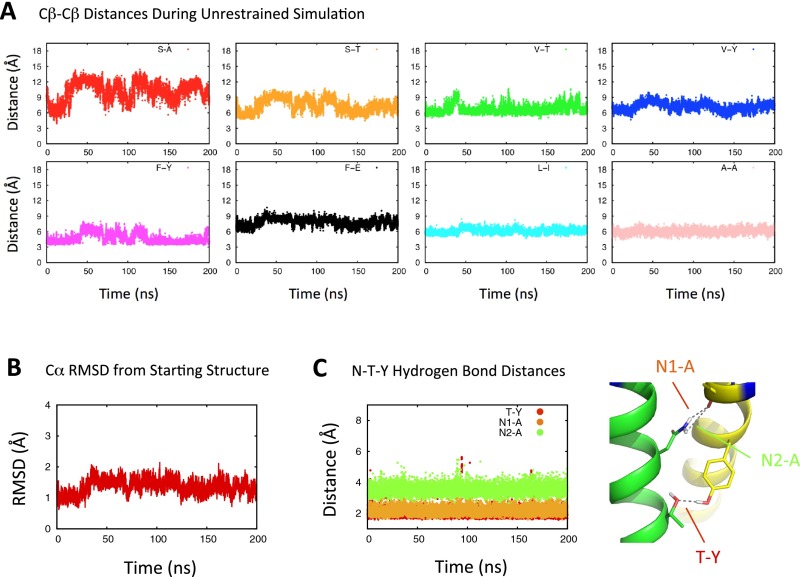
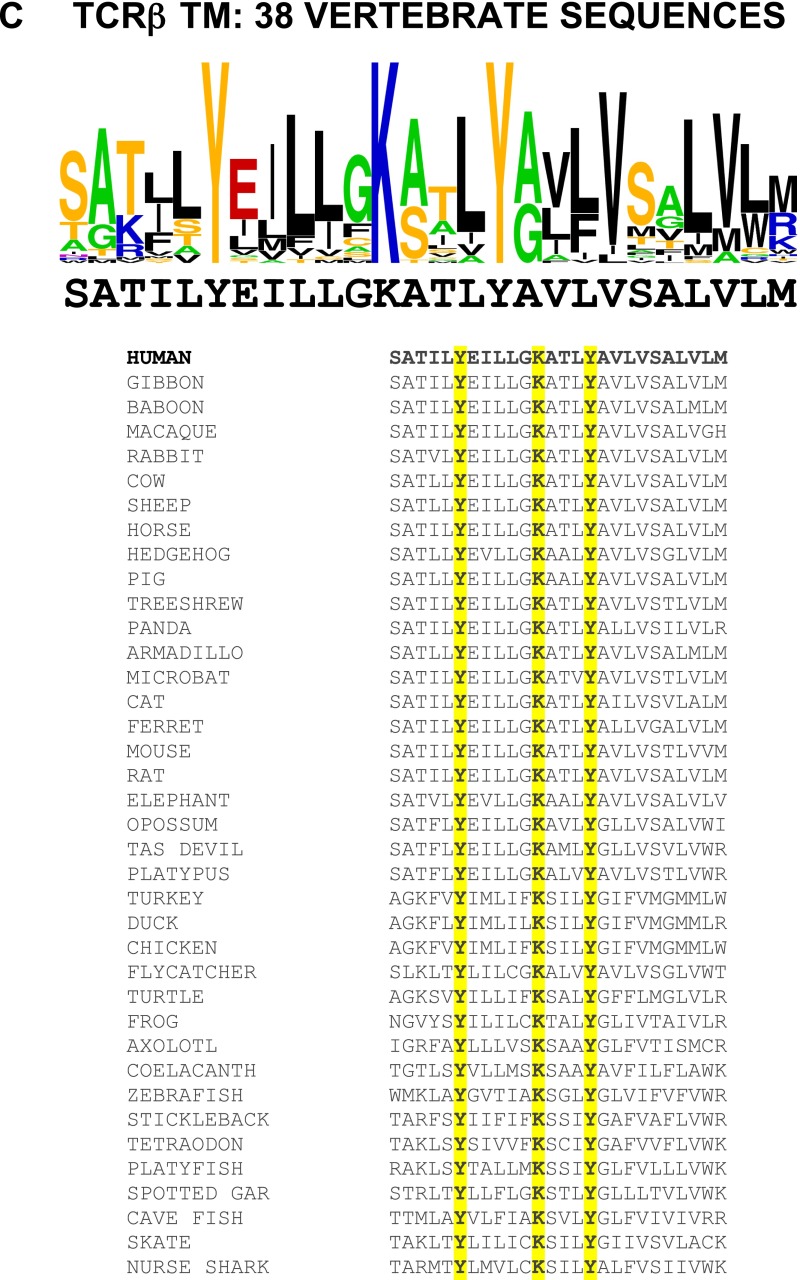
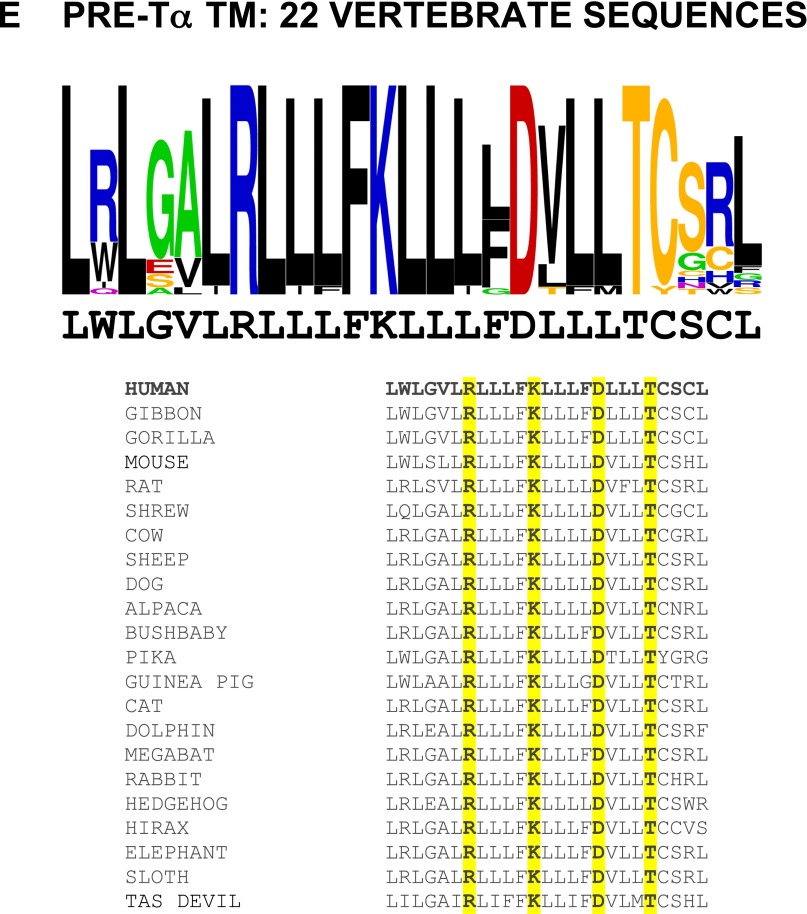
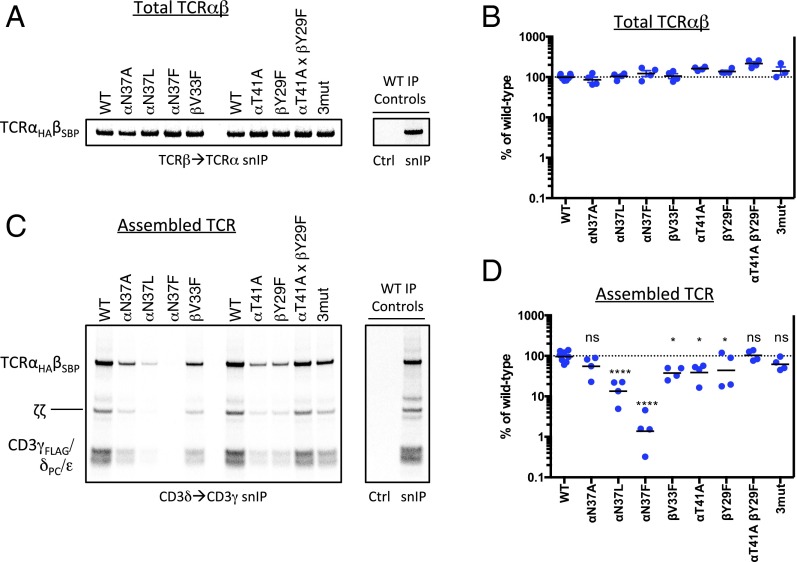
The T-cell antigen receptor (TCR) is an assembly of eight type I single-pass membrane proteins that occupies a central position in adaptive immunity. Many TCR-triggering models invoke an alteration in receptor complex structure as the initiating event, but both the precise subunit organization and the pathway by which ligand-induced alterations are transferred to the cytoplasmic signaling domains are unknown. Here, we show that the receptor complex transmembrane (TM) domains form an intimately associated eight-helix bundle organized by a specific interhelical TCR TM interface. The salient features of this core structure are absolutely conserved between αβ and γδ TCR sequences and throughout vertebrate evolution, and mutations at key interface residues caused defects in the formation of stable TCRαβ:CD3δε:CD3γε:ζζ complexes. These findings demonstrate that the eight TCR-CD3 subunits form a compact and precisely organized structure within the membrane and provide a structural basis for further investigation of conformationally regulated models of transbilayer TCR signaling.

Keywords: MD simulation; NMR; T-cell receptor; cysteine cross-linking; transmembrane structure.


Conflict of interest statement

The authors declare no conflict of interest.

Figures

Fig. 1.
Fig. 1.
Strategy for a TCRαβ TM disulfide scan. (A) Composition of the αβTCR–CD3 complex. The shaded disk represents the lipid bilayer. Arrows indicate the recognized intramembrane assembly steps orchestrated by basic (blue circles), acidic (red circles), and hydroxyl-bearing serine/threonine (yellow circles) residues. Yellow boxes represent immunoreceptor tyrosine-based activation motifs (ITAMs) in CD3 and ζ cytoplasmic tails. Ribbon diagrams of extracellular domains were prepared using the crystal structures of a human αβTCR [Protein Data Bank (PDB) ID code 1KGC] (78) and the crystal structures of human CD3δε (1XIW) (79) and human CD3γε (1SY6) (80). (B) Connecting peptide (CP), predicted transmembrane (TM), and cytosolic sequences of human TCRα and TCRβ proteins. Asterisks (*) indicate positions to be substituted with cysteine in a TM disulfide scan.
Fig. S1.
Fig. S1.
A “cysteineless” TCR requires ζζ for cell surface expression. The mouse OT-I TCR was encoded in a TCRβ-2A-TCRα retroviral construct using a pHAGE-IRES-ZsGreen vector. WT and CP-region cysteine-to-serine (Cys-less) versions of this TCR were transduced into a TCRαβ/CD3δ/ζ-deficient BW5147 murine thymoma line stably reconstituted with either CD3δ only (−ζ) or CD3δ and ζ (+ζ). ZsGreen+ cells were assessed for surface TCR expression by flow cytometry using PE-Cy7–conjugated anti-mouse TCRβ (clone H57-597).
Fig. 2.
Fig. 2.
Identification of specific TCRαβ TM contacts within the receptor complex. (A) Summary of observed TCRαβ TM cross-links indicated by solid lines between cysteine-substituted positions. The F×E cross-link highlighted in the text is marked in red. Residue numbering throughout the paper starts at the CP cysteines responsible for the native intermolecular TCRαβ disulfide bond. (B) Panel of cross-link–positive combinations from the primary disulfide scan shown in Fig. S2. The indicated control (WT, cysteineless) or cysteine mutant human A6 TCRα (HA-tagged) and TCRβ [streptavidin-binding peptide (SBP)-tagged] mRNAs were cotranslated with a master mix of human CD3 and ζ mRNAs in in vitro assembly reactions and treated with 1 mM copper(II):phenanthroline (CuPhe) in TBS to induce TM disulfide bond formation. Digitonin-extracted products were immunoprecipitated using mAb OKT3 (anti-CD3δε/CD3γε) and separated by nonreducing SDS/PAGE. IP control panels demonstrate the specificity of product capture using WT and two of the strongest cross-link combinations; each indicated assembly reaction was split and subjected to an IP with specific (OKT3) or isotype-matched irrelevant control (Ctrl) antibodies. (C) Aliquots of the same reactions shown in B were subjected to CD3δ (PC-tagged) → CD3γ (FLAG-tagged) sequential nondenaturing IP (snIP) (19) to isolate minimally hexameric (CD3δε:TCRαβ:CD3γε) complexes and analyzed as above. The IP controls contained isotype-matched irrelevant (Ctrl) antibodies in both steps of the snIP procedure. Asterisks (*) mark the combinations counted as cross-link positive. (D) CuPhe dependence of TCRα-F26C × TCRβ-E20C (F×E) cross-linking and ζζ association. The indicated TCR combinations were processed as in B either with (+) or without (−) CuPhe addition after assembly and analyzed by snIP to select minimally hexameric complexes (Left) or only fully assembled ζζ-containing complexes (Right). Control (Ctrl) snIPs were performed as above on a duplicate CuPhe-treated WT assembly reaction, but used biotin-blocked streptavidin (SA) in lieu of an isotype control in the first step of TCRβ → ζ snIP. (E) Comparison of TM cross-linking in the presence and absence of the native CP-region disulfide bond. Assembled and CuPhe-treated complexes containing WT, F×E on the cysteineless background (F×ECS) or F×E on an otherwise WT background with CP disulfide bond intact (F×EWT) were captured from digitonin lysates using SA beads to bind the SBP-tagged TCRβ chain. The final wash step was performed with (+) or without (−) 10 mM TCEP in digitonin solution to selectively reduce EC but not TM disulfide bonds.
Fig. S2.
Fig. S2.
Primary disulfide scan of TCRα and TCRβ TM domains. All combinations tested for TCRαβ TM cross-links are shown in AE. Analysis carried out as described in Fig. 2B with conformation-specific anti-CD3ε (OKT3) IP. The regions being interrogated in each panel are highlighted in orange. Cross-link–positive cysteine mutant combinations are indicated by lines between TCRα and TCRβ TM sequences and with * on the gels and quantitation.
Fig. S2.
Fig. S2.
Primary disulfide scan of TCRα and TCRβ TM domains. All combinations tested for TCRαβ TM cross-links are shown in AE. Analysis carried out as described in Fig. 2B with conformation-specific anti-CD3ε (OKT3) IP. The regions being interrogated in each panel are highlighted in orange. Cross-link–positive cysteine mutant combinations are indicated by lines between TCRα and TCRβ TM sequences and with * on the gels and quantitation.
Fig. 3.
Fig. 3.
Determination of TCRα and TCRβ TM helix limits by solution NMR. (A) 15N-, 13C-, and 2H (70%)-labeled peptides corresponding to connecting peptide (CP) and predicted TM regions of TCRα and TCRβ were reconstituted to 0.5 mM in 250 mM LMPG and 20 mM phosphate buffer (pH 6.8) and 1H-15N TROSY–heteronuclear single-quantum coherence spectra were recorded at 600-MHz 1H frequency and 35 °C. Full backbone resonance assignments were obtained for residues 3–47 (TCRα) and 3–40 (TCRβ) using standard triple-resonance experiments (Experimental Procedures) and backbone secondary chemical shift analysis was carried out using the TALOS+ software package (31). (B) Identification of helical regions from TALOS+ analysis. Asterisks (*) indicate positions where substitutions were made in NMR peptide constructs to facilitate production and analysis: C → S to block covalent homodimerization during production and purification; K → V to stabilize unassembled TM peptides in lipid micelles; M → V to avoid internal cleavage by cyanogen bromide.
Fig. 4.
Fig. 4.
Structure of the TCRαβ TM interface within the receptor complex. (A) The centroid structure from the major cluster in a 10-ns REMD simulation of the F×E disulfide-bonded TCRαβ TM heterodimer in an implicit lipid bilayer model. Residues involved in the cross-links identified in Fig. 2 are highlighted in magenta. The basic residues required for assembly with dimeric signaling modules (blue) were replaced with leucine for stability in the bilayer during simulation, but are shown as the native arginine and lysine residues in the models to highlight their positions. (B) Top view (down the long axis of the helix dimer, from the extracellular side) of the structure shown in A. The experimental F×E disulfide bond is shown in magenta and yellow. The assembly points for dimeric signaling modules are labeled in blue. (C) Close-up view of the polar network formed by TCRα-N37, TCRα-T41, and TCRβ-Y29. (D) An independent REMD simulation (10 ns) was performed using helix restraints from the NMR data (Fig. 3) and eight distance restraints (Cβ–Cβ distance: 3.7- to 6.0-Å range) from disulfide scan data. Each plot shows the real Cβ–Cβ distance as a function of time during the simulation and is color-coded to the lines connecting cross-linked positions in the sequences above. (E) Side view of the aligned centroid structures from the F×E disulfide bond simulation (green and yellow with blue basic residues) and the distance-restrained simulation (light gray with blue basic residues). The backbone rmsd between these two structures is 0.5 Å.
Fig. S3.
Fig. S3.
Stability of the TCRαβ TM interface in a lipid bilayer. The TCRαβ TM centroid structure from distance-restrained REMD simulations was placed in an explicitly modeled POPC bilayer and subjected to a 200-ns molecular dynamics simulation in which distance restraints were removed. Distances between the originally restrained atom pairs are traced in A over the simulation time frame, and total rmsd with respect to the starting structure is traced in B. C shows the distance between potential hydrogen bond donor–acceptor pairs as a function of simulation time, and the distances being monitored are indicated on the structure graphic for reference.
Fig. 5.
Fig. 5.
Evolutionary conservation of key TCR TM interface features. Sequence logos illustrate the degree of amino acid conservation within TM sequences based on vertebrate TCRα/TCRδ (A; 65 sequences total) and TCRβ/TCRγ (B; 66 sequences total) alignments. The sequences of human TCRα and TCRβ TM domains are shown below sequence logos for reference. The height of each letter stack indicates relative conservation at that position, whereas the height of each individual letter indicates its relative prevalence at that position. Colors represent basic (blue), acidic (red), hydroxyl/thiol-containing (yellow), carboxamide (purple), small (green), and aromatic/hydrophobic (black) side-chain categories. Labels below the reference sequences indicate the role of each conserved polar residue. Logo graphics were generated using the WEBLOGO internet application (weblogo.berkeley.edu). Additional sequence logos for individual TCR proteins and all sequences included in the analysis are provided in Fig. S4.
Fig. S4.
Fig. S4.
Individual TCR chain transmembrane sequence logos and all sequences used in alignments. Sequence logos as in Fig. 5 are shown for individual TCRα (A), TCRδ (B), TCRβ (C), TCRγ (D), and pre-Tα (E) predicted TM domains with the human sequences below the graphic for reference. The aligned sequences are shown with conserved residues highlighted in yellow.
Fig. S4.
Fig. S4.
Individual TCR chain transmembrane sequence logos and all sequences used in alignments. Sequence logos as in Fig. 5 are shown for individual TCRα (A), TCRδ (B), TCRβ (C), TCRγ (D), and pre-Tα (E) predicted TM domains with the human sequences below the graphic for reference. The aligned sequences are shown with conserved residues highlighted in yellow.
Fig. 6.
Fig. 6.
Alteration of TCR complex stability by mutations in the C-terminal conserved TCRαβ TM interface. Assembly reactions containing the indicated TCRαβ mutants (on the WT CP region background) were performed as in Fig. 2 but were not subjected to a CuPhe treatment step. All reactions received the same master mix of CD3/ζ mRNAs. Each completed assembly reaction was split for analysis by snIP targeting TCRβ (SBP-tagged) followed by TCRα (HA-tagged) to quantitate total disulfide-linked TCRαβ heterodimer (A), or targeting CD3δ (PC-tagged) followed by CD3γ (FLAG-tagged) to isolate minimally hexameric CD3δε:TCRαβ:CD3γε complexes (C). Control (Ctrl) IPs used isotype-matched irrelevant antibodies or biotin-blocked SA in both steps of the snIP procedure as in Fig. 2. A and C show a single representative experiment. B and D show quantitative analysis of four independent experiments from densitometry data. Each plotted value represents the raw intensity of the TCRαβ band for the mutant, expressed as a percentage of WT in that experiment (an average of two independent WT controls in each experiment). Significance in D was determined in an ordinary one-way ANOVA uncorrected Fisher’s least significant difference test with single pooled variance. Means and P values for each mutant are as follows: (TCRα-N37A) 55.1%, P = 0.1512 (ns); (TCRα-N37L) 13.4%, P < 0.0001; (TCRα-N37F) 1.4%, P < 0.0001; (TCRβ-V33F) 37.6%, P = 0.0188; (TCRα-T41A) 38.9%, P = 0.0231; (TCRβ-Y29F) 43.8%, P = 0.0465; (TCRα-T41A, TCRβ-Y29F) 102.4%, P = 0.8681 (ns); (TCRα-N37A,T41A; TCRβ-Y29F 3mut) 62.0%, P = 0.2562 (ns).
Fig. 7.
Fig. 7.
Model of TM arrangement within the octameric TCR complex. Positions of signaling modules are inferred from the locations of key basic TM residues (19) around the TCRαβ TM coiled-coil structure. Polar side chains discussed in the text are shown in stick representation. The ζζ TM structure was generated from PDB entry 2HAC (20). CD3δε and CD3γε are shown as gray circles because no structural information is available and the subunit positions within each dimer are unknown. Red crescents represent acidic residues involved in assembly with TCR chains (19).

Similar articles

Cited by

References

    1. Beddoe T, et al. Antigen ligation triggers a conformational change within the constant domain of the αβ T cell receptor. Immunity. 2009;30(6):777–788. - PubMed
    1. Kim ST, et al. The αβ T cell receptor is an anisotropic mechanosensor. J Biol Chem. 2009;284(45):31028–31037. - PMC - PubMed
    1. Kuhns MS, Davis MM. Disruption of extracellular interactions impairs T cell receptor-CD3 complex stability and signaling. Immunity. 2007;26(3):357–369. - PubMed
    1. Liu B, Chen W, Evavold BD, Zhu C. Accumulation of dynamic catch bonds between TCR and agonist peptide-MHC triggers T cell signaling. Cell. 2014;157(2):357–368. - PMC - PubMed
    1. Ma Z, Janmey PA, Finkel TH. The receptor deformation model of TCR triggering. FASEB J. 2008;22(4):1002–1008. - PMC - PubMed

Publication types

MeSH terms

Substances