. 2016 Oct 25;113(43):E6659-E6668.
doi: 10.1073/pnas.1606646113. Epub 2016 Oct 10.

miRNA92a targets KLF2 and the phosphatase PTEN signaling to promote human T follicular helper precursors in T1D islet autoimmunity

Affiliations

miRNA92a targets KLF2 and the phosphatase PTEN signaling to promote human T follicular helper precursors in T1D islet autoimmunity

Isabelle Serr et al. Proc Natl Acad Sci U S A. .

Erratum in

Abstract

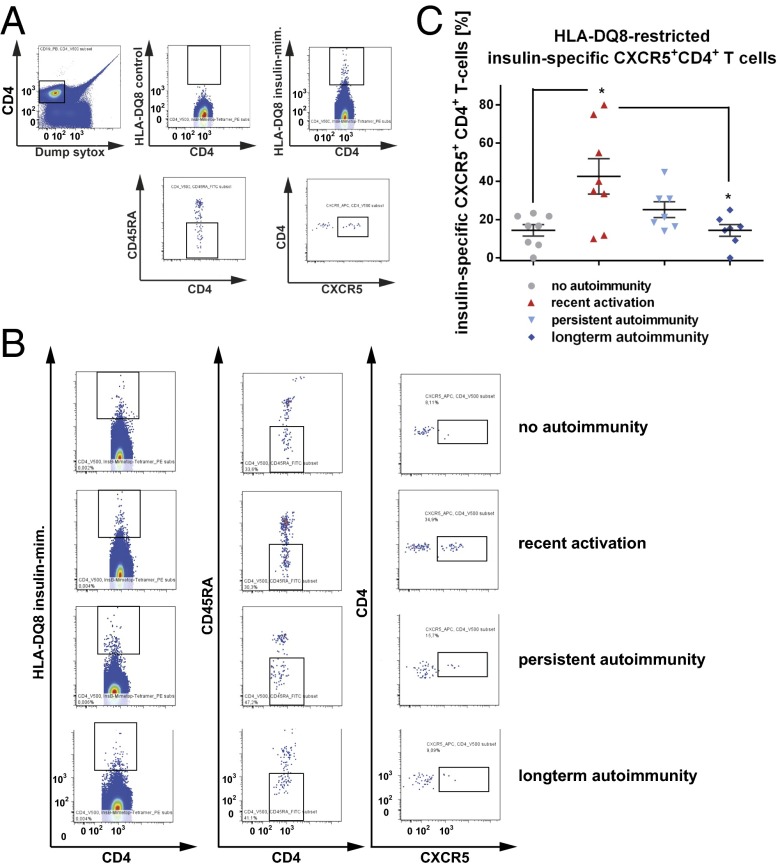
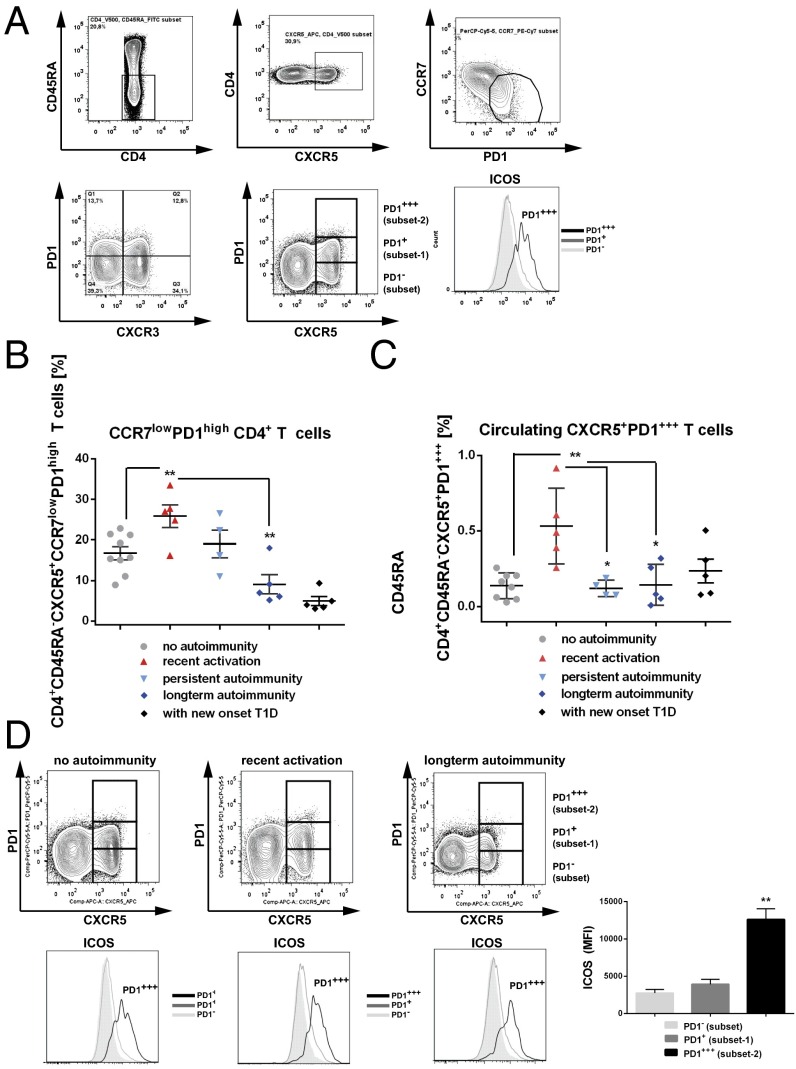
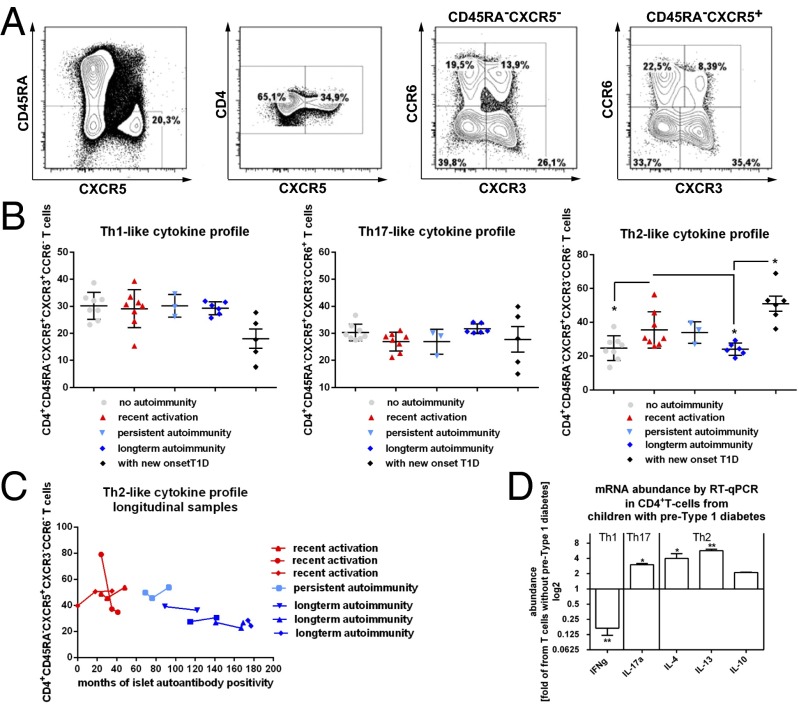
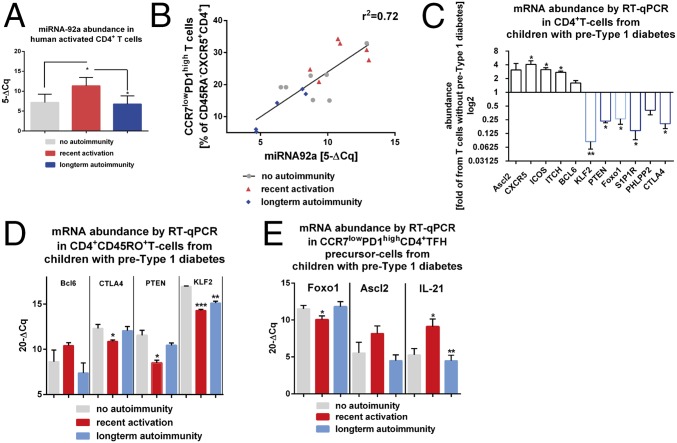
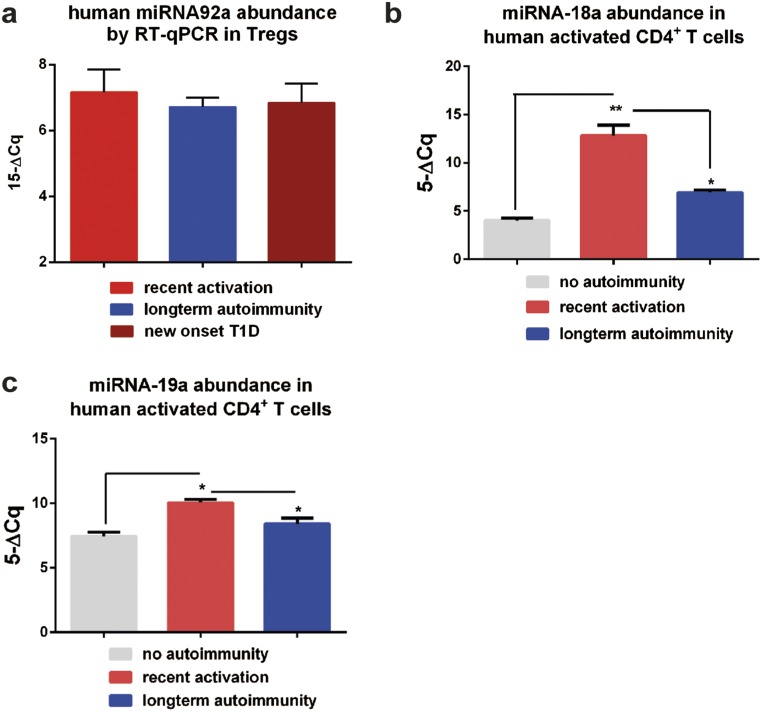
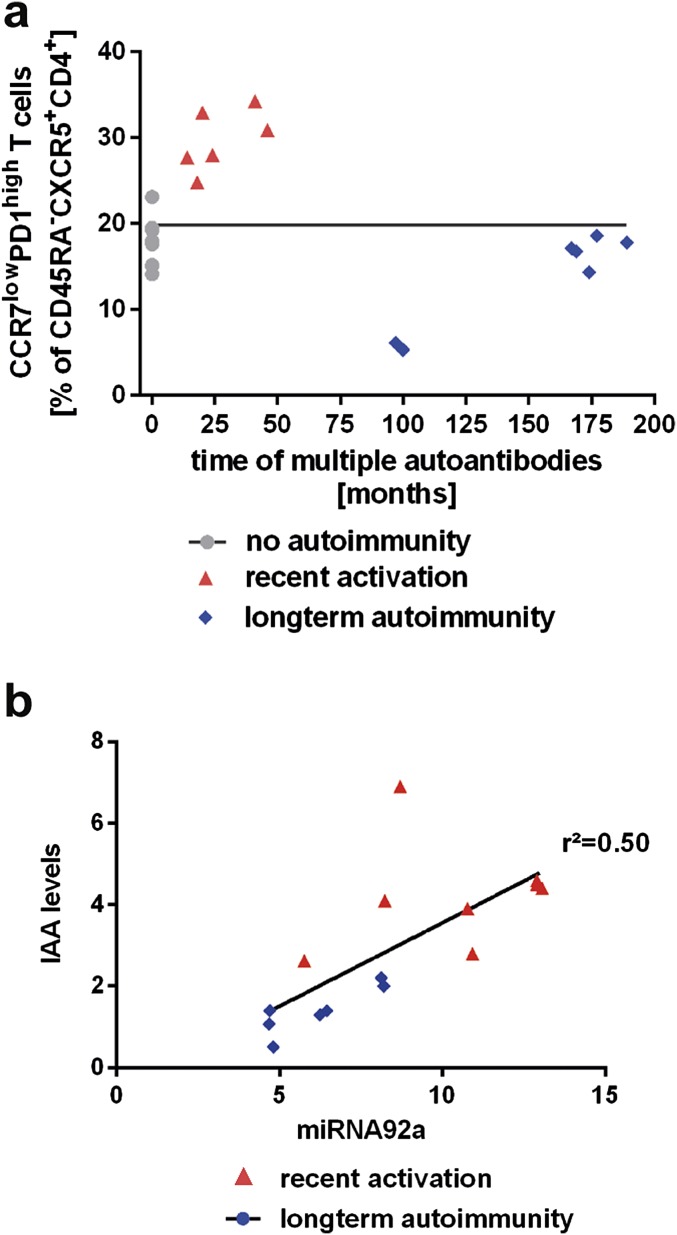
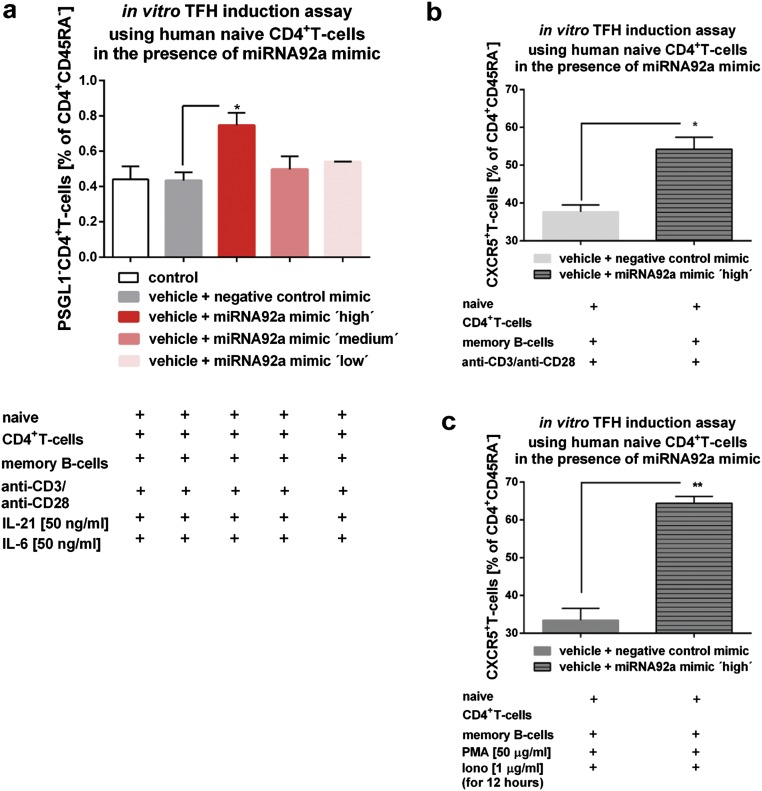
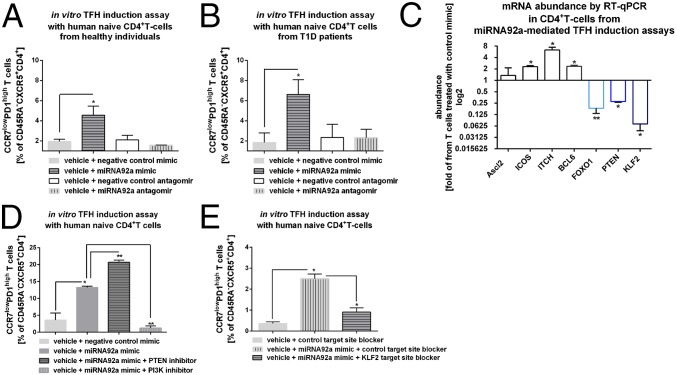
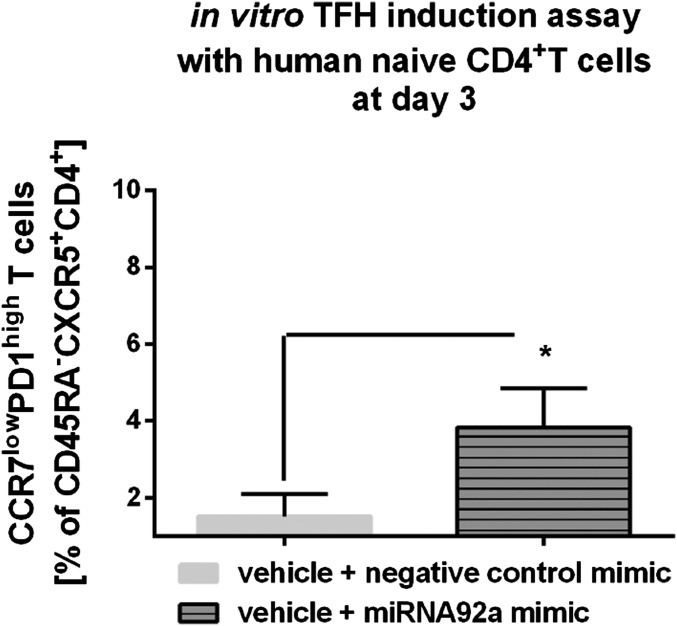
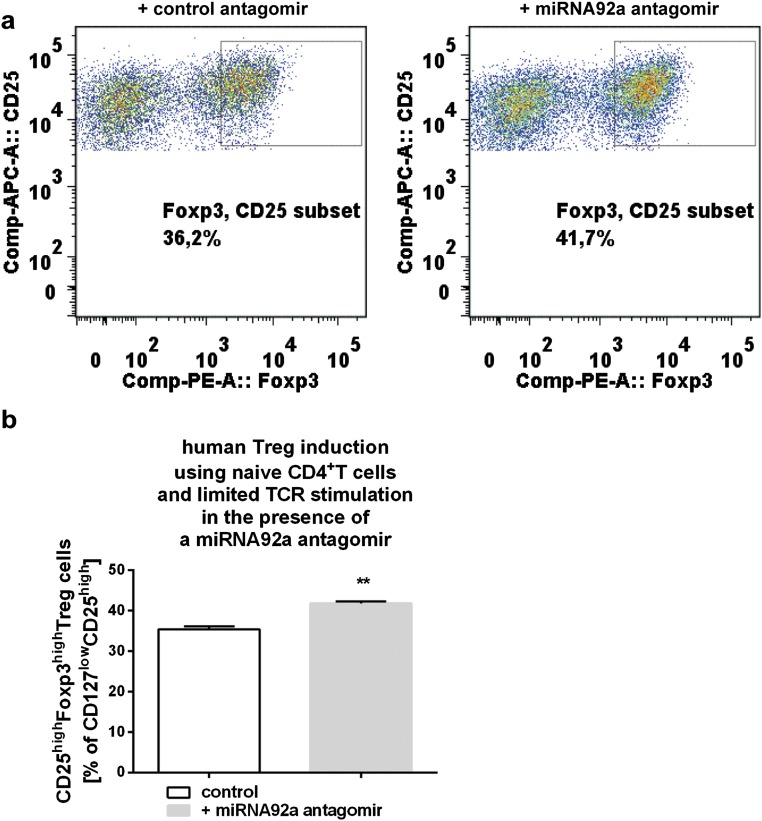
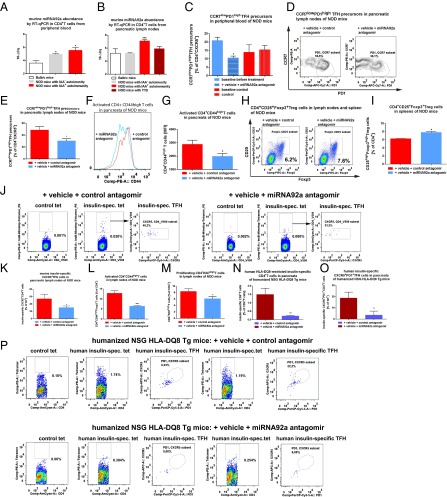
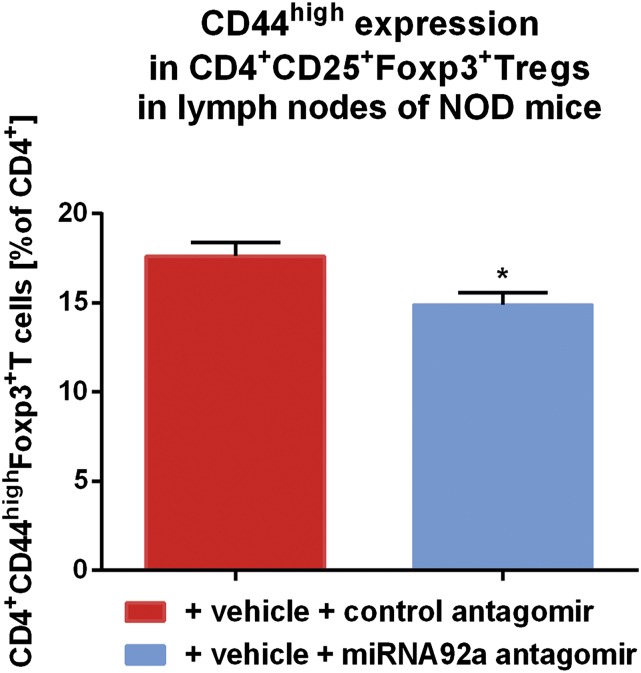
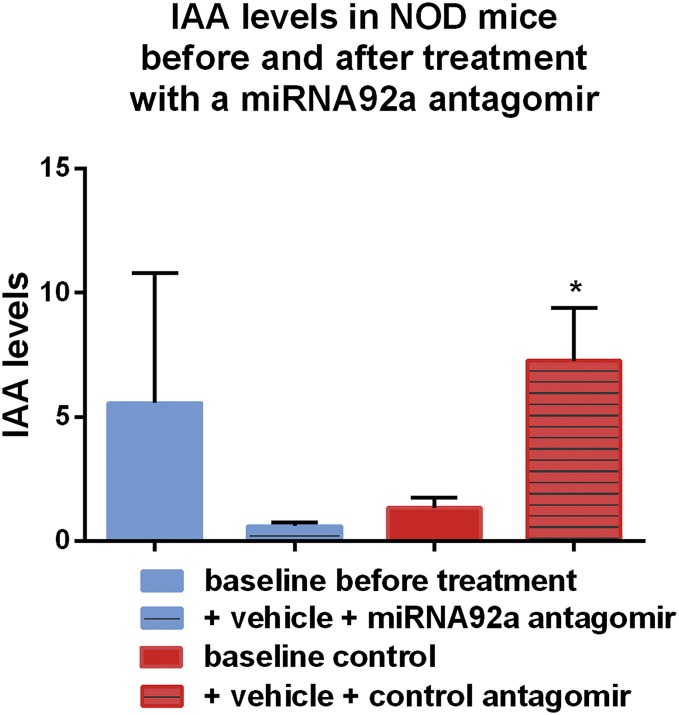
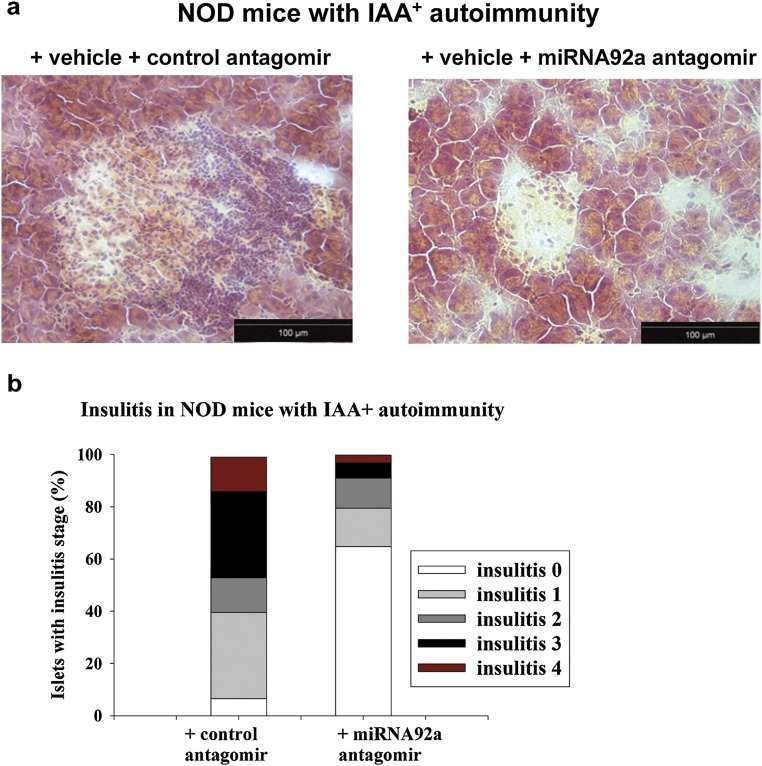
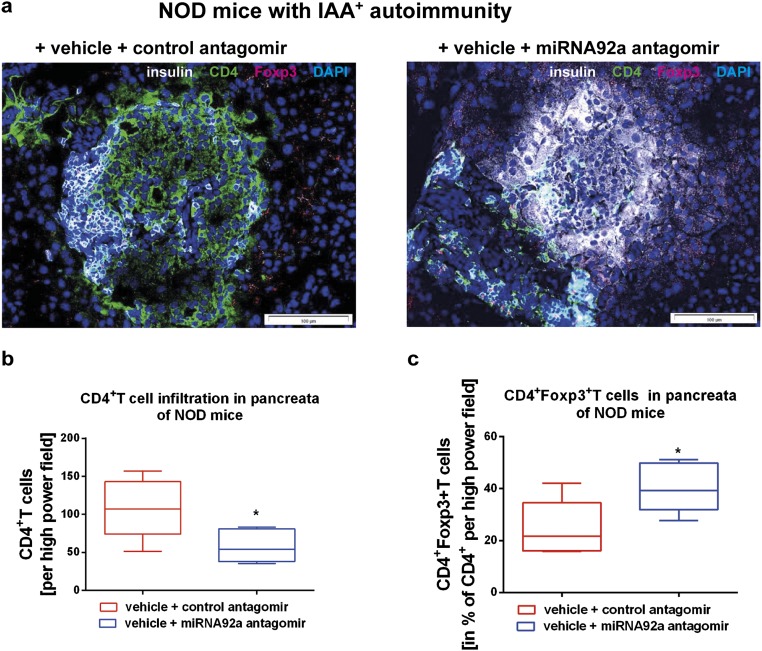
Aberrant immune activation mediated by T effector cell populations is pivotal in the onset of autoimmunity in type 1 diabetes (T1D). T follicular helper (TFH) cells are essential in the induction of high-affinity antibodies, and their precursor memory compartment circulates in the blood. The role of TFH precursors in the onset of islet autoimmunity and signaling pathways regulating their differentiation is incompletely understood. Here, we provide direct evidence that during onset of islet autoimmunity, the insulin-specific target T-cell population is enriched with a C-X-C chemokine receptor type 5 (CXCR5)+CD4+ TFH precursor phenotype. During onset of islet autoimmunity, the frequency of TFH precursors was controlled by high expression of microRNA92a (miRNA92a). miRNA92a-mediated TFH precursor induction was regulated by phosphatase and tension homolog (PTEN) - phosphoinositol-3-kinase (PI3K) signaling involving PTEN and forkhead box protein O1 (Foxo1), supporting autoantibody generation and triggering the onset of islet autoimmunity. Moreover, we identify Krueppel-like factor 2 (KLF2) as a target of miRNA92a in regulating human TFH precursor induction. Importantly, a miRNA92a antagomir completely blocked induction of human TFH precursors in vitro. More importantly, in vivo application of a miRNA92a antagomir to nonobese diabetic (NOD) mice with ongoing islet autoimmunity resulted in a significant reduction of TFH precursors in peripheral blood and pancreatic lymph nodes. Moreover, miRNA92a antagomir application reduced immune infiltration and activation in pancreata of NOD mice as well as humanized NOD Scid IL2 receptor gamma chain knockout (NSG) human leucocyte antigen (HLA)-DQ8 transgenic animals. We therefore propose that miRNA92a and the PTEN-PI3K-KLF2 signaling network could function as targets for innovative precision medicines to reduce T1D islet autoimmunity.

Keywords: KLF2; PTEN-PI3K signaling; T follicular helper cells; miRNA92a; type 1 diabetes.


Conflict of interest statement

The authors declare no conflict of interest.

Figures

Fig. 1.
Fig. 1.
Ex vivo identification of HLA-DQ8–restricted insulin-specific CXCR5+ TFH precursor cells from children with or without ongoing islet autoimmunity. (A, Upper Left) Human CD4+ T cells were analyzed by flow cytometry, first gating on live, CD19, CD14, CD8a, CD11b, CD4+, and CD3+ cells and then examining the tetramer binding. (A, Upper Right) Representative set of FACS plots for the identification of HLA-DQ8–restricted insulin-specific CD4+ T cells. mim, mimic. (A, Upper Center) Control staining was used to assess the quality and specificity of the tetramer staining using a combination of two control tetramers fused to irrelevant peptides. (A, Lower) Insulin-specific CD4+ memory TFH precursor cells were then identified by gating on CD45RA and CXCR5+. (B) FACS plots for insulin-specific memory CXCR5+ TFH precursor cells purified from children without autoimmunity (islet autoantibody-negative), with recent onset of autoimmunity (recent activation = multiple autoantibodies for ≤5 y), with persistent autoimmunity (multiple autoantibodies for >5 to ≤10 y), and with long-term autoimmunity (multiple autoantibodies for >10 y without T1D). (C) Summary of identified HLA-DQ8–restricted insulin-specific tet+CD4+CXCR5+ TFH precursor cells purified from children without autoimmunity (no autoimmunity, n = 8), with recent onset of autoimmunity (recent activation, n = 8), with persistent autoimmunity (n = 7), and with long-term autoimmunity (n = 7). Data represent the mean ± SEM. *P < 0.05.
Fig. 2.
Fig. 2.
Identification and characterization of blood-residing CXCR5+CCR7lowPD1high and CXCR5+PD1+++ cells in CD4+ T cells from children with or without ongoing islet autoimmunity or with new onset T1D. (A) Identification of CD4+CD45RACXR5+CCR7lowPD1high T cells (Upper) and CXCR5+PD1, CXCR5+PD1+, and CXCR5+PD1+++ T cells (Lower). (Lower Right) Histogram indicates ICOS expression levels in the PD1 subset (light gray line, plot filled), PD1+ subset 1 (gray line, plot unfilled), and PD1+++ subset 2 (black line). (B) Summary graphs for the frequencies of circulating CD4+CD45RACXR5+CCR7lowPD1high T cells (no autoimmunity, n = 9; recent onset of autoimmunity, n = 5; persistent autoimmunity, n = 4; long-term autoimmunity, n = 5; new onset T1D, n = 5). Data represent the mean ± SEM. **P < 0.01. (C) Summary graphs for the frequencies of circulating CD4+CD45RACXR5+PD1+++ T cells (no autoimmunity, n = 8; recent onset of autoimmunity, n = 5; persistent autoimmunity, n = 4; long-term autoimmunity, n = 5; new onset T1D, n = 5). Data represent the mean ± SEM. *P < 0.05; **P < 0.01. (D, Upper) Identification of CD4+CD45RACXCR5+PD1+++ T cells from children with or without pre-T1D (no autoimmunity, recent activation of autoimmunity, and long-term autoimmunity). (D, Lower) Histograms indicate ICOS expression levels in CXCR5+PD1, CXCR5+PD1+, and CXCR5+PD1+++ subsets. (D, Lower Right) Summary graph shows ICOS MFIs, dependent on the PD1 expression levels. Data represent the mean ± SEM. **P < 0.01.
Fig. 3.
Fig. 3.
Identification of circulating CXCR5+CD4+ T cells and Th1, Th2, or Th17 cytokine expression profiles in CD4+ T cells from children with or without ongoing islet autoimmunity or with new onset T1D. (A) Identification of CD4+CD45RACXCR5+ T cells and respective CXCR3+CCR6 (Th1), CXCR3CCR6 (Th2), or CXCR3CCR6+ (Th17) subsets. (B) Summary graphs for the frequencies of circulating CXCR5+CD4+ T cells with Th1, Th2, or Th17 characteristics (no autoimmunity, n = 8; recent onset of autoimmunity, n = 8; long-term autoimmunity, n = 6; new onset T1D, n = 5). Data represent the mean ± SEM. *P < 0.05. (C) Frequencies of the TFH-Th2 subset in longitudinal samples from children with recent activation, persistent islet autoimmunity, or long-term islet autoimmunity. (D) Summary graphs for the mRNA abundance of cytokine expression levels (IFN-γ = Th1; IL-17a = Th17, IL-4, IL-13; and IL-10 = Th2) within respective CD4+ T-cell subsets by RT-qPCR from children with islet autoimmunity (pre-T1D). Results are shown in abundance as the fold of T cells from children without ongoing islet autoimmunity (no pre-T1D), with no autoimmunity (n = 6), or with ongoing islet autoimmunity (n = 7). Data represent the mean ± SEM. *P < 0.05; **P < 0.01.
Fig. 4.
Fig. 4.
Enhanced abundance of miRNA92a promotes increased frequencies of circulating CXCR5+CD4+ T cells during onset of human islet autoimmunity. (A) miRNA92a abundance in human CD4+ T cells purified from children with or without pre-T1D (no autoimmunity, n = 10; recent onset of autoimmunity, n = 6; long-term autoimmunity, n = 6) by RT-qPCR analyses. Data represent the mean ± SEM. *P < 0.05. (B) Correlation of CXCR5+CCR7lowPD1highCD4+ T cells with miRNA92a abundance. (C) Abundance of predicted signaling pathways regulated by miRNA92a in human islet autoimmunity. Down-regulation of the PTEN-Foxo1-KLF2 signaling network to promote human TFH precursor cells and onset of islet autoimmunity is shown. mRNA abundance of Ascl2, CXCR5, ICOS, ITCH, Bcl6, KLF2, PTEN, Foxo1, PHLPP2, CTLA4, and S1P1R from CD4+ T cells of individual children with islet autoimmunity (pre-T1D) is shown. Results are shown in abundance as the fold of T cells from children without ongoing islet autoimmunity (no pre-T1D), with no autoimmunity (n = 6), and with ongoing islet autoimmunity, n = 7). *P < 0.05; **P < 0.01. (D) mRNA abundance from a selection of genes predictively targeted by miRNA92a in CD4+CD45RO+ T cells from individual children with or without ongoing pre-T1D as assessed by RT-qPCR analyses (no autoimmunity, n = 7; recent onset of autoimmunity, n = 6; long-term autoimmunity, n = 5). Data represent the mean ± SEM. *P < 0.05; **P < 0.01; ***P < 0.001. (E) mRNA abundance of Foxo1, Ascl2, and IL-21 in CCR7lowPD1highCD4+ TFH precursor cells in accordance with the duration of islet autoimmunity (no autoimmunity, n = 7; recent onset of autoimmunity, n = 6; long-term autoimmunity, n = 5). Data represent the mean ± SEM. *P < 0.05; **P < 0.01.
Fig. S1.
Fig. S1.
(A) miRNA92a abundance in CD4+CD3+CD127lowCD25high Treg cells. miRNA18a (B) and miRNA19a (C) abundance in human CD4+ T cells purified from children with or without pre-T1D (no autoimmunity, n = 10; recent onset of autoimmunity, n = 6; long-term autoimmunity, n = 6) as assessed by qRT-PCR analyses. Data represent the mean ± SEM. *P < 0.05; **P < 0.01.
Fig. S2.
Fig. S2.
(A) Correlation of duration of islet autoimmunity (months of multiple islet autoantibody positivity) with CXCR5+CCR7lowPD1highCD4+ T cells. (B) Correlation of miRNA92a abundance in CD4+ T cells with IAA levels in serum.
Fig. S3.
Fig. S3.
Assessment of uptake, intracellular colocalization of FA-labeled nanoparticles, and Dy457-labeled transfection control miRNA mimic in CD4+ T cells upon stimulation with anti-CD3/anti-CD28 by confocal microscopy.
Fig. S4.
Fig. S4.
(A) TFH precursor induction using human naive CD4+ T cells in the presence of memory B cells and IL-6, IL-21, and a titration of a miRNA92a mimic (low = 0.0375 μg in 200 μL per 100,000 cells, medium = 0.075 μg in 200 μL per 100,000 cells, and high = 0.15 μg in 200 μL per 100,000 cells) or a negative miRNA mimic control. Summary graph for frequencies of PSGL1CD4+ T cells is shown as percentages of CD4+CD45RA T cells (n = 4). Data represent the mean ± SEM from duplicate wells per individual. *P < 0.05. (B) TFH precursor induction using human naive CD4+ T cells in the presence of memory B cells and a miRNA92a mimic or a negative miRNA mimic control. Summary graph for frequencies of CXCR5+CD4+ T cells is shown as percentages of CD4+CD45RA T cells (n = 4). Data represent the mean ± SEM from duplicate wells per individual. *P < 0.05. (C) TFH precursor induction using human naive CD4+ T cells in the presence of memory B cells and a miRNA92a mimic or a negative miRNA mimic control. In such assays, PMA (50 ng/mL) and ionomycin (1 μg/mL) were added for the last 12 h of the experiments, and frequencies of CXCR5+CD4+ T cells shown as percentages of CD4+CD45RA T cells were analyzed (n = 4). Data represent the mean ± SEM from duplicate wells per individual. **P < 0.01.
Fig. 5.
Fig. 5.
miRNA92a regulates human TFH precursor induction in vitro. (A) TFH precursor induction using human naive CD4+ T cells from healthy individuals in the presence of memory B cells with or without a miRNA92a mimic, a miRNA92a antagomir, or respective negative control mimics or antagomirs. Summary graphs are shown for frequencies of CCR7lowPD1high cells presented as percentages of CXCR5+CD45RACD4+ T cells. Data represent the mean ± SEM. *P < 0.05. (B) TFH precursor induction as outlined in A using human naive CD4+ T cells from T1D individuals. Summary graphs are shown for frequencies of CCR7lowPD1high cells presented as percentages of CXCR5+CD45RACD4+ T cells. Data represent the mean ± SEM. *P < 0.05. (C) mRNA abundance of predicted signaling pathways controlled by miRNA92a from CD4+ T cells of TFH precursor induction assays in the presence of miRNA92a mimic quantified by RT-qPCR analyses. Results are shown in abundance as the fold of T cells treated with negative miRNA mimic controls. Data represent the mean ± SEM from duplicate wells of four independent experiments. *P < 0.05; **P < 0.01. (D) TFH induction using human naive CD4+ T cells in the presence of memory B cells with or without a miRNA92a mimic or negative miRNA mimic controls. In such assays, PMA (50 ng/mL) and ionomycin (1 μg/mL) were added for the last 12 h of the experiments, and frequencies of CCR7lowPD1highCD4+ T cells were analyzed. Experiments were performed in the presence or absence of a PTEN or PI3K inhibitor, respectively. Summary graphs for frequencies of CCR7lowPD1high TFH precursor cells (percentage of CD45RACXCR5+CD4+ T cells) (n = 4). Data represent the mean ± SEM from duplicate wells of four independent experiments. *P < 0.05; **P < 0.01. (E) TFH precursor induction using human naive CD4+ T cells in the presence of memory B cells with or without a miRNA92a mimic, a control TSB, a miRNA92a KLF2 TSB, or a combination. Summary graphs are shown for frequencies of CCR7lowPD1high cells presented as percentages of CXCR5+CD45RACD4+ T cells (n = 4). Data represent the mean ± SEM from duplicate wells of four independent experiments. *P < 0.05.
Fig. S5.
Fig. S5.
TFH precursor induction using human naive CD4+ T cells in the presence of memory B cells with or without a miRNA92a mimic or respective negative control mimics. Summary graphs are shown for frequencies of CCR7lowPD1high cells presented as percentages of CXCR5+CD45RACD4+ T cells after a 3-d culture. Data represent the mean ± SEM. *P < 0.05.
Fig. S6.
Fig. S6.
(A) Human Treg-cell induction using human naive CD4+ T cells in the presence of a miRNA92a antagomir (0.075 μg in 200 μL per 100,000 cells) or respective negative control antagomir and limited T-cell receptor stimulation. (B) Summary graph for frequencies of induced human CD127lowCD25highFoxp3high Treg cells (n = 4). Data represent the mean ± SEM from triplicate wells. **P < 0.01.
Fig. 6.
Fig. 6.
In vivo miRNA92a antagomir application reduces immune activation in NOD and humanized mice. The miRNA92a abundance in murine CD4+ T cells from BALB/c mice and NOD mice with or without ongoing islet autoimmunity, as well as with T1D in peripheral blood (A) or in pancreatic lymph nodes (B), as assessed by RT-qPCR analyses, is shown. Data represent the mean ± SEM. *P < 0.05; ***P < 0.001. (C) Summary graphs for CCR7lowPD1high T cells in peripheral blood of NOD mice before and after treatment with either control antagomirs or a specific miRNA92a antagomir. Data represent the mean ± SEM from two independent experiments (n = 4). *P < 0.05. (D) FACS plots for the identification of CCR7lowPD1high TFH precursors in pancreatic lymph nodes of NOD mice after treatment with control antagomir or miRNA92a antagomir. (E) Summary graphs for CCR7lowPD1high T cells in pancreatic lymph nodes of NOD mice given a control antagomir or a specific miRNA92a antagomir. Data represent the mean ± SEM from two independent experiments (n = 4). *P < 0.05. (F) FACS histograms for the identification of CD4+CD44high T cells of pancreas-infiltrating T cells of NOD mice treated with either control antagomirs or a miRNA92a antagomir. (G) Summary graphs for CD4+CD44high T cells of pancreas-infiltrating T cells of NOD mice as indicated in F. Data represent the mean ± SEM from two independent experiments (n = 4). *P < 0.05. (H) Identification of CD4+CD25+Foxp3+ T cells of NOD mice given a control antagomir or a miRNA92a antagomir. (I) Summary graphs for CD4+CD25highFoxp3high T cells of NOD mice as indicated in H. Data represent the mean ± SEM from two independent experiments (n = 4). *P < 0.05. (J) Identification of IAg7-restricted, insulin-specific CD4+ T cells and CXCR5+ TFH cells in pancreatic lymph nodes of NOD mice given a control antagomir or miRNA92a antagomir. (K) Frequencies of insulin-specific TFH cells as in J (mean ± SEM from two independent experiments; n = 4). *P < 0.05. (L) Frequencies of activated CD44high T cells upon treatment with a control or a miRNA92a antagomir. Data represent the mean ± SEM from two independent experiments (n = 4). ***P < 0.01. (M) Proliferating CD4+Ki67high T cells upon treatment with a control or a miRNA92a antagomir. Data represent the mean ± SEM from two independent experiments (n = 4). *P < 0.05. (N) Frequencies of human insulin-specific CD4+ T cells in pancreata of humanized mice as in P (mean ± SEM; n = 5). **P < 0.01. (O) Frequencies of human insulin-specific CXCR5+PD1+CD4+ T cells in pancreata of humanized mice as in P (mean ± SEM; n = 5). *P < 0.05. (P) Identification of human HLA-DQ8–restricted, insulin-specific CD4+ T cells and CXCR5+PD1+ TFH cells in pancreata of humanized NSG HLA-DQ8 Tg mice given a control antagomir or a miRNA92a antagomir. APC, allophycocyanin; PerCP, peridinin chlorophyll protein; spec., specific.
Fig. S7.
Fig. S7.
Summary graph for CD44high expression in CD4+CD25+Foxp3+ Treg cells purified from lymph nodes of NOD mice given a control antagomir or a miRNA92a antagomir (14 d of treatment, with injections four times per week at 5 mg/kg) (n = 5 per group). Data represent the mean ± SEM. *P < 0.05.
Fig. S8.
Fig. S8.
Summary graphs for IAA levels from NOD mice before and after treatment with either control antagomirs or a specific miRNA92a antagomir (14 d of treatment, with injections four times per week at 5 mg/kg) (n = 5 per group). Data represent the mean ± SEM. *P < 0.05.
Fig. S9.
Fig. S9.
(A) Histopathological evaluation of pancreas sections from NOD mice with IAA+ autoimmunity that were given a control antagomir or a miRNA92a antagomir (14 d of treatment, with injections four times per week at 5 mg/kg). Representative hematoxylin and eosin-stained pancreas cryosections are shown. (B) Grading of insulitis from NOD mice as in A (n = 5 per group).
Fig. S10.
Fig. S10.
(A) Immunofluorescence for insulin (white), CD4 (green), and Foxp3 (red) in pancreatic cryosections of NOD mice given a control inhibitor or a miRNA92a inhibitor (14 d of treatment, with injections four times per week at 5 mg/kg). (B) CD4+ T cells infiltrating the pancreas as in A. Shown are box and whiskers plots of CD4+ T cells per high-power field. (C) CD4+Foxp3+ T cells in the percentage of infiltrating CD4+T cells per high-power field of mice as in A (n = 5 per group).

References

    1. Bluestone JA, Herold K, Eisenbarth G. Genetics, pathogenesis and clinical interventions in type 1 diabetes. Nature. 2010;464(7293):1293–1300. - PMC - PubMed
    1. Ziegler AG, Nepom GT. Prediction and pathogenesis in type 1 diabetes. Immunity. 2010;32(4):468–478. - PMC - PubMed
    1. Insel RA, et al. Staging presymptomatic type 1 diabetes: A scientific statement of JDRF, the Endocrine Society, and the American Diabetes Association. Diabetes Care. 2015;38(10):1964–1974. - PMC - PubMed
    1. Unanue ER. Antigen presentation in the autoimmune diabetes of the NOD mouse. Annu Rev Immunol. 2014;32:579–608. - PubMed
    1. Ziegler AG, et al. Seroconversion to multiple islet autoantibodies and risk of progression to diabetes in children. JAMA. 2013;309(23):2473–2479. - PMC - PubMed

Publication types

MeSH terms