. 2016 Nov 8;113(45):12880-12885.
doi: 10.1073/pnas.1521540113. Epub 2016 Oct 24.

Linking freshwater fishery management to global food security and biodiversity conservation

Affiliations

Linking freshwater fishery management to global food security and biodiversity conservation

Peter B McIntyre et al. Proc Natl Acad Sci U S A. .

Abstract

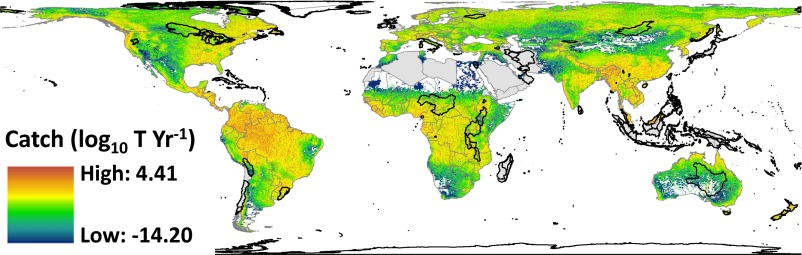
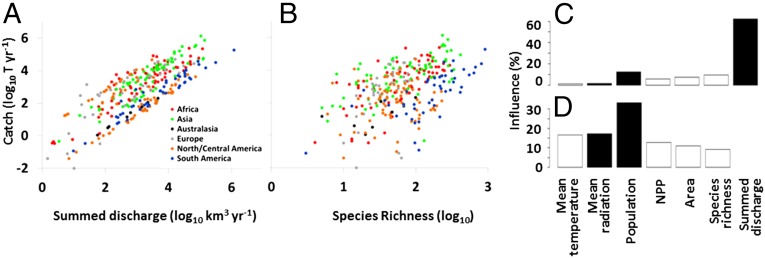
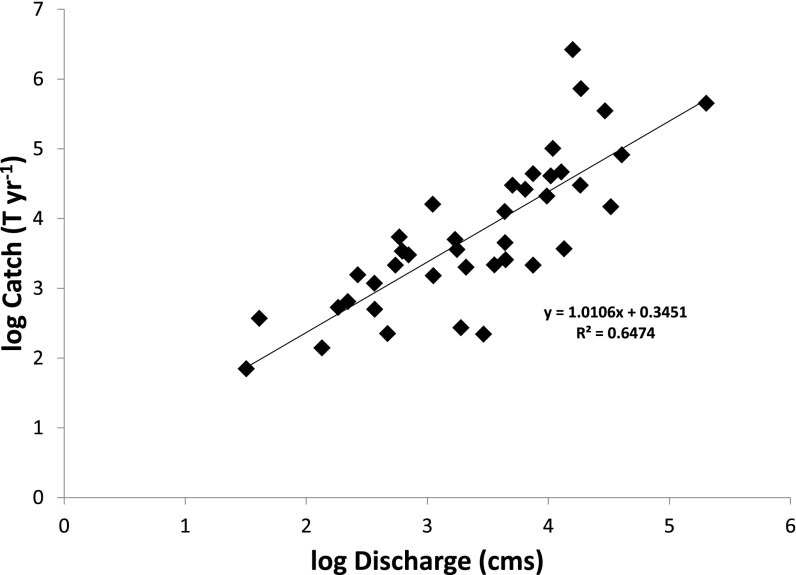
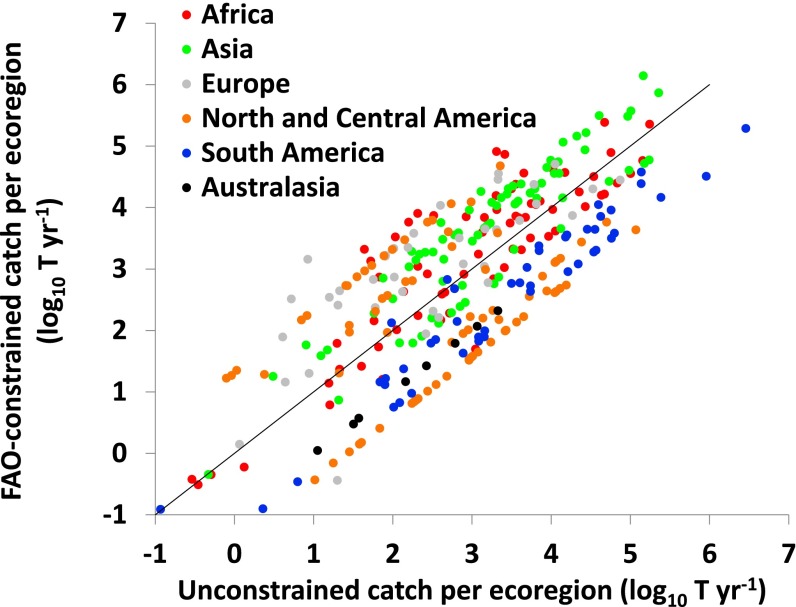
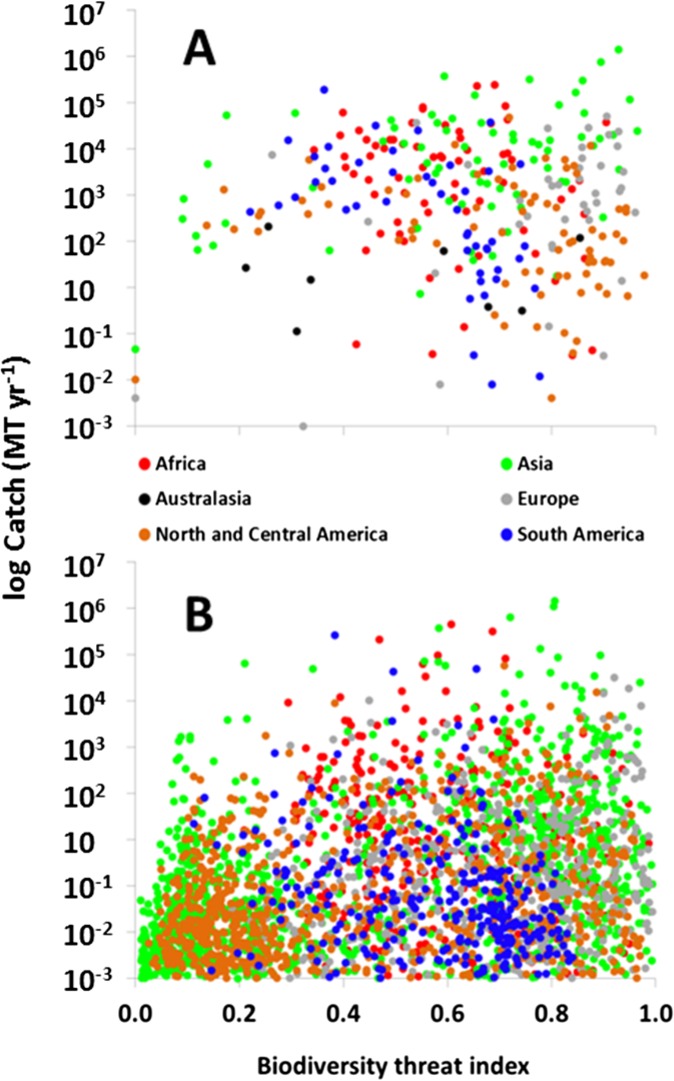
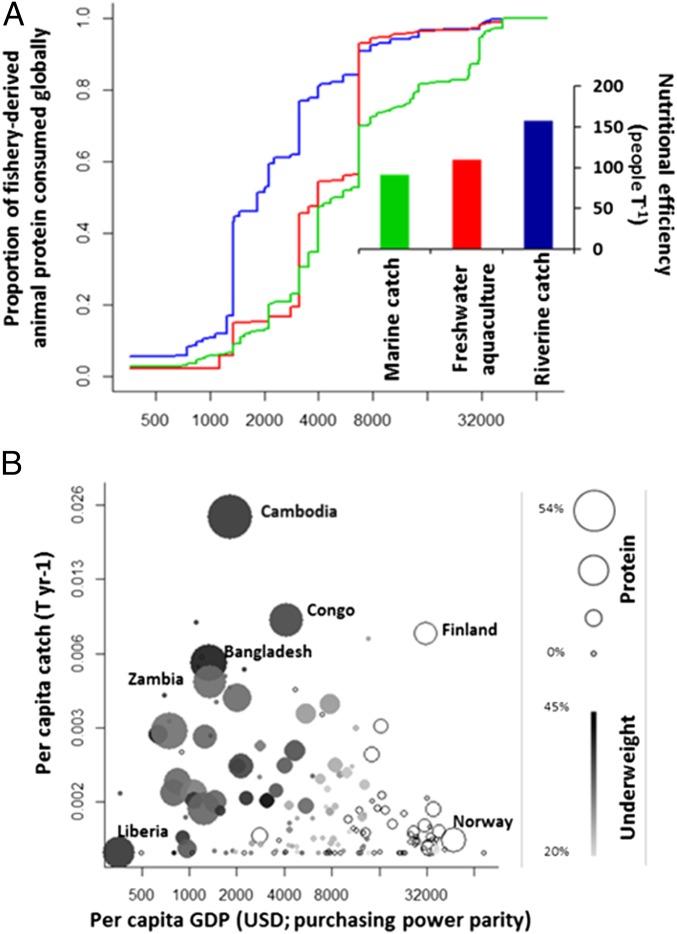
Fisheries are an essential ecosystem service, but catches from freshwaters are often overlooked. Hundreds of millions of people around the world benefit from low-cost protein, recreation, and commerce provided by freshwater fisheries, particularly in regions where alternative sources of nutrition and employment are scarce. Here, we derive a gridded global map of riverine fisheries and assess its implications for biodiversity conservation, fishery sustainability, and food security. Catches increase with river discharge and human population density, and 90% of global catch comes from river basins with above-average stress levels. Fish richness and catches are positively but not causally correlated, revealing that fishing pressure is most intense in rivers where potential impacts on biodiversity are highest. Merging our catch analysis with nutritional and socioeconomic data, we find that freshwater fisheries provide the equivalent of all dietary animal protein for 158 million people. Poor and undernourished populations are particularly reliant on inland fisheries compared with marine or aquaculture sources. The spatial coincidence of productive freshwater fisheries and low food security highlights the critical role of rivers and lakes in providing locally sourced, low-cost protein. At the same time, intensive fishing in regions where rivers are already degraded by other stressors may undermine efforts to conserve biodiversity. This syndrome of poverty, nutritional deficiency, fishery dependence, and extrinsic threats to biodiverse river ecosystems underscores the high stakes for improving fishery management. Our enhanced spatial data on estimated catches can facilitate the inclusion of inland fisheries in environmental planning to protect both food security and species diversity.

Keywords: ecosystem services; fish diversity; fishing pressure; rivers; subsistence fishery.


Conflict of interest statement

The authors declare no conflict of interest.

Figures

Fig. 1.
Fig. 1.
Gridded global map of estimated riverine fish catches at 6-arcmin (∼10-km) resolution. Catch is modeled based on discharge and constrained using national statistics. Blank space represents areas with negligible overland flow, gray indicates nations that lack reliable catch data, and black outlines indicate ecoregions where catch can be estimated but dominance of lake or marine fishes required exclusion from testing environmental predictors.
Fig. 2.
Fig. 2.
Relationships of estimated riverine fish catch to river discharge (A) and fish species richness (B) across freshwater ecoregions. Hierarchical variance partitioning was used to estimate effects of each environmental factor when discharge is included in the model (C) or removed statistically (D). Bars indicate the magnitude of positive (solid) or negative (open) effects.
Fig. S1.
Fig. S1.
Calibration of catch distribution model. Annual catch (C) increases as a power function of mean annual discharge (Q), and both linearized and untransformed equations are indicated (R2 = 0.64). The relationship was fitted using reduced major axis regression to account for considerable uncertainty in both C and Q. Data are provided in Dataset S1.
Fig. S2.
Fig. S2.
Relationship between catch estimates that were constrained by FAO national statistics vs. potential (i.e., unconstrained) catches for ecoregions listed in Dataset S2 (n = 316; gray line indicates 1:1 relationship).
Fig. S3.
Fig. S3.
Relationship between observed and modeled catch data for river basins listed in Dataset S1 (n = 40). The dashed line indicates a 1:1 relationship; the solid line and equation indicate the fitted relationship.
Fig. 3.
Fig. 3.
Global riverine fish catch relative to a biodiversity threat index at three spatial scales: grid cells, ecoregions, and river basins. Lines show cumulative proportion of total catch as threat levels increase. The threat index accounts for physical, chemical, and biological alteration of rivers and their watersheds, and is modified from ref. by excluding fishing pressure. The Inset illustrates the cumulative distribution of global catch across ecoregions and rivers in rank order.
Fig. S4.
Fig. S4.
Riverine fish catch relative to a biodiversity threat index at (A) ecoregional (49) (n = 316; Dataset S2) and (B) river basin (54) (n = 4,021) scales. The threat index is modified from ref. by excluding fishing pressure.
Fig. 4.
Fig. 4.
Global nutritional dependence and catch rates from inland fisheries relative to national GDP per capita. (A) Dependence on fish for dietary animal protein occurs at lower GDP for freshwater fisheries than aquaculture or marine fisheries. Nutritional efficiency—the number of people whose animal protein consumption is met per ton of fish protein eaten—is highest for freshwater fish (Inset). (B) Catch per capita varies widely with GDP, as does the proportion of animal protein derived from freshwater fish (indicated by bubble size; 0–54% across 154 nations) and children <5 y of age who are underweight (indicated by bubble shading; 20–45% across 90 nations; open bubbles indicate no data). Economic and nutritional data were drawn from the FAO (11, 46) and World Bank (54).

References

    1. Palmer MA, Febria CM. Ecology. The heartbeat of ecosystems. Science. 2012;336(6087):1393–1394. - PubMed
    1. Tittensor DP, et al. A mid-term analysis of progress toward international biodiversity targets. Science. 2014;346(6206):241–244. - PubMed
    1. Larsen FW, Londoño-Murcia MC, Turner WR. Global priorities for conservation of threatened species, carbon storage, and freshwater services: Scope for synergy? Conserv Lett. 2011;4(5):355–363.
    1. Vörösmarty CJ, et al. Global threats to human water security and river biodiversity. Nature. 2010;467(7315):555–561. - PubMed
    1. Strayer DL, Dudgeon D. Freshwater biodiversity conservation: Recent progress and future challenges. J N Am Benthol Soc. 2010;29(1):344–358.

LinkOut - more resources