. 2016 Nov 1;113(44):12414-12419.
doi: 10.1073/pnas.1611763113. Epub 2016 Oct 17.

Increasing seed size and quality by manipulating BIG SEEDS1 in legume species

Affiliations

Increasing seed size and quality by manipulating BIG SEEDS1 in legume species

Liangfa Ge et al. Proc Natl Acad Sci U S A. .

Abstract

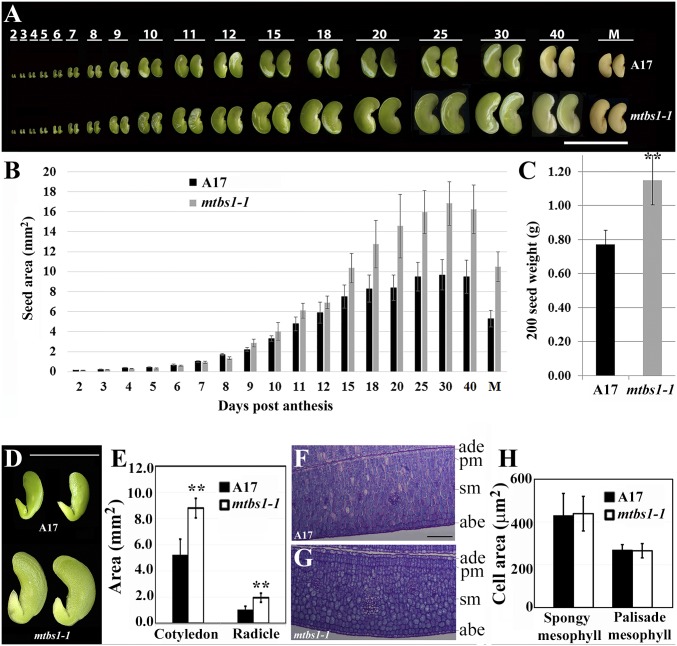
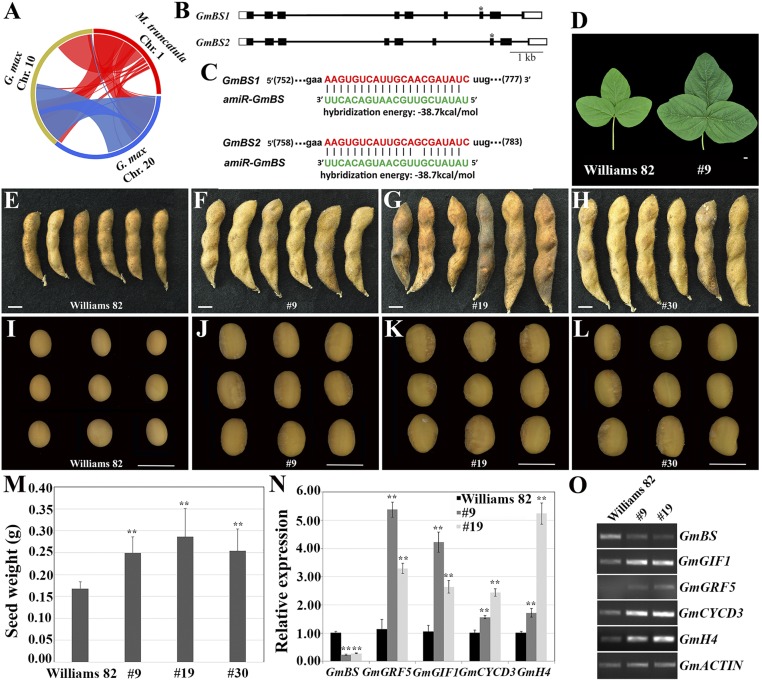
Plant organs, such as seeds, are primary sources of food for both humans and animals. Seed size is one of the major agronomic traits that have been selected in crop plants during their domestication. Legume seeds are a major source of dietary proteins and oils. Here, we report a conserved role for the BIG SEEDS1 (BS1) gene in the control of seed size and weight in the model legume Medicago truncatula and the grain legume soybean (Glycine max). BS1 encodes a plant-specific transcription regulator and plays a key role in the control of the size of plant organs, including seeds, seed pods, and leaves, through a regulatory module that targets primary cell proliferation. Importantly, down-regulation of BS1 orthologs in soybean by an artificial microRNA significantly increased soybean seed size, weight, and amino acid content. Our results provide a strategy for the increase in yield and seed quality in legumes.

Keywords: Medicago; forage quality; plant organ size; seed size; soybean.


Conflict of interest statement

The authors declare no conflict of interest.

Figures

Fig. 1.
Fig. 1.
M. truncatula bs1-1 mutant exhibited increased seed size and weight. (A) Time-course analysis of seed development in WT (A17; Top) and mtbs1-1 mutant (Bottom). Numbers denote days post anthesis (DPA). M, mature stage. Two representative seeds are shown for each time point. The panel is composed of multiple images that were taken at different time points and aligned in Photoshop. (B) Measurements of seed area during seed development. Shown are means ± SD for n = 12. (C) Measurements of 200 seed weight. Shown are means ± SD for n = 3. **P < 0.001, Student’s t test. (D) Morphology of cotyledon and radicle of seeds 25 DPA, after removing seed coat. The panel is composed of images of two genotypes. (E) Measurements of cotyledon and radicle area. Shown are means ± SD for n = 7. **P < 0.001, Student’s t test. (F and G) Cross-sections of cotyledon of seeds 25 DPA in A17 (F) and mtbs1-1 (G). abe, abaxial epidermis; ade, adaxial epidermis; pm, palisade mesophyll; sm, spongy mesophyll. (H) Measurements of mesophyll cell area of cotyledon. Shown are means ± SD for n = 60. **P < 0.001, Student’s t test. (Scale bars: C, 1 cm; D, 0.5 cm; F and G, 100 μm.
Fig. 2.
Fig. 2.
Cloning and characterization of Medicago BS1 gene. (A) Map-based cloning leads to identification of a deletion at the BS1 locus. Shown are introns (horizontal lines), exons (solid boxes), and 5′ and 3′ untranslated regions (open boxes) of the BS1 locus, and the deletion region delimited by vertical lines. (B) RT-PCR analysis shows lack of BS1 transcripts in the mtbs1-1 mutant, in contrast to WT (A17). The expression of an ACTIN gene is present in both WT and mtbs1-1, serving as an internal control. (C and D) BS1-GFP fusion protein is localized to the nucleus in tobacco leaf epidermal cells. Shown are a confocal image of a tobacco leaf transiently expressing 35S::BS1-GFP and an overlay with a Normaski image. (E and F) As a control, free GFP driven by the 35S promoter was localized to the cytoplasm. (GJ) RNA in situ hybridization shows that BS1 transcripts were detected in SAM and leaf primordia as early as P0 in vegetative shoot bud (G) and in developing petal (p), carpel (c) and ovule (o) during reproductive development (I). No signals were detected in neighboring tissue sections when a sense probe was used (H and J). (K). Amino acid sequence alignments of BS1 homologs from alfalfa (M. sativa), soybean (G. max), and L. japonicus with M. truncatula BS1. TIFY and CCT2 domains are underlined in red and blue, respectively.
Fig. 3.
Fig. 3.
Gene expression analysis of the mtbs1-1 mutant. (A) Transcript profiling analysis of core cell cycle genes in expanding leaves in mtbs1-1. Shown is a heat map of log2 fold changes in gene expression in vegetative shoot bud (VB) and young leaf (YL) samples between mtbs1-1 and A17. (B and C) Quantitative RT-PCR analysis of expression of Medicago HISTONE 4 (B) and CYCD3;3 (C) in young leaf, stipule, and seed samples in A17 and mtbs1-1 plants. Shows are means ± SD for n = 3. **P < 0.001, Student’s t test. (D) Transcript profiling analysis of genes whose homologs are known to regulate organ growth in A. thaliana. Shown is a heat map of log2 fold changes in gene expression between mtbs1-1 and A17. (E and F) qRT-PCR analysis of expression of Medicago GRF5 (E) and GIF1 (F) in young seed, leaf, and stipule samples in A17 and mtbs1-1 plants. Shows are means ± SD for n = 3. **P < 0.001, Student’s t test. RNA samples were prepared from developing seeds at 6 DPA and leaflets and stipules of the second visible leaf from the shoot apex (B, C, E, and F). (GJ) RNA in situ hybridization shows that transcripts of MtGIF1 were detected in the shoot apical meristem (SAM), leaf primordia as early as P0 and lamina tissues in A17 (G) and mtbs1-1 (H). A sense probe for MtGIF1 did not detect any signals in neighboring tissue sections in A17 (I) and mtbs1-1 (J). (Scale bars: 100 µm.)
Fig. 4.
Fig. 4.
Down-regulation of BS1 orthologs resulted in increased organ size and seed weight in soybean. (A) Soybean chromosomes 10 and 20 are syntenic to Medicago chromosome 1, where BS1 is located. (B) GmBS1 and GmBS2 gene structures and artificial microRNA target sites. Shown are introns (horizontal lines), exons (solid boxes), and 5′ and 3′ untranslated regions (open boxes). *, artificial microRNA target sites. (C) Design of an artificial microRNA targeting a conserved coding sequence of GmBS1 and GmBS2. (D) Representative images of trifoliate leaves (D) of WT (Williams 82; Left) and the transgenic line 9 (Right). The panel is composed of two images. (EL) Representative images of mature seed pods (EH) and seeds (IL) of WT (Williams 82) and independent transgenic lines that overexpress the artificial microRNA, showing enlarged seed pods and seeds in transgenic lines. Individual seed images in (IL) were aligned in Photoshop. (M) Measurements show that seed weight was significantly increased in the transgenic lines. Shown are means ± SD for n = 5–11 plants. **P < 0.001, Student’s t test. (N and O) Quantitative RT-PCR (N) and RT-PCR (O) analyses show that soybean BS1 genes were significantly down-regulated, whereas GRF5, GIF1, CYCD3;3, and HISTONE4 genes were significantly up-regulated in young leaves in transgenic lines 9 and 19. Shown in N are means ± SD for n = 3. **P < 0.001, Student’s t test. (Scales bars: DL, 1 cm.)

References

    1. Lam HM, et al. Resequencing of 31 wild and cultivated soybean genomes identifies patterns of genetic diversity and selection. Nat Genet. 2010;42(12):1053–1059. - PubMed
    1. Schmutz J, et al. Genome sequence of the palaeopolyploid soybean. Nature. 2010;463(7278):178–183. - PubMed
    1. Masuda T, Goldsmith PD. World soybean production: Area harvested, yield, and long-term projections. Int Food Agribusiness Manage Rev. 2009;12(4):143–162.
    1. Linkies A, Graeber K, Knight C, Leubner-Metzger G. The evolution of seeds. New Phytol. 2010;186(4):817–831. - PubMed
    1. Li N, Li Y. Ubiquitin-mediated control of seed size in plants. Front Plant Sci. 2014;5:332. - PMC - PubMed

Publication types

MeSH terms

Associated data