. 2016 Nov 8;113(45):12637-12642.
doi: 10.1073/pnas.1612017113. Epub 2016 Oct 24.

Calcium transport into the cells of the sea urchin larva in relation to spicule formation

Affiliations

Calcium transport into the cells of the sea urchin larva in relation to spicule formation

Netta Vidavsky et al. Proc Natl Acad Sci U S A. .

Abstract

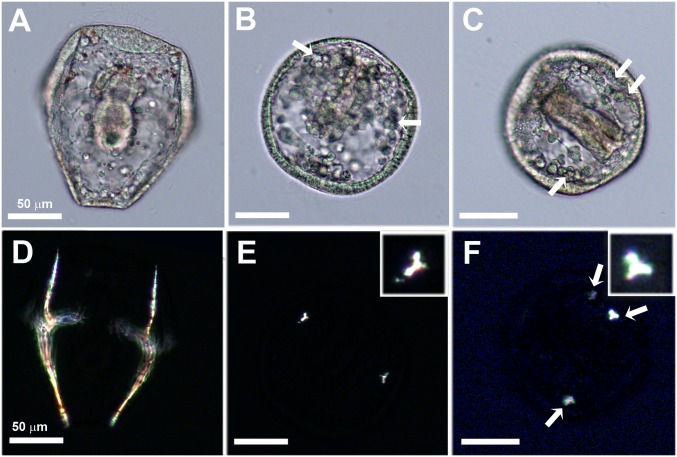
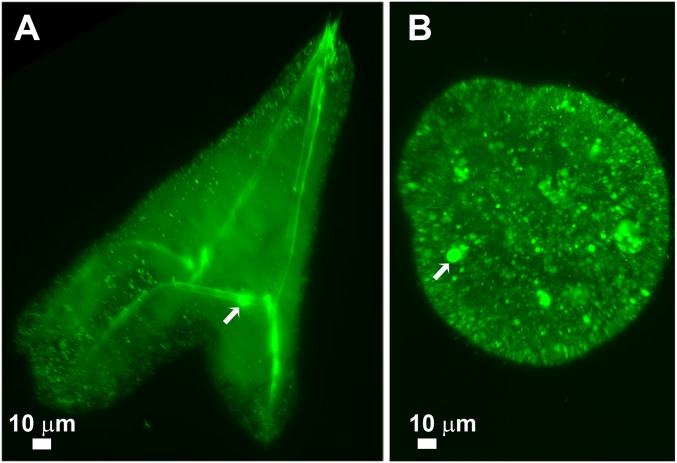
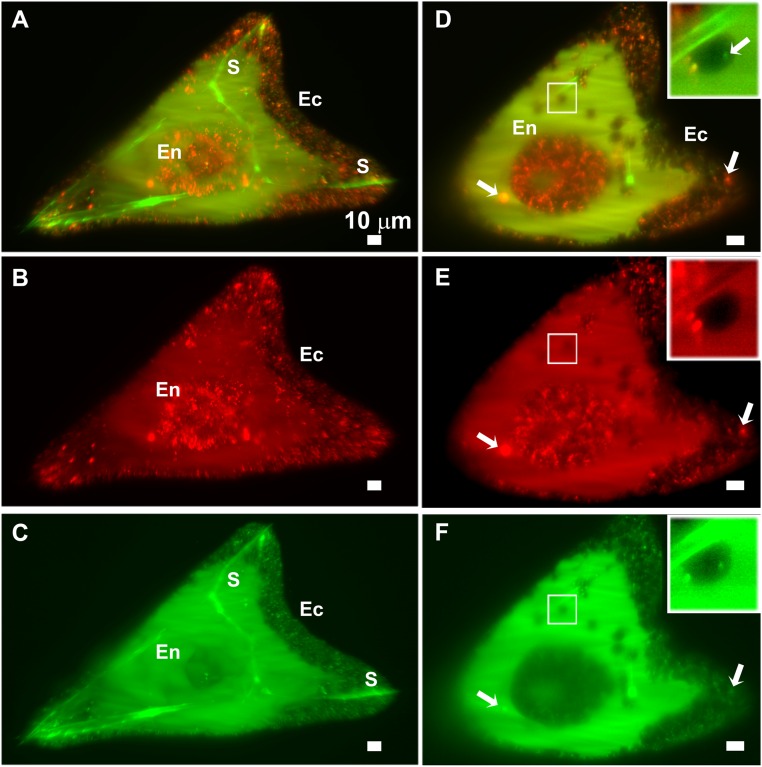
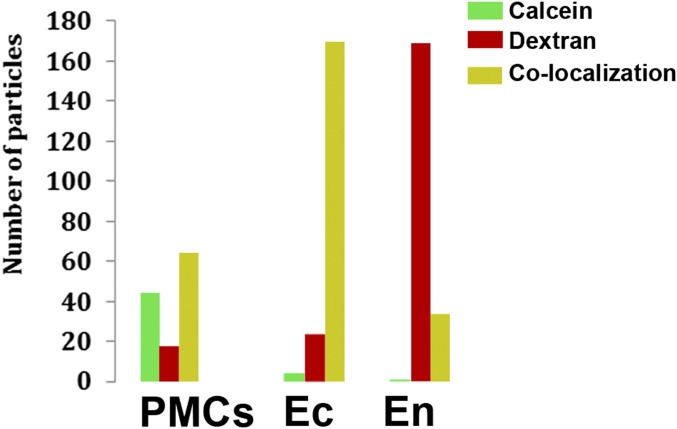
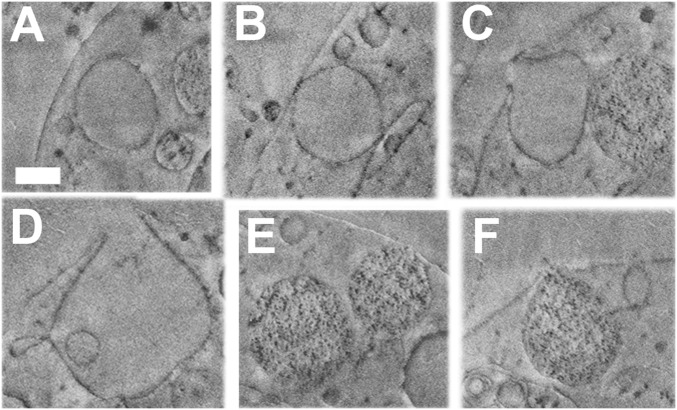
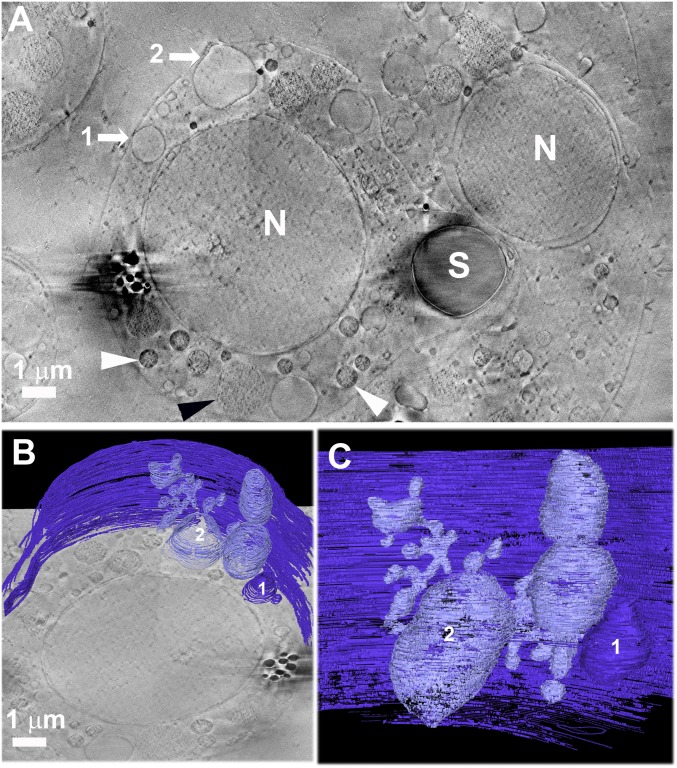
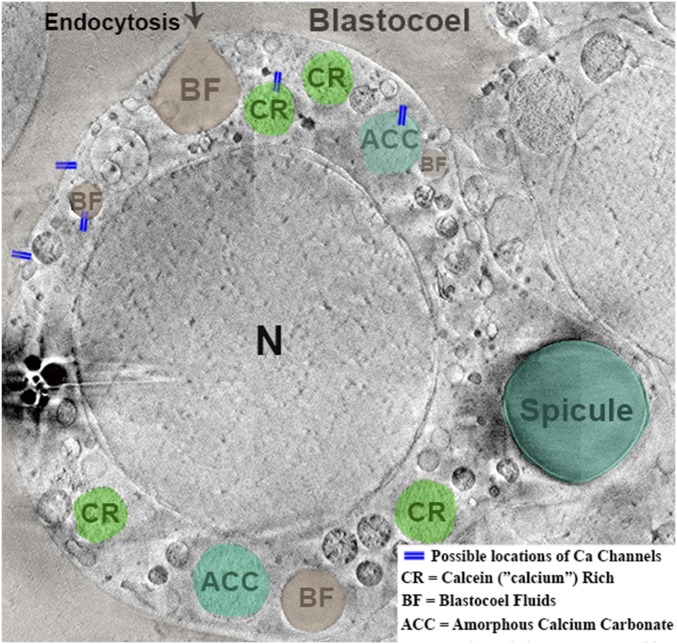
We investigated the manner in which the sea urchin larva takes up calcium from its body cavity into the primary mesenchymal cells (PMCs) that are responsible for spicule formation. We used the membrane-impermeable fluorescent dye calcein and alexa-dextran, with or without a calcium channel inhibitor, and imaged the larvae in vivo with selective-plane illumination microscopy. Both fluorescent molecules are taken up from the body cavity into the PMCs and ectoderm cells, where the two labels are predominantly colocalized in particles, whereas the calcium-binding calcein label is mainly excluded from the endoderm and is concentrated in the spicules. The presence of vesicles and vacuoles inside the PMCs that have openings through the plasma membrane directly to the body cavity was documented using high-resolution cryo-focused ion beam-SEM serial imaging. Some of the vesicles and vacuoles are interconnected to form large networks. We suggest that these vacuolar networks are involved in direct sea water uptake. We conclude that the calcium pathway from the body cavity into cells involves nonspecific endocytosis of sea water with its calcium.

Keywords: SPIM imaging; biomineralization; cryo-FIB-SEM; endocytosis; in vivo imaging.


Conflict of interest statement

The authors declare no conflict of interest.

Figures

Fig. 1.
Fig. 1.
Light microscope images of living sea urchin larvae 40 h postfertilization. (A and D) Sea urchin larva at the prism stage continuously developed inside sea water. The larva has a conical shape at this stage. The spicules are birefringent and appear illuminated under cross-polarizers (D). (B, C, E, and F) Sea urchin larvae that were continuously developed in the presence of verapamil, which inhibits L-calcium channels. The larvae are developed, showing epithelial layers and the forming gut, but have poorly developed spicules and a spherical shape. Small crystals in the shape of triradiate spicules are observed under polarized light (E and F). (B and C) The locations in which the birefringent crystals appear under polarized light are marked with arrows. In C and F an additional third crystalline granule appears (arrows). E and F, Insets show the magnified triradiate crystals (inset dimensions: 18 × 18 μm). (Scale bars: 50 μm.)
Fig. 2.
Fig. 2.
Lightsheet microscope images showing a 3D reconstruction of the calcein fluorescence signal obtained from whole live larvae at the prism stage. The larvae were continuously developed inside calcein-labeled sea water from fertilization. (A) The control larva contains calcein-labeled particles of sizes 0.5–1 μm. The spicule is also labeled with calcein, and the center of the initial triradiate spicule (arrow) is labeled with higher fluorescence intensity compared with the spicule rods. (B) A larva continuously developed inside calcein-labeled sea water containing verapamil, which inhibits the functioning of L-type calcium channels. The larva is spherical and is packed with calcein-labeled particles of sizes 1–2 μm. The larger body marked with an arrow is most likely a poorly developed spicule.
Fig. 3.
Fig. 3.
Lightsheet microscope images showing calcein (green) and alexa-dextran 680 (red) fluorescence from a live larva at the prism stage. The larva was continuously developed in calcein- and dextran-Alexa 680–labeled sea water from fertilization. (AC) Three-dimensional reconstructions of serial sections through the entire larva. (DF) Individual slice showing the fluorescence from one plane. (Insets) PMC that is adjacent to the spicule (marked with a rectangle) and in focus (inset dimensions: 11 × 11 μm). (A) Superimposition of calcein (green) and alexa-dextran (red) fluorescence signals.The spicule is labeled with calcein. Most of the red and green labels in the larva colocalize, resulting in an orange signal, except in the spicules and in the endoderm (the gut) area. (B) Alexa-dextran fluorescence signal showing intracellular particles that are very prominent in the endoderm. (C) Calcein fluorescence signal showing the labeled spicules, intracellular calcein-labeled particles, and a cloud in the blastocoel. (D) Superimposition of the calcein (green) and alexa-dextran (red) fluorescence signals in one plane within the larva. Most of the particle signals colocalize (orange), but not all (arrow, compare with E and F). (Inset) Intracellular particles inside the PMC. (E) Alexa-dextran fluorescence signal. (F) Calcein fluorescence signal. (DF, Insets) A particle that is only labeled with calcein is marked with an arrow. Ec, ectoderm cells; En, endoderm cells; and S, spicule. (Scale bars: 10 μm.)
Fig. 4.
Fig. 4.
The size, type of labeling, and location of 522 particles, obtained from analysis of individual Lightsheet images (Materials and Methods), similar to the slices shown in Fig. 3 DF. The green columns represent particles that are only labeled with calcein. The red columns represent particles that are only labeled with alexa-dextran. The yellow columns represent particles in which calcein and alexa-dextran labels colocalize. Approximately half of the particles in the PMCs display label colocalization. Almost all of the particles that are located inside ectoderm cells (Ec) display label colocalization. Most of the particles that are located inside endoderm cells (En) only display alexa-dextran labeling.
Fig. 5.
Fig. 5.
Cryo-FIB-SEM micrographs of parts of a PMC from a sea urchin larva at the prism stage. Proteins, lipids, and membranes appear dark, whereas water-rich regions such as aqueous cytosol appear in uniform light gray in cryo-FIB-SEM. The series of micrographs is taken from Movie S1. (AD) Vesicles bearing a uniform content similar in texture and gray levels to cytoplasm and extracellular fluids. (E and F) Vesicles containing dark particles. (A) No contact of the vesicle with the plasma membrane. (B) The vesicle contacts the plasma membrane. (C) The vesicle is open toward the blastocoel. (D) The vesicle has a wide opening toward the blastocoel and branches into smaller vesicles. (E) One vesicle (to the right) touches the plasma membrane, but the other does not. (F) Vesicle in contact with the plasma membrane and open toward the blastocoel. (Scale bars: 500 nm for all panels.)
Fig. 6.
Fig. 6.
(A) Cryo-FIB-SEM micrograph of a single section of a high-pressure-frozen sea urchin larva at the prism stage, taken from Movie S1. Vesicles that are in contact with the plasma membrane of a PMC are marked by arrows, 1 and 2. The vesicle labeled “2” is the same as in Fig. 5D but taken from a different section. Organelles such as mitochondria are detected (white arrowhead), as well as nanoparticle-containing vesicles (black arrowhead). The black organelles on the left of the picture are most probably lipid bodies. (B and C) Three-dimensional manual segmentation of the plasma membrane and the vesicles that are in contact with it. The 3D view reveals that vesicles (1 and 2) are connected to each other, forming a branched 3D intracellular vacuole with multiple docking points in the plasma membrane. The vacuole spreads and in some locations is in close proximity to the nuclear envelope. See also Movie S2. N, nuclei and S, spicule. Contrast differences between the two sides of the image result from image processing (see Methods).
Fig. 7.
Fig. 7.
Schematic representation of the conceivable scenarios for the endocytosis process, overlaid on a cryo-FIB-SEM micrograph. Colors were arbitrarily designated to the intracellular vesicles to show possible cellular processing of the uptaken blastocoel fluids (BF). Possible location of calcein-rich (CR) and amorphous calcium carbonate (ACC) vesicles are shown in green. The blue lines indicate some of the possible locations of calcium channels in the cells and vesicles. Contrast differences between the two sides of the image result from image processing (see Methods).

References

    1. Guéguen L, Pointillart A. The bioavailability of dietary calcium. J Am Coll Nutr. 2000;19(sup2):119S–136S. - PubMed
    1. Bentov S, Brownlee C, Erez J. The role of seawater endocytosis in the biomineralization process in calcareous foraminifera. Proc Natl Acad Sci USA. 2009;106(51):21500–21504. - PMC - PubMed
    1. Nakano E, Okazaki K, Iwamatsu T. Accumulation of radioactive calcium in larvae of the sea urchin Pseudocentrotus depressus. Biol Bull. 1963;125(1):125–132.
    1. McMahon RF, Bogan A. In: Mollusca: Bivalvia. Ecology and Classification of North American Freshwater Invertebrates. Thorp JH, Covich AP, editors. Academic; San Diego: 1991. pp. 315–399.
    1. Young JR, Henriksen K. Biomineralization within vesicles: The calcite of coccoliths. Rev Mineral Geochem. 2003;54(1):189–215.

LinkOut - more resources