. 2016 Nov 1;113(44):E6766-E6775.
doi: 10.1073/pnas.1615316113. Epub 2016 Oct 17.

Structural basis of recognition of farnesylated and methylated KRAS4b by PDEδ

Affiliations

Structural basis of recognition of farnesylated and methylated KRAS4b by PDEδ

Srisathiyanarayanan Dharmaiah et al. Proc Natl Acad Sci U S A. .

Abstract

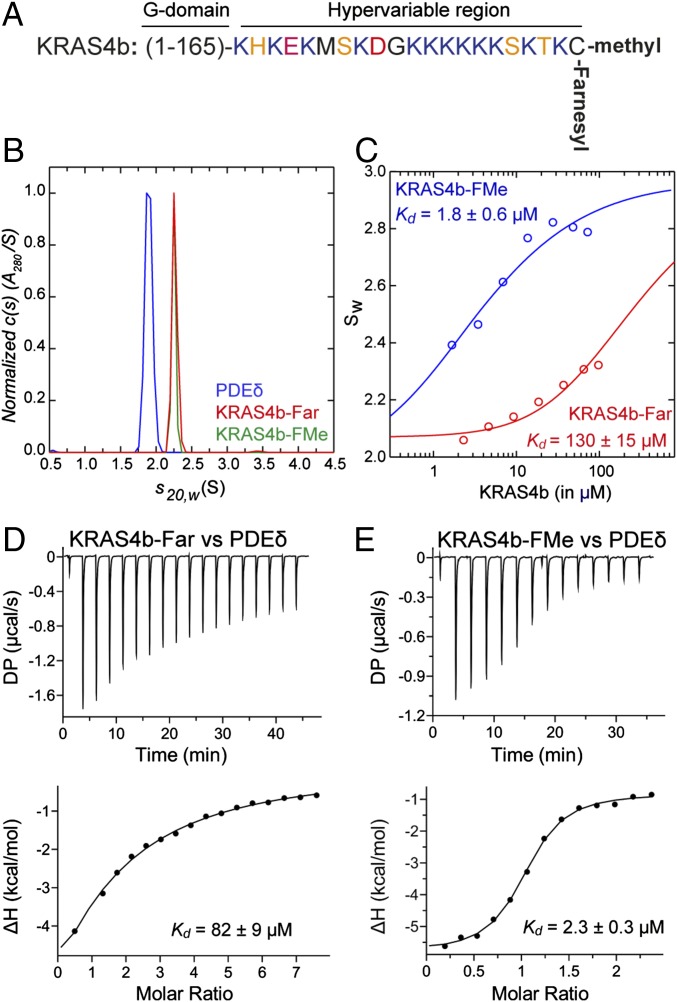
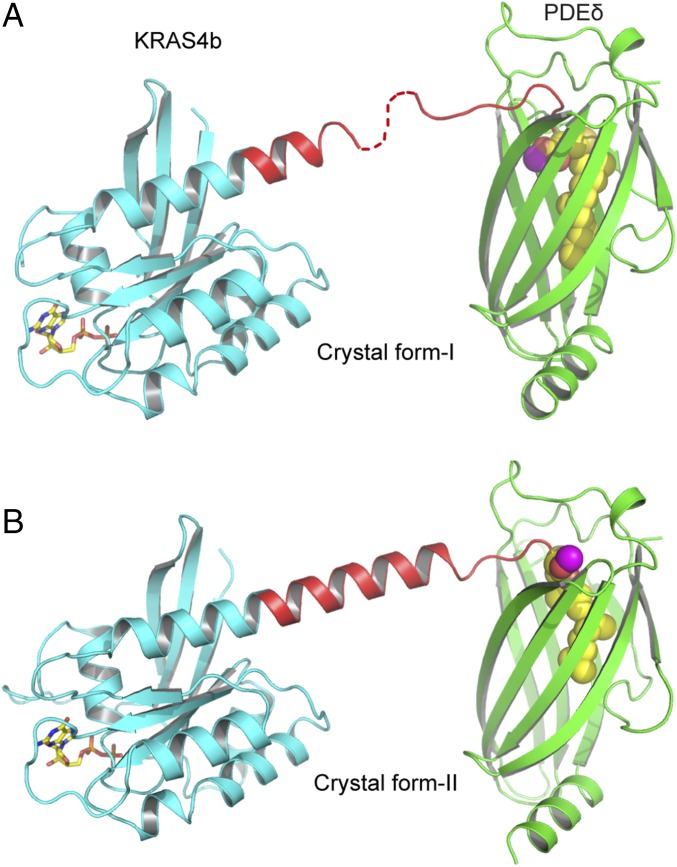
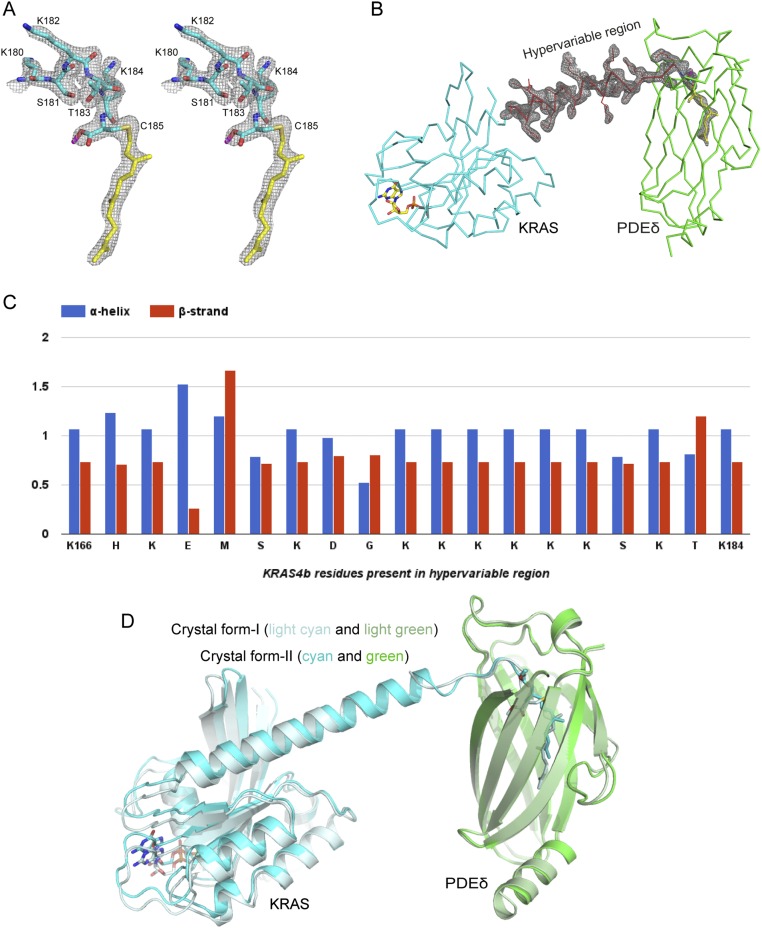
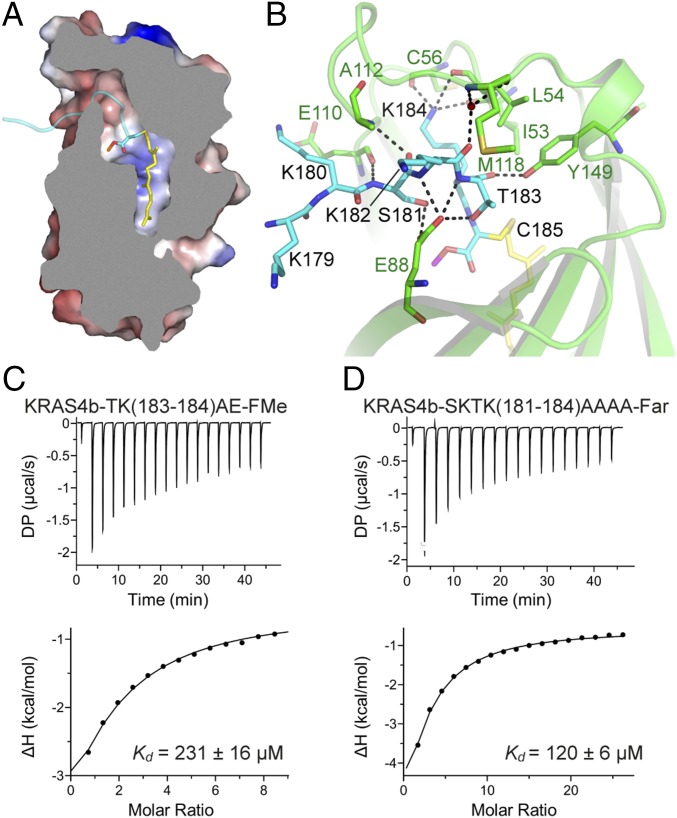
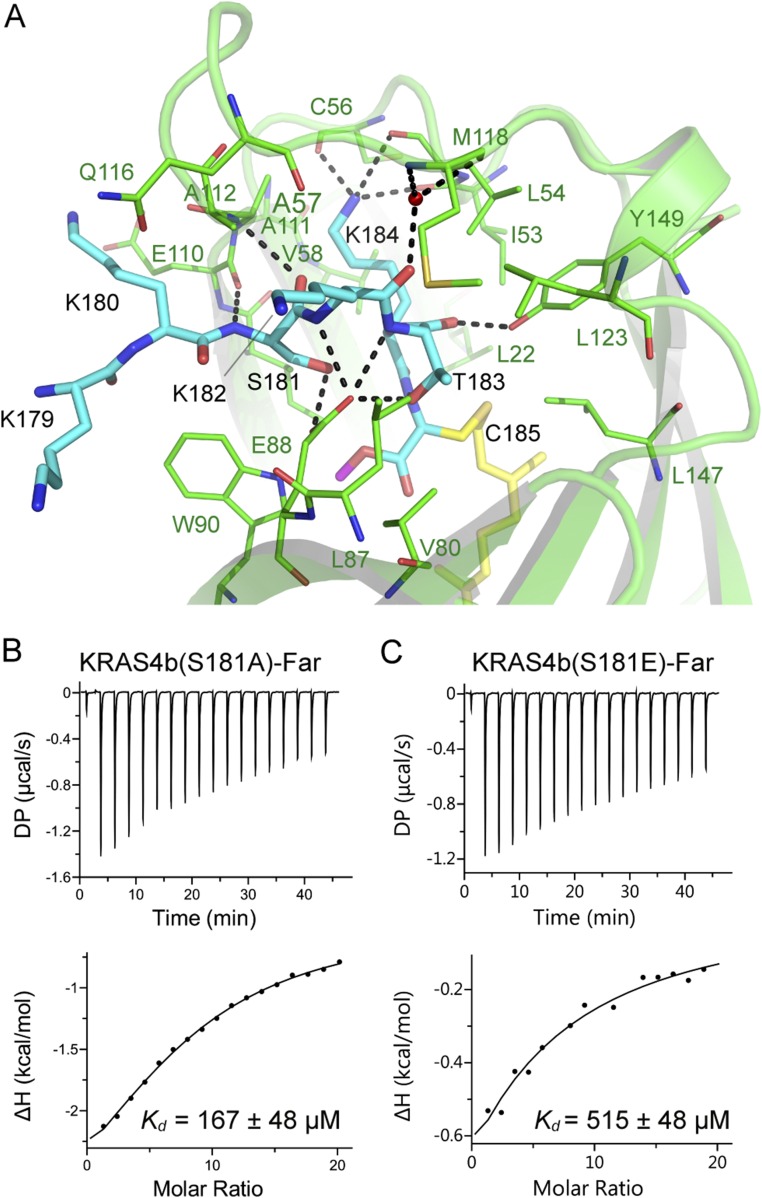
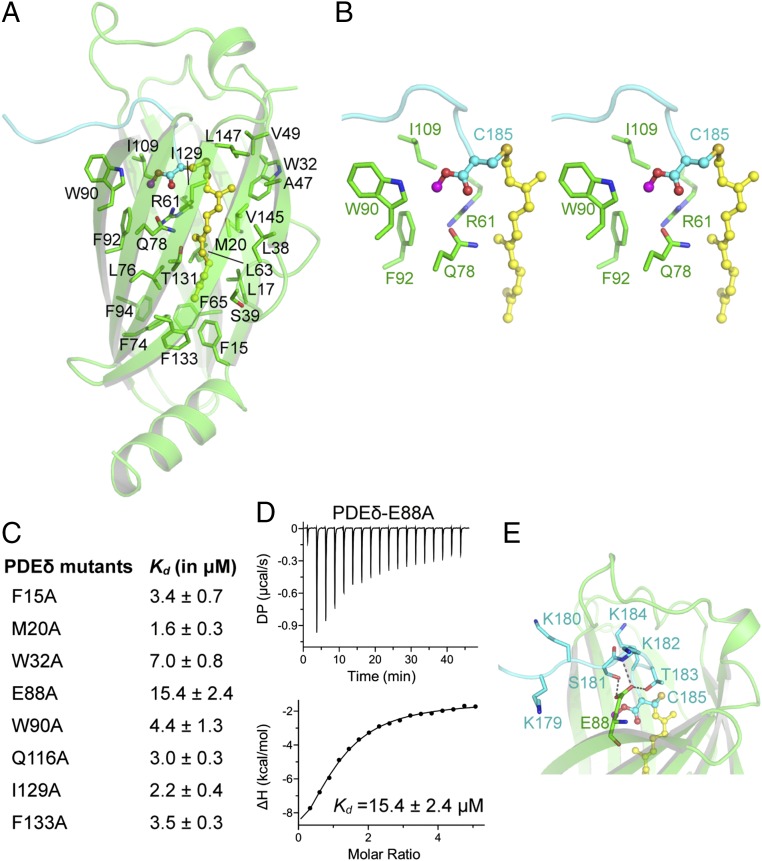
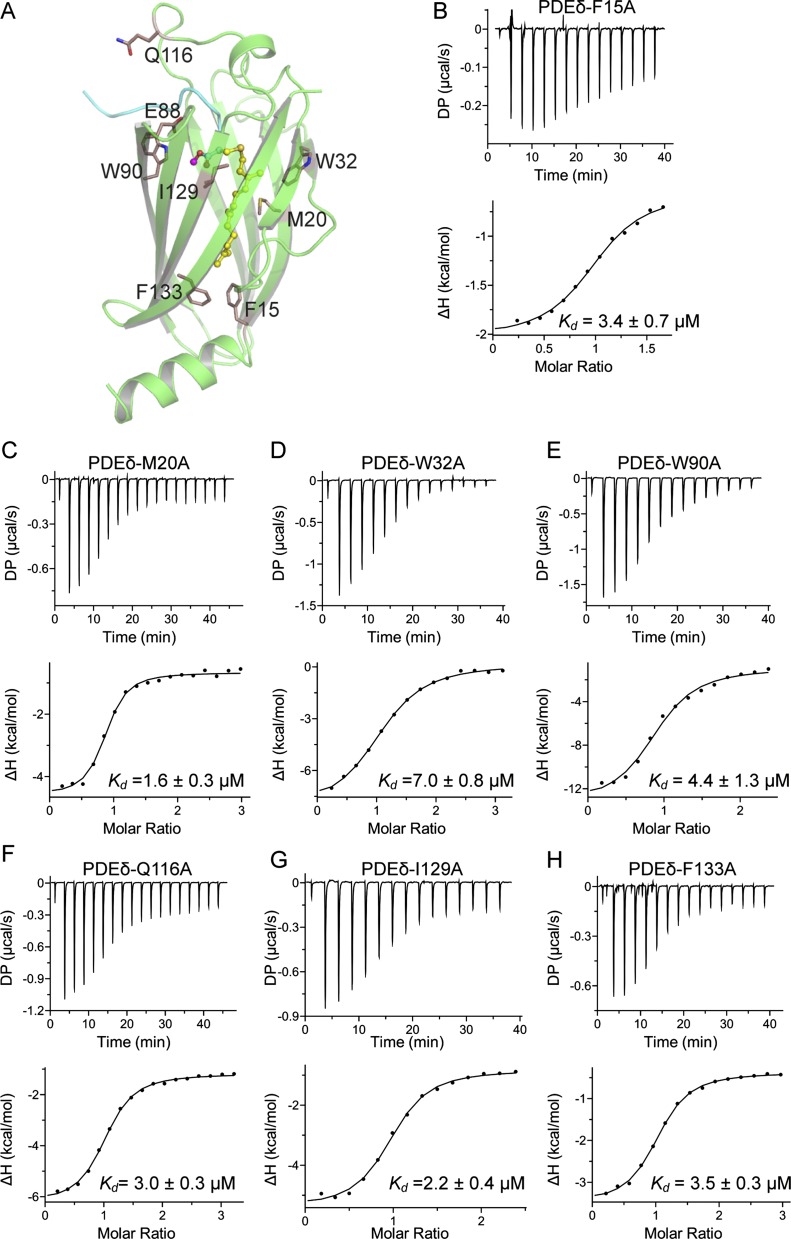
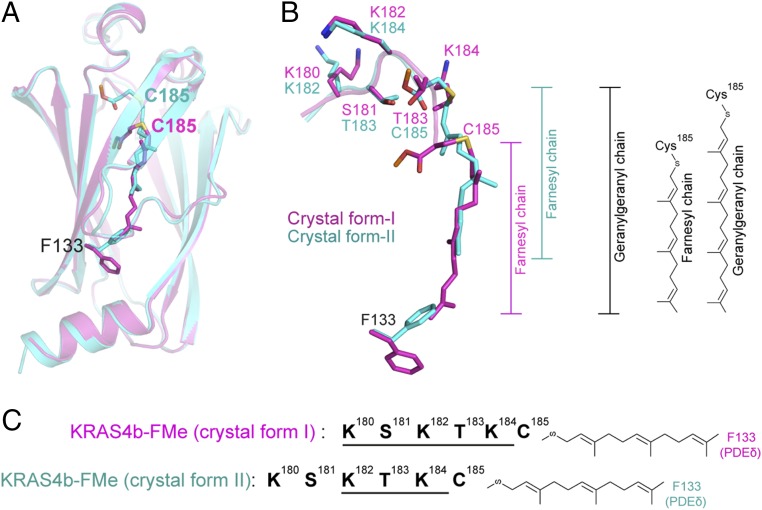
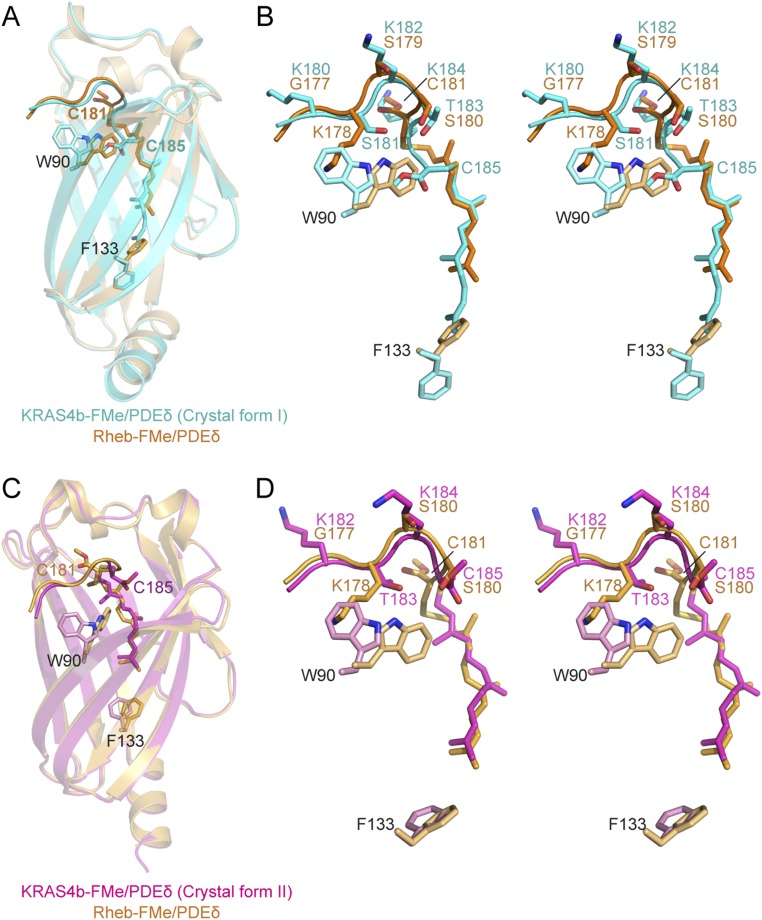
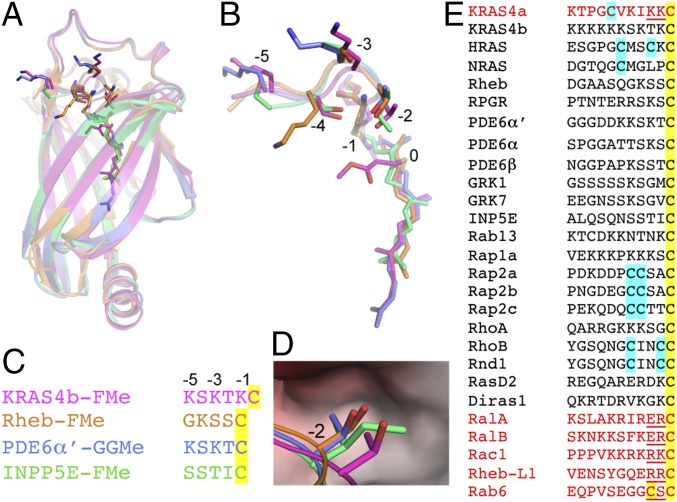
Farnesylation and carboxymethylation of KRAS4b (Kirsten rat sarcoma isoform 4b) are essential for its interaction with the plasma membrane where KRAS-mediated signaling events occur. Phosphodiesterase-δ (PDEδ) binds to KRAS4b and plays an important role in targeting it to cellular membranes. We solved structures of human farnesylated-methylated KRAS4b in complex with PDEδ in two different crystal forms. In these structures, the interaction is driven by the C-terminal amino acids together with the farnesylated and methylated C185 of KRAS4b that binds tightly in the central hydrophobic pocket present in PDEδ. In crystal form II, we see the full-length structure of farnesylated-methylated KRAS4b, including the hypervariable region. Crystal form I reveals structural details of farnesylated-methylated KRAS4b binding to PDEδ, and crystal form II suggests the potential binding mode of geranylgeranylated-methylated KRAS4b to PDEδ. We identified a 5-aa-long sequence motif (Lys-Ser-Lys-Thr-Lys) in KRAS4b that may enable PDEδ to bind both forms of prenylated KRAS4b. Structure and sequence analysis of various prenylated proteins that have been previously tested for binding to PDEδ provides a rationale for why some prenylated proteins, such as KRAS4a, RalA, RalB, and Rac1, do not bind to PDEδ. Comparison of all four available structures of PDEδ complexed with various prenylated proteins/peptides shows the presence of additional interactions due to a larger protein-protein interaction interface in KRAS4b-PDEδ complex. This interface might be exploited for designing an inhibitor with minimal off-target effects.

Keywords: KRAS4b; KRAS–PDEδ complex; phosphodiesterase-δ; prenylation; protein–protein interaction.


Conflict of interest statement

The authors declare no conflict of interest.

Figures

Fig. 1.
Fig. 1.
Carboxymethylation of farnesylated C185 is important for KRAS4b–PDEδ interaction. (A) Amino acid sequence of the HVR of KRAS4b showing the presence of a polylysine patch and farnesylated and carboxymethylated C185 at the C terminus. (B) Normalized absorbance c(s) profiles for PDEδ (15 μM; blue), KRAS4b-FMe (28 μM; red), and KRAS4b-Far (40 μM; green) in SV-AUC experiments show that these three proteins are monomers. Similar profiles were observed using the interference optical detection system. (C) Weighted absorbance sedimentation coefficient isotherms based on c(s) profiles for PDEδ and KRAS4b-FMe (blue) and PDEδ and KRAS4b-Far (red). Data were globally modeled in terms of an A + B = AB heteroassociation model, as described in the text, to yield the best fit shown. (D and E) ITC titration experiments to measure the dissociation constant (D) between KRAS4b-Far and PDEδ and (E) between KRAS4b-FMe and PDEδ. The DP is a measured differential power between the reference cell and the sample cell.
Fig. S1.
Fig. S1.
The association properties of PDEδ with KRAS4b-Far and KRAS4b-FMe measured using SV-AUC. (A) Absorbance c(s) profiles for approximately equimolar mixtures of PDEδ and KRAS4b-FMe at various concentrations. Based on a determination of the stock solution concentrations, the actual ratio is 1.08:1 KRAS4b-FMe:PDEδ. KRAS4b-FMe concentrations and cell path length are indicated. Similar profiles were observed using the interference optical detection system. (B) Absorbance c(s) profiles for approximately equimolar mixtures of PDEδ and KRAS4b-Far at various concentrations. Based on a determination of the stock solution concentrations, the actual ratio is 1.32:1 KRAS4b-Far:PDEδ. KRAS4b-Far concentrations and cell path length are indicated. Similar profiles were observed using the interference optical detection system.
Fig. 2.
Fig. 2.
Overall structure of KRAS4b–PDEδ complex in two different crystal forms. (A) Ribbon representation of GDP-bound KRAS4b-FMe in complex with PDEδ in crystal form I. (B) Ribbon representation of GDP-bound KRAS4b-FMe in complex with PDEδ in crystal form II. The PDEδ, GTPase domain, and HVR of KRAS4b are shown in green, cyan, and red, respectively. The farnesyl chain is shown as spheres and colored yellow. The carbon and oxygen atoms of carboxymethyl group are colored magenta and red, respectively. GDP is shown as a stick and colored yellow (carbon) and red (oxygen).
Fig. S2.
Fig. S2.
Electron density corresponding to the HVR residues, superposition of two crystal forms, and secondary structure propensity analysis of the HVR residues. (A) 2Fo-Fc map contoured at 1.0σ for the HVR residues interacting with PDEδ and farnesylated–methylated C185 in the KRAS4b–PDEδ complex in crystal form I. (B) 2Fo-Fc map contoured at 1.0σ for the HVR residues and farnesylated–methylated C185 in the KRAS4b–PDEδ complex in crystal form II. (C) Secondary structure propensity for residues present in the HVR of KRAS4b. (D) Structural superposition of two crystal forms of KRAS4b–PDEδ complexes aligned using residues of PDEδ. KRAS4b and PDEδ in crystal form I are colored light cyan and light green, respectively and in crystal form II, are colored cyan and green, respectively. Farnesylated–methylated C185 and GDP are shown in stick representation.
Fig. 3.
Fig. 3.
Details of intermolecular protein–protein interactions in KRAS4b–PDEδ complex and impact of mutation of the HVR residues on KRAS4b–PDEδ interaction. (A) Sliced view of an electrostatic representation of PDEδ showing the region where the HVR residues (colored cyan) bind and a central hydrophobic pocket that accommodates farnesylated (colored yellow and shown in stick representation) and methylated C185 (colored cyan and shown in stick representation). (B) Intermolecular hydrogen bonding contacts involving residues from the HVR of KRAS4b and PDEδ. Residues from PDEδ and KRAS4b are shown in stick representation and colored green and cyan, respectively. The farnesyl and methyl groups are shown in stick representation and colored yellow and magenta, respectively. Dashed black lines indicate intermolecular hydrogen bonds. (C) ITC titration experiments to measure the dissociation constant between farnesylated–methylated double mutant (T183A-K184E) of KRAS4b and WT PDEδ. (D) ITC titration experiments to measure the dissociation constant between farnesylated quadruple mutant (S181A-K182A-T183A-K184A) of KRAS4b and WT PDEδ. This mutant could only be expressed and purified in farnesylated form in our engineered insect cell expression system. DP, differential power.
Fig. S3.
Fig. S3.
Details of intermolecular protein–protein interaction in KRAS4b–PDEδ complex and impact of mutation of the HVR residues on KRAS4b–PDEδ interaction. (A) Intermolecular hydrogen bonding contact involving residues from the HVR of KRAS4b and PDEδ. PDEδ residues involved in hydrophobic and van der Waals interactions with KRAS4b residues are also shown. Residues from PDEδ and KRAS4b are shown in stick representation and colored green and cyan, respectively. The farnesyl and methyl groups are shown in stick representation and colored yellow and magenta, respectively. Dashed black lines indicate intermolecular hydrogen bonds. (B) ITC measurement for binding of farnesylated S181A mutant of KRAS4b to WT PDEδ. (C) ITC measurement for binding of farnesylated S181E mutant of KRAS4b to WT PDEδ. DP, differential power.
Fig. 4.
Fig. 4.
Recognition of farnesylated and carboxymethylated C185 of KRAS4b by PDEδ and impact of mutation of PDEδ residues on KRAS4b–PDEδ interaction. (A) Nonpolar residues (colored green; stick representation) of PDEδ form a hydrophobic pocket that accommodates the farnesyl chain (colored yellow; ball and stick representation) and carboxymethyl group (magenta and cyan; ball and stick representation). (B) Stereo view of the PDEδ pocket formed by residues (colored green; stick) that accommodates the carboxymethyl group (colored magenta and cyan; ball and stick) of farnesylated C185 (colored yellow; ball and stick). (C) Dissociation constant of PDEδ mutants with KRAS4b-FMe measured using ITC titration experiments. (D) ITC titration experiments to measure the dissociation constant between PDEδ–E88A mutant and KRAS4b-FMe. (E) Intermolecular hydrogen bonds formed by PDEδ residue E88 (colored green; stick) with HVR residues (colored cyan; stick). DP, differential power.
Fig. S4.
Fig. S4.
Impact of mutations of PDEδ residues on KRAS4b–PDEδ interaction. (A) Position of eight PDEδ residues that were mutated in this study. ITC measurements showing dissociation constant of KRAS4b-FMe with PDEδ mutants (B) PDEδ-F15A, (C) PDEδ-M20A, (D) PDEδ-W32A, (E) PDEδ-W90A, (F) PDEδ-Q116A, (G) PDEδ-I129A, and (H) PDEδ-F133A. DP, differential power.
Fig. 5.
Fig. 5.
Structural comparison of two crystal forms of KRAS4b–PDEδ complex shows two possible modes of binding between KRAS4b and PDEδ. (A) Structural superposition of PDEδ residues from two crystal forms showing different positions of farnesyl and methyl groups attached to C185. Crystal forms I and II are colored magenta and cyan, respectively. (B) Enlarged view of structural superposition of HVR residues and farnesylated–methylated C185 from two crystal forms showing upstream shift of the HVR residues by two amino acids at the protein–protein interaction interface in crystal form II, resulting in the empty space in the central hydrophobic pocket of PDEδ. Positions of the farnesyl chains are shown. Structural superposition of the two crystal forms suggests that the empty space inside the hydrophobic pocket of PDEδ in crystal form II would fit an additional five carbons present on the geranylgeranyl chain. (C) Schematic diagram showing a 2-aa shift of the HVR residues in crystal form II. Because of the unique amino acid composition in the region, interaction interface formed by residues K182-T183-K184 residues in crystal form II mimics the interaction interface formed by residues K180-S181-K183 in crystal form I.
Fig. 6.
Fig. 6.
KRAS4b–PDEδ structure in crystal form II mimics the binding of KRAS4b-GGMe to PDEδ and identification of a new sequence motif in the HVR of KRAS4b. (A) Schematic diagram showing the additional five carbon atoms present in the geranylgeranyl chain compared with the farnesyl chain. (B) Structural superposition of prenylated C185 and the HVR residues from KRAS4b-FMe–PDEδ structure in crystal form I (colored magenta) and modeled structure of KRAS4b-GGMe–PDEδ (colored green) using KRAS4b-FMe–PDEδ structure in crystal form II. Positions of farnesyl and geranylgeranyl chains are highlighted. (C) Structural superposition of geranylgeranylated–methylated pentapeptide of PDE6α′ in complex with PDEδ (colored light blue; PDB ID code 5ETF) and modeled structure of KRAS4b-GGMe in complex with PDEδ (colored green). Positions of geranylgeranyl chains in these two structures are similar. PDE6α′-GGMe, geranylgeranylated–methylated PDE6α′. (D) Sequence alignment of amino acid sequence of the HVR of KRAS4b from various organisms shows the presence of a unique 5-aa-long sequence motif that allows the binding of prenylated KRAS4b to PDEδ as seen in this study. The HVR residues proposed to maintain similar protein–protein interaction in the KRAS4b-FMe–PDEδ and the KRAS4b-GGMe–PDEδ complexes are highlighted by magenta- and green-colored lines above the sequence alignment.
Fig. S5.
Fig. S5.
Structural comparison between KRAS4b–PDEδ and Rheb–PDEδ complexes. (A) Structural superposition of KRAS4b–PDEδ (crystal form I) and Rheb–PDEδ (PDB ID code 3T5I) aligned using PDEδ residues. KRAS4b–PDEδ and Rheb–PDEδ complexes are colored cyan and light orange, respectively. Two PDEδ residues, W90 and F133 (stick), undergo large conformational changes to facilitate the binding of farnesylated–methylated C185 deeper within the hydrophobic pocket of the KRAS4b–PDEδ complex (crystal form I). (B) Stereo view of superposition of KRAS4b–PDEδ (crystal form I) and Rheb–PDEδ complexes showing farnesylated–methylated cysteine, KRAS4b HVR, and PDEδ residues. The color-coding scheme is same as in A. (C) Structural superposition of KRAS4b–PDEδ (crystal form II) and Rheb–PDEδ (PDB ID code 3T5I) complexes aligned using PDEδ residues. KRAS4b–PDEδ and Rheb–PDEδ complexes are colored magenta and light orange, respectively. PDEδ residue W90 undergoes large conformation changes to facilitate binding of farnesylated–methylated C185 within the hydrophobic pocket in KRAS4b–PDEδ complex (crystal form II). (D) Stereo view of superposition of KRAS4b–PDEδ (crystal form II) and Rheb–PDEδ complexes showing farnesylated–methylated cysteine, KRAS4b HVR, and PDEδ residues. The color-coding scheme is same as in C. Rheb-FMe, farnesylated–methylated Rheb.
Fig. 7.
Fig. 7.
Structural and sequence analysis of prenylated proteins that have been tested previously for binding to PDEδ. (A) Structural superposition of PDEδ in complex with KRAS4b-FMe (crystal form I), farnesylated–methylated Rheb (Rheb-FMe; PDB ID code 3T5G), geranylgeranylated–methylated PDE6α′ (PDE6α′-GGMe; PDB ID code 5ETF), and farnesylated–methylated INPP5e (INPP5E-FMe; PDB ID code 5F2U). (B) Enlarged view of prenylated protein/peptide shown in A. The residues located upstream of prenylated C185 are numbered from −1 (K184) to −5 (K180). (C) Structure-based sequence alignment of prenylated protein/peptide shown in A and B. (D) Enlarged view of the binding pocket formed by PDEδ residues, where Thr183 in KRAS4b and corresponding Ser, Thr, and Ile residues in Rheb, PDE6α′, and INPP5E localize at protein–protein interface. (E) Sequence alignment of various proteins that have been tested previously for binding to PDEδ. Prenylated and palmitoylated Cys are highlighted in yellow and cyan, respectively. Prenylated proteins that contain either large polar amino acids at −1 and −2 positions or a second prenylated Cys site (shown in red) would cause steric clash with PDEδ residues and are unlikely to form a protein–protein complex.

References

    1. Prior IA, Lewis PD, Mattos C. A comprehensive survey of Ras mutations in cancer. Cancer Res. 2012;72(10):2457–2467. - PMC - PubMed
    1. Barbacid M. ras genes. Annu Rev Biochem. 1987;56:779–827. - PubMed
    1. Forbes SA, et al. COSMIC: Exploring the world’s knowledge of somatic mutations in human cancer. Nucleic Acids Res. 2015;43(Database issue):D805–D811. - PMC - PubMed
    1. Bourne HR, Sanders DA, McCormick F. The GTPase superfamily: Conserved structure and molecular mechanism. Nature. 1991;349(6305):117–127. - PubMed
    1. Wittinghofer A, Pai EF. The structure of Ras protein: A model for a universal molecular switch. Trends Biochem Sci. 1991;16(10):382–387. - PubMed

Publication types

MeSH terms