

Sedentary Behavior Is Independently Related to Fat Mass among Children and Adolescents in South China
- PMID: 27792134
- PMCID: PMC5133055
- DOI: 10.3390/nu8110667
Sedentary Behavior Is Independently Related to Fat Mass among Children and Adolescents in South China
Abstract
We aim to explore the independent associations of sedentary behaviors (SB) with body mass distribution among Chinese children. Data on the screen-based sedentary time (television viewing and computer use) and doing homework, physical activities and dietary intake of 1586 Chinese children (50.3% girls) aged 7-15 years were obtained through validated questionnaires. Skin-fold thickness, body height, and weight were measured to calculate percent body fat (%BF), fat mass index (FMI), and fat-free mass index (FFMI). Parental characteristics were collected by questionnaires. Among girls, time of SB (screen time or doing homework) was positively related to %BF, FMI, and FFMI (p < 0.03) after adjusting for maternal overweight, the average annual income of family, moderate-to-vigorous physical activity energy expenditure, and energy intake: Girls in the highest tertile of screen time/homework had 16.7%/23.3% higher relative FMI and 2.9%/2.9% higher relative FFMI than girls in the lowest tertile. Among boys, screen time was positively associated with FFMI (p < 0.003), but not related to %BF and FMI (p > 0.09), while time of doing homework was positively related to %BF and FMI (p = 0.03). Sedentary behaviors might be positively and independently related to fat mass among Chinese children, and were more pronounced in girls.
Keywords: body fat; energy intake; physical activity; sedentary time.
Conflict of interest statement
The authors declare no conflict of interest.
Figures

 ). Data shown are least-squares means (95% CI) adjusted for average annual income of family, maternal overweight, total energy intake (MJ/day) and MVPA energy expenditure (MJ/day)); * p for trend < 0.05. p for trend refers to p values obtained by linear regression models with total time spent on sedentary behaviors as continuous variables.
 ). Data shown are least-squares means (95% CI) adjusted for average annual income of family, maternal overweight, total energy intake (MJ/day) and MVPA energy expenditure (MJ/day)); * p for trend < 0.05. p for trend refers to p values obtained by linear regression models with total time spent on sedentary behaviors as continuous variables.
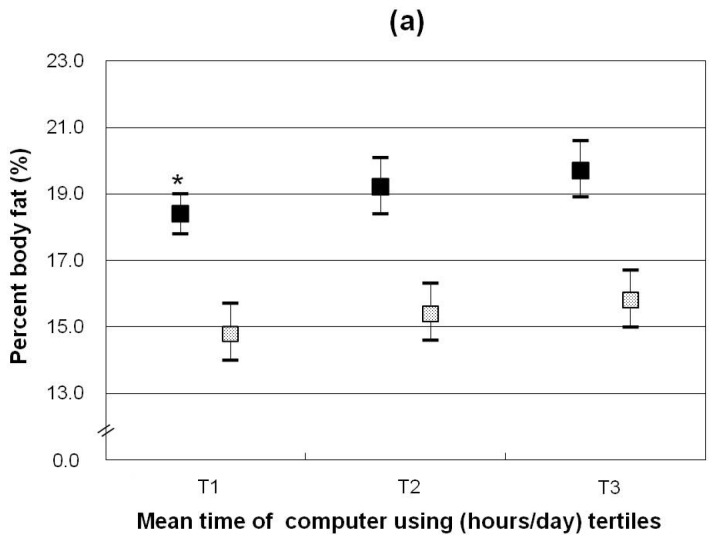 ); Data shown are least-squares means (95% CI) adjusted for average annual income of family, maternal overweight, total energy intake (MJ/day) and MVPA energy expenditure (MJ/day)); * p for trend < 0.05. p for trend refers to p values obtained by linear regression models with total time spent on sedentary behaviors as continuous variables.
 ); Data shown are least-squares means (95% CI) adjusted for average annual income of family, maternal overweight, total energy intake (MJ/day) and MVPA energy expenditure (MJ/day)); * p for trend < 0.05. p for trend refers to p values obtained by linear regression models with total time spent on sedentary behaviors as continuous variables.
 ). Data shown are least-squares means (95% CI) adjusted for average annual income of family, maternal overweight, total energy intake (MJ/day) and MVPA energy expenditure (MJ/day)). * p for trend <0.05. p for trend refers to p values obtained by linear regression models with total time spent on sedentary behaviors as continuous variables.
 ). Data shown are least-squares means (95% CI) adjusted for average annual income of family, maternal overweight, total energy intake (MJ/day) and MVPA energy expenditure (MJ/day)). * p for trend <0.05. p for trend refers to p values obtained by linear regression models with total time spent on sedentary behaviors as continuous variables.
 ). Data shown are least-squares means (95% CI) adjusted for average annual income of family, maternal overweight, total energy intake (MJ/day) and MVPA energy expenditure (MJ/day)). * p for trend <0.05. p for trend refers to p values obtained by linear regression models with total time spent on sedentary behaviors as continuous variables.
References
-
- Ji C.Y., Chen T.J., Working Group on Obesity in China Empirical changes in the prevalence of overweight and obesity among Chinese students from 1985 to 2010 and corresponding preventive strategies. Biomed. Environ. Sci. BES. 2013;26:1–12. - PubMed
MeSH terms
LinkOut - more resources
Full Text Sources
Other Literature Sources
Medical
Miscellaneous
