. 2016 Oct 26;5(4):41.
doi: 10.3390/biology5040041.

X-ray Diffraction Evidence for Low Force Actin-Attached and Rigor-Like Cross-Bridges in the Contractile Cycle

Affiliations

X-ray Diffraction Evidence for Low Force Actin-Attached and Rigor-Like Cross-Bridges in the Contractile Cycle

Felicity Eakins et al. Biology (Basel). .

Abstract

Defining the structural changes involved in the myosin cross-bridge cycle on actin in active muscle by X-ray diffraction will involve recording of the whole two dimensional (2D) X-ray diffraction pattern from active muscle in a time-resolved manner. Bony fish muscle is the most highly ordered vertebrate striated muscle to study. With partial sarcomere length (SL) control we show that changes in the fish muscle equatorial A-band (10) and (11) reflections, along with (10)/(11) intensity ratio and the tension, are much more rapid than without such control. Times to 50% change with SL control were 19.5 (±2.0) ms, 17.0 (±1.1) ms, 13.9 (±0.4) ms and 22.5 (±0.8) ms, respectively, compared to 25.0 (±3.4) ms, 20.5 (±2.6) ms, 15.4 (±0.6) ms and 33.8 (±0.6) ms without control. The (11) intensity and the (10)/(11) intensity ratio both still change ahead of tension, supporting the likelihood of the presence of a head population close to or on actin, but producing little or no force, in the early stages of the contractile cycle. Higher order equatorials (e.g., (30), (31), and (32)), more sensitive to crossbridge conformation and distribution, also change very rapidly and overshoot their tension plateau values by a factor of around two, well before the tension plateau has been reached, once again indicating an early low-force cross-bridge state in the contractile cycle. Modelling of these intensity changes suggests the presence of probably two different actin-attached myosin head structural states (mainly low-force attached and rigor-like). No more than two main attached structural states are necessary and sufficient to explain the observations. We find that 48% of the heads are off actin giving a resting diffraction pattern, 20% of heads are in the weak binding conformation and 32% of the heads are in the strong (rigor-like) state. The strong states account for 96% of the tension at the tetanus plateau.

Keywords: crossbridge time-course modelling; equatorial X-ray diffraction; myosin cross-bridge cycle; sarcomere length control; tetanus rising phase.


Conflict of interest statement

The authors declare no conflict of interest. The founding sponsors had no role in the design of the study; in the collection, analyses, or interpretation of data; in the writing of the manuscript, and in the decision to publish the results.

Figures

Figure 1
Figure 1
Diagram of the timing protocol used for time-resolved X-ray diffraction experiments. Black trace: a diagrammatic representation of the tetanic tension record produced by an isometrically contracting muscle showing the exposure times for the X-ray diffraction patterns taken throughout the contraction (red dashed lines). The numbers 1 to 5 indicate points where an action occurs as in the top right hand corner of the figure. X-ray data and ionisation chamber readings were recorded throughout. The other muscle parameters such as the muscle tension, change in length and sarcomere length (SL) were only recorded between 2 and 5.
Figure 2
Figure 2
Possible models for the crossbridge cycle including 4 or fewer structural states and the transitions between them. For convenience the states have been given names. (a) A general model for the crossbridge cycle including four possible states and transitions between them. However, they can be considered in different ways as in (b); (b) Various kinds of model (A to G) have been considered as described in the text. These include two 2-state models (A, B), two 3-state models (C, D) and three 4-state models (E, F, G).
Figure 3
Figure 3
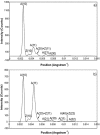
Equatorial profiles from the 100 ms relaxed and active frames of the summed time series with SL control. Both profiles were vertically integrated from 0.00125 Å−1 on either side of the equator. Data from 780 contractions were summed to produce the two profiles giving a total exposure time of 78 s. The background scatter was removed from the profiles to leave just the Bragg peaks by fitting a polynomial plus exponential function to it. (A: A-band peaks; Z: Z-band peaks). (a) Equatorial profile from the 100 ms relaxed frame. Six equatorial peaks are visible in the relaxed profile; (b) Equatorial profile from the 100 ms active frame. Nine equatorial peaks are visible in the active profile.
Figure 4
Figure 4
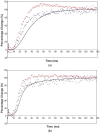
Average time-courses of the A(10) and A(11) intensities and tension during the 150 ms rising phase of isometric tetanic contraction in Plaice fin muscle without and without SL control. The inverted A(10) time-course, actually a drop in intensity, is shown in blue, the A(11) increase in red and the tension increase in black. Time-courses have been normalised with respect to their average values over 100 ms in the relaxed state (0%) and 100 ms at the plateau of contraction (100%) to show the percentage of maximum change. Activation occurs at the position of the black arrow. (a) Time-courses of the A(10) and A(11) intensities and tension without SL control; (b) Time-courses of the A(10) and A(11) intensities and tension with partial SL control.
Figure 5
Figure 5
Plots of the A(10) to A(11) intensity ratio (intensity of (10)/intensity of (11), written as I(10)/I(11)) and tension during the rising phase of tetanic contraction in Plaice fin muscle for both datasets under the two different SL conditions (without control in blue, with partial SL control in red, tension solid lines, intensity ratio discrete points). For comparison the time-courses have been normalised (as in Figure 8) with respect to their average values over 100 ms in the relaxed state (0%) and 100 ms at the plateau of contraction (100%) to show the percentage of maximum change. There is a very clear lead of intensity changes ahead of tension.
Figure 6
Figure 6
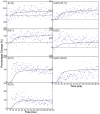
Intensity time-courses of the equatorial reflections, other than the A(10) and A(11), visible in the time series with partial SL control. The time-course of each reflection is shown on a separate plot in blue, as labelled, with the tension as a continuous line in grey. For comparison, the time-courses have been normalised with respect to their average values over 100 ms in the relaxed state (0%) and 100 ms at the plateau of contraction (100%) to show percentage of maximum change as in Figure 4 and Figure 5.
Figure 7
Figure 7
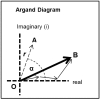
Diagram illustrating the addition of vectors in an Argand diagram. Here any vector such as OA has an amplitude (the arrow length) and a phase (α). In the muscle case for each equatorial reflection each crossbridge state will contribute a vector (the smaller arrows) which will add vectorially to give the resultant OB. If the structure is centrosymmetric then the arrows will all point along the horizontal (real) axis (their phase is 0° or 180°) and they just need to be added or subtracted.
Figure 8
Figure 8
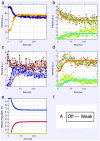
Plots from simulated annealing fits of the 2-state model (A in Figure 2b) to the observed equatorial time-courses in Figure 4 and Figure 6, with SL control applied. The fit is reasonable (Chi = 1457), but there are clearly no overshoots in any of the time-courses. (a) Plot of the A(10) data, in black, and the fit, in blue; the A(11) data, in red, and the fit, in yellow; (b) Plot of the A(20), in red, and the fit, in orange; the A(40) data, in green, and the fit, in turquoise; (c) Plot of the A(21) data, in black, and the fit, in pale blue; the A(31) data, in bright blue, and the fit, in purple; (d) Plot of the A(30) data, in red, and the fit, in orange; the A(32) data, in green, and the fit, in turquoise; (e) Plot of the populations in the two states: off is blue, weak is red. The populations at the active plateau are 67% off and 33% weak (Table 4); (f) The two states in model A: off and weak.
Figure 9
Figure 9
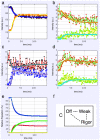
Plots from simulated annealing fits of the 3-state model (C in Figure 2b) to the observed equatorial time-courses in Figure 4 and Figure 6, with SL control applied and the rigor 20 allowed to be freely fitted. The fit is good (Chi = 1240 (Table 4)), and this time there is very clear evidence of the overshoots being modelled. (a) Plot of the A(10) data, in black, and the fit, in blue; the A(11) data, in red, and the fit, in yellow; (b) Plot of the A(20) data, in red, and the fit, in orange; the A(40) data, in green, and the fit, in turquoise; (c) Plot of the A(21) data, in black, and the fit, in pale blue; the A(31) data, in bright blue, and the fit, in purple; (d) Plot of the A(30) data, in red, and the fit, in orange; the A(32) data, in green, and the fit, in turquoise; (e) Plot of the populations in the three states: off is blue, weak is red and rigor-like is green. The populations at the active plateau are 48% off, 20% weak and 32% rigor-like (Table 4); (f) The three states in model C: off, weak and rigor-like.
Figure 10
Figure 10
Plots of the best modelled X-ray amplitudes, tension and state populations for the 3-state model (C in Figure 2b) shown in Figure 9. (a) Modelled X-ray amplitudes for the off state, in red, and the weak state, in blue; (b) Modelled X-ray amplitudes for the weak state, in red and the rigor-like state, in blue; (c) Plot of the tension calculation for the 3-state model including rigor in which a percentage f is in the strong state and a percentage (100 − f) is in the weak state. The experimentally measured tension is shown in black, the fitted tension in orange and the noramlised populations in the weak and rigor-like states in red and green respectively. The fitting gives most heads in the rigor state (f = 96%).
Figure 11
Figure 11
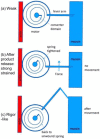
Schematic diagram to show how a crossbridge might behave if the crossbridge compliance is within the motor/converter domains. The compliant element is visualised as a spiral spring which is unstrained in (a); which might correspond to initial, weak, attachment as AM.ADP.Pi. With the release of products Pi and ADP the effect is to tighten the spiral spring (b); but if the filaments unable to move, the lever arm would stay in the same position as (a); but would be strained. Only if the filaments can move would the lever arm rotate, thus relieving the strain in the spring (c).
Figure 12
Figure 12
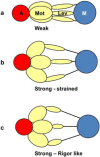
The equivalent schematic transitions to Figure 11, but this time as viewed down the fibre axis, i.e., as it would appear on the equator. The weak binding state AM.ADP.Pi would presumably have the motor domains in a loose (non-stereospecific) attachment to actin (a); so the heads would point back to their origins on myosin. The release of products would require the motor domains to become stereospecifically bound to actin, so they would follow the actin helix and become more spread azimuthally (b); The heads would still be axially strained as in Figure 11b. Relative filament sliding as in Figure 11c would relieve the strain by allowing the lever arms to tilt (c) and the strain would gradually reduce to zero. On the equator, configurations (b,c) would probably appear rather similar because of the relatively low mass of the lever arm. In other words, the modelled rigor-like state would include both (b,c).

Similar articles

Cited by

References

    1. Wulf S.F., Ropars V., Fujita-Becker S., Oster M., Hofhaus G., Trabuco L.G., Pylypenko O., Sweeney H.L., Houdusse A.M., Schröder R.R. Force-producing ADP state of myosin bound to actin. Proc. Natl. Acad. Sci. USA. 2016;113:E1844–E1852. doi: 10.1073/pnas.1516598113. - DOI - PMC - PubMed
    1. Squire J.M., Al-Khayat H.A., Knupp C., Luther P.K. Molecular architecture in muscle contractile assemblies. Adv. Protein Chem. 2005;71:17–87. - PubMed
    1. Lymn R.W., Taylor E.W. Mechanism of adenosine triphosphate hydrolysis by actomyosin. Biochemistry. 1971;10:4617–4624. doi: 10.1021/bi00801a004. - DOI - PubMed
    1. Rayment I., Holden H.M., Whittaker M., Yohn C.B., Lorenz M., Holmes K.C., Milligan R.A. Structure of the actin-myosin complex and its implications for muscle contraction. Science. 1993;261:58–65. doi: 10.1126/science.8316858. - DOI - PubMed
    1. Rayment I., Rypniewski W.R., Schmidt-Base K., Smith R., Tomchick D.R., Benning M.M., Winkelmann D.A., Wesenberg G., Holden H.M. Three-dimensional structure of myosin subfragment-1: A molecular motor. Science. 1993;261:50–58. doi: 10.1126/science.8316857. - DOI - PubMed

LinkOut - more resources