

lncRNA NBR2 modulates cancer cell sensitivity to phenformin through GLUT1
- PMID: 27792451
- PMCID: PMC5224451
- DOI: 10.1080/15384101.2016.1249545
lncRNA NBR2 modulates cancer cell sensitivity to phenformin through GLUT1
Abstract
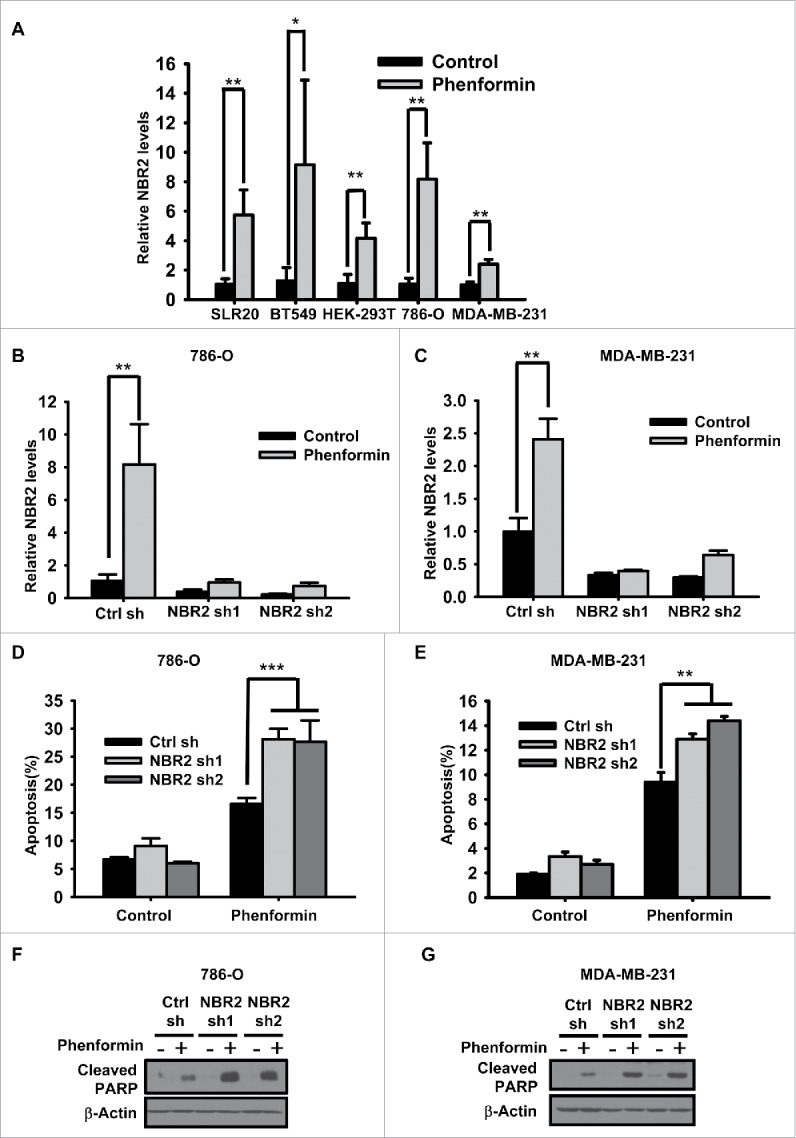
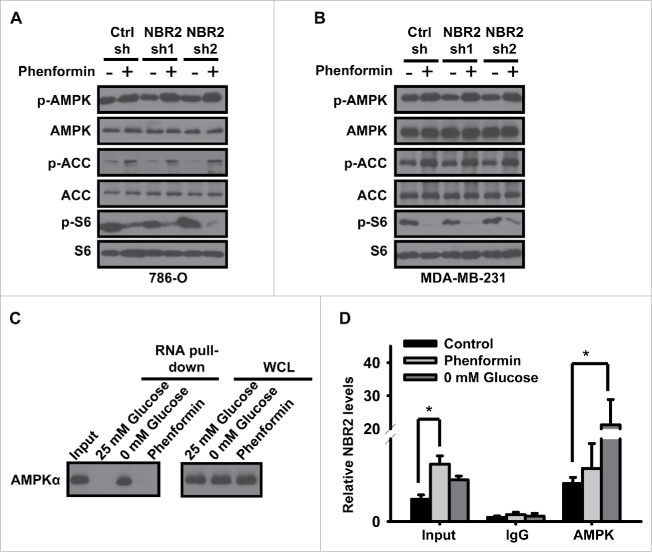
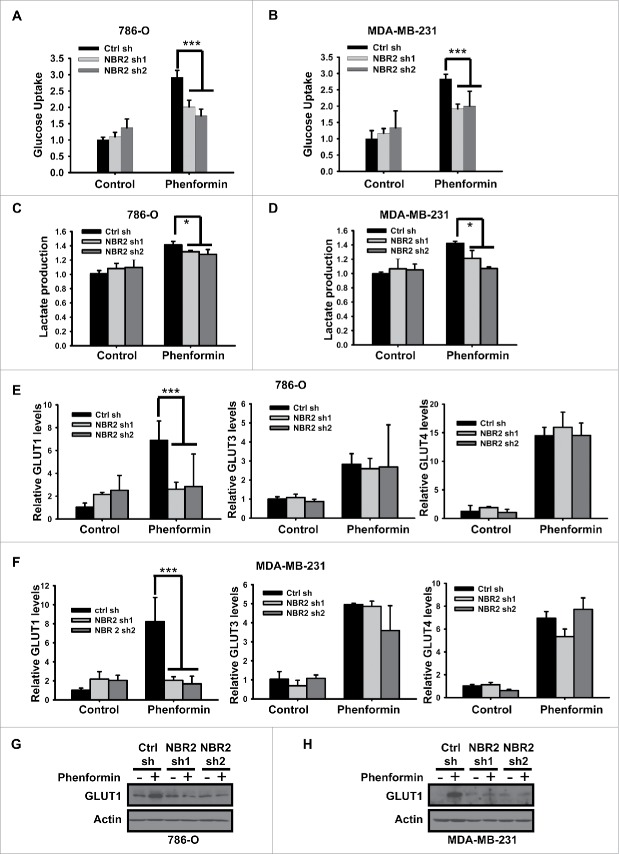
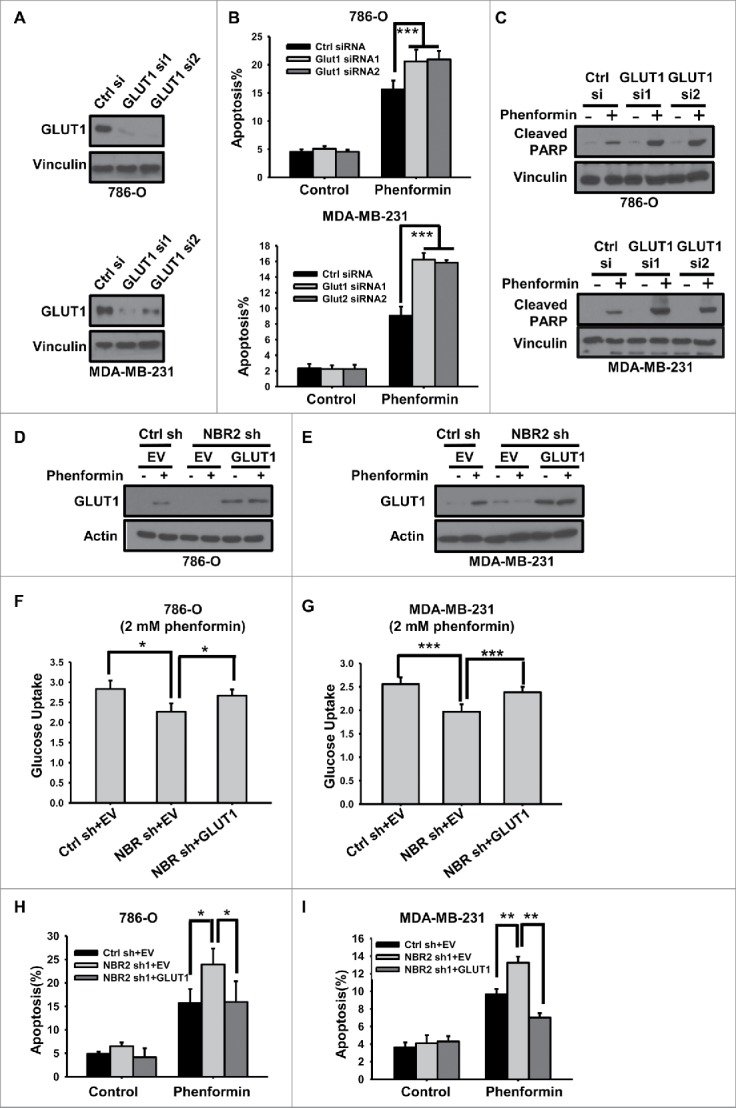
Biguanides, including metformin (widely used in diabetes treatment) and phenformin, are AMP-activated protein kinase (AMPK) activators and potential drugs for cancer treatment. A more in-depth understanding of how cancer cells adapt to biguanide treatment may provide important therapeutic implications to achieve more effective and rational cancer therapies. NBR2 is a glucose starvation-induced long non-coding RNA (lncRNA) that interacts with AMPK and regulates AMPK activity upon glucose starvation. Here we show that phenformin treatment induces NBR2 expression, and NBR2 deficiency sensitizes cancer cells to phenformin-induced cell death. Surprisingly, unlike glucose starvation, phenformin does not induce NBR2 interaction with AMPK, and correspondingly, NBR2 deficiency does not affect phenformin-induced AMPK activation. We further reveal that NBR2 depletion attenuates phenformin-induced glucose transporter GLUT1 expression and glucose uptake. GLUT1 deficiency sensitizes cancer cells to phenformin-induced cell death, whereas GLUT1 restoration in NBR2 deficient cells rescues the increased cell death upon phenformin treatment. Together, the results of our study reveal that NBR2-GLUT1 axis may serve as an adaptive response in cancer cells to survive in response to phenformin treatment, and identify a novel mechanism coupling lncRNA to biguanide-mediated biology.
Keywords: AMPK; GLUT1; NBR2; biguanide; long non-coding RNA; phenformin.
Figures

Comment in
-
NBR2-GLUT1 axis regulates cancer cell sensitivity to biguanides.Cell Cycle. 2017 Feb;16(3):249-250. doi: 10.1080/15384101.2016.1263498. Epub 2016 Dec 8. Cell Cycle. 2017. PMID: 27929708 Free PMC article. No abstract available.
Similar articles
-
NBR2-GLUT1 axis regulates cancer cell sensitivity to biguanides.Cell Cycle. 2017 Feb;16(3):249-250. doi: 10.1080/15384101.2016.1263498. Epub 2016 Dec 8. Cell Cycle. 2017. PMID: 27929708 Free PMC article. No abstract available.
-
Curcumin Regulates the Progression of Colorectal Cancer via LncRNA NBR2/AMPK Pathway.Technol Cancer Res Treat. 2019 Jan-Dec;18:1533033819870781. doi: 10.1177/1533033819870781. Technol Cancer Res Treat. 2019. PMID: 31888414 Free PMC article.
-
Long non-coding RNA NBR2 suppresses the progression of colorectal cancer by downregulating miR-19a to regulate M2 macrophage polarization.Chin J Physiol. 2023 Nov-Dec;66(6):546-557. doi: 10.4103/cjop.CJOP-D-23-00064. Chin J Physiol. 2023. PMID: 38149567
-
AMPK Regulation of Cell Growth, Apoptosis, Autophagy, and Bioenergetics.Exp Suppl. 2016;107:45-71. doi: 10.1007/978-3-319-43589-3_3. Exp Suppl. 2016. PMID: 27812976 Review.
-
Phenformin as an Anticancer Agent: Challenges and Prospects.Int J Mol Sci. 2019 Jul 5;20(13):3316. doi: 10.3390/ijms20133316. Int J Mol Sci. 2019. PMID: 31284513 Free PMC article. Review.
Cited by
-
The Triangle Relationship Between Long Noncoding RNA, RIG-I-like Receptor Signaling Pathway, and Glycolysis.Front Microbiol. 2021 Nov 30;12:807737. doi: 10.3389/fmicb.2021.807737. eCollection 2021. Front Microbiol. 2021. PMID: 34917069 Free PMC article. Review.
-
NBR2-GLUT1 axis regulates cancer cell sensitivity to biguanides.Cell Cycle. 2017 Feb;16(3):249-250. doi: 10.1080/15384101.2016.1263498. Epub 2016 Dec 8. Cell Cycle. 2017. PMID: 27929708 Free PMC article. No abstract available.
-
Identification and Roles of miR-29b-1-3p and miR29a-3p-Regulated and Non-Regulated lncRNAs in Endocrine-Sensitive and Resistant Breast Cancer Cells.Cancers (Basel). 2021 Jul 14;13(14):3530. doi: 10.3390/cancers13143530. Cancers (Basel). 2021. PMID: 34298743 Free PMC article.
-
Long Noncoding RNA LINC00551 Suppresses Glycolysis and Tumor Progression by Regulating c-Myc-Mediated PKM2 Expression in Lung Adenocarcinoma.Onco Targets Ther. 2020 Nov 9;13:11459-11470. doi: 10.2147/OTT.S273797. eCollection 2020. Onco Targets Ther. 2020. PMID: 33204101 Free PMC article.
-
BRCA1-Mediated Dual Regulation of Ferroptosis Exposes a Vulnerability to GPX4 and PARP Co-Inhibition in BRCA1-Deficient Cancers.Cancer Discov. 2024 Aug 2;14(8):1476-1495. doi: 10.1158/2159-8290.CD-23-1220. Cancer Discov. 2024. PMID: 38552003 Free PMC article.
References
-
- Pernicova I, Korbonits M. Metformin–mode of action and clinical implications for diabetes and cancer. Nat Rev Endocrinol 2014; 10:143-56; PMID:24393785; http://dx.doi.org/10.1038/nrendo.2013.256 - DOI - PubMed
-
- Foretz M, Guigas B, Bertrand L, Pollak M, Viollet B. Metformin: from mechanisms of action to therapies. Cell Metab 2014; 20:953-66; PMID:25456737; http://dx.doi.org/10.1016/j.cmet.2014.09.018 - DOI - PubMed
-
- Pollak M. Potential applications for biguanides in oncology. J Clin Invest 2013; 123:3693-700; PMID:23999444; http://dx.doi.org/10.1172/JCI67232 - DOI - PMC - PubMed
-
- Menendez JA, Oliveras-Ferraros C, Cufi S, Corominas-Faja B, Joven J, Martin-Castillo B, Vazquez-Martin A. Metformin is synthetically lethal with glucose withdrawal in cancer cells. Cell Cycle 2012; 11:2782-92; PMID:22809961; http://dx.doi.org/10.4161/cc.20948 - DOI - PubMed
-
- Picone P, Vilasi S, Librizzi F, Contardi M, Nuzzo D, Caruana L, Baldassano S, Amato A, Mule F, San Biagio PL, et al.. Biological and biophysics aspects of metformin-induced effects: cortex mitochondrial dysfunction and promotion of toxic amyloid pre-fibrillar aggregates. Aging 2016; 8:1718-34; PMID:27509335 - PMC - PubMed
MeSH terms
Substances
Grants and funding
LinkOut - more resources
Full Text Sources
Other Literature Sources
Miscellaneous