. 2016 Oct 28;12(10):e1005975.
doi: 10.1371/journal.ppat.1005975. eCollection 2016 Oct.

STING-Licensed Macrophages Prime Type I IFN Production by Plasmacytoid Dendritic Cells in the Bone Marrow during Severe Plasmodium yoelii Malaria

Affiliations

STING-Licensed Macrophages Prime Type I IFN Production by Plasmacytoid Dendritic Cells in the Bone Marrow during Severe Plasmodium yoelii Malaria

Emily Spaulding et al. PLoS Pathog. .

Abstract

Malaria remains a global health burden causing significant morbidity, yet the mechanisms underlying disease outcomes and protection are poorly understood. Herein, we analyzed the peripheral blood of a unique cohort of Malawian children with severe malaria, and performed a comprehensive overview of blood leukocytes and inflammatory mediators present in these patients. We reveal robust immune cell activation, notably of CD14+ inflammatory monocytes, NK cells and plasmacytoid dendritic cells (pDCs) that is associated with very high inflammation. Using the Plasmodium yoelii 17X YM surrogate mouse model of lethal malaria, we report a comparable pattern of immune cell activation and inflammation and found that type I IFN represents a key checkpoint for disease outcomes. Compared to wild type mice, mice lacking the type I interferon (IFN) receptor exhibited a significant decrease in immune cell activation and inflammatory response, ultimately surviving the infection. We demonstrate that pDCs were the major producers of systemic type I IFN in the bone marrow and the blood of infected mice, via TLR7/MyD88-mediated recognition of Plasmodium parasites. This robust type I IFN production required priming of pDCs by CD169+ macrophages undergoing activation upon STING-mediated sensing of parasites in the bone marrow. pDCs and macrophages displayed prolonged interactions in this compartment in infected mice as visualized by intravital microscopy. Altogether our findings describe a novel mechanism of pDC activation in vivo and precise stepwise cell/cell interactions taking place during severe malaria that contribute to immune cell activation and inflammation, and subsequent disease outcomes.


Conflict of interest statement

The authors have declared that no competing interests exist.

Figures

Fig 1
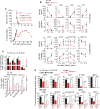
Fig 1. High inflammation and immune cell activation in the blood of severe malaria patients and in a surrogate mouse model.
(A) Serum cytokine and chemokine levels in patients. Each point represents an individual patient, enrollment (blue), follow-up (black). (B) WT B6 mice were inoculated i.v. with 2x10⁵ Py 17X YM iRBCs. Kinetics of cytokine and chemokine levels in the blood (n = 3–15 mice/time point). (C-E) Frozen isolated human PBMCs from patients were thawed and stained with mAbs against cell-surface lineage markers for CD14+ monocytes (C), dendritic cells (myeloid or plasmacytoid) (D), or NK cells (E) including a viability stain, as well as indicated activation markers. Gating strategies and respective frequencies are shown. Scattered plots show the relative expression level (MFI) or percent of cell population expressing indicated marker for each individual patient at enrollment versus follow-up. (F) The proportion of blood Ly6C+ monocyte and NK cells expressing various surface markers in Py-infected WT mice at 1.5 and 4.5 days post infection (n = 3 = 14 mice/condition). Experiments were replicated 2–3 times. P-values are indicated when applicable.
Fig 2
Fig 2. Type I interferon enhances immune blood leukocyte activation and lethal outcomes in severe murine malaria.
WT or Ifnar1 -/- B6 mice were inoculated i.v. with 2x10⁵ Py 17X YM iRBCs. (A) Survival and blood parasitemia of Py-infected mice over indicated times. (B) Serum and spleen cytokine and chemokine levels/contents 1.5 or 4.5 days post Py-infection (n = 3–8 mice). (C) 1.5 days after Py infection, blood cells were stained for the cell-surface lineage markers CD11b, CD3, CD19, Ly6C, Ly6G, NKp46, BST2, SiglecH and CD45. Frequencies of indicated cell subsets among all blood leukocytes (CD45+) in Py-infected WT compared to Ifnar1 -/- mice (upper bar graph, n = 6–10 mice) and either Py-infected or uninfected WT CD45.1+/Ifnar1 -/- (ratio 50:50) mixed bone marrow chimeras (lower bar graph, n = 7 mice) are shown. (D) The proportion of blood Ly6C+ monocyte and NK cells expressing various surface markers in Py-infected WT and Ifnar1 -/- mice (n = 6–10 mice) or WT CD45.1+/Ifnar1 -/- mixed chimeras (n = 7 mice) are reported. Experiments were replicated 2–3 times. P-values are indicated when applicable.
Fig 3
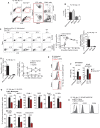
Fig 3. Plasmacytoid dendritic cells produce immune-activating type I IFN in the bone marrow and the blood of Py-infected mice.
(A) WT Ifnb-Yfp +/+ reporter mice (n>5) were inoculated i.v. with 2x10⁵ Py 17X YM iRBCs and blood and bone marrow cells were stained with the lineage markers CD11b, CD3, CD19, NK1.1, Ly6C, BST2 and Siglec-H. The phenotype of YFP+ cells is shown. (B) Frequencies of YFP+ pDCs (CD11bloBST2+SiglecH+) in bone marrow, blood, spleen, and liver of Py-infected WT Ifnb-Yfp +/+ reporter mice (1.5 day, n = 3–10 mice). (C) Kinetics of YFP expression by pDCs in the bone marrow and blood of Py-infected WT Ifnb-Yfp +/+ reporter mice and absolute numbers of YFP+ pDCs in the indicated compartments (n = 3–11 mice/time point). (D) The bar graph shows the absolute number of pDCs in the bone marrow, blood, and spleen 1.5 days post infection (n = 7 mice). Kinetics of total pDC frequency among CD45+ cells in the bone marrow, blood, and spleen during the first 48 hours of Py-infection (n = 5–7 mice/time point). (E) Activation profiles (CD86, BST2, ICAM-1) of pDCs in the bone marrow of Py-infected (YFP+, YFPneg) or uninfected (YFPneg) Ifnb-Yfp +/+ reporter mice (n>5 mice/condition). (F, G) DT-treated Bdca2-Dtr +/- or control WT B6 mice were inoculated with 2x10⁵ Py 17X YM iRBCs and 1.5 days later, levels of IFNα in the blood and bone-marrow (F, n = 7–13 mice), and activation profiles of Ly6C+ monocytes and NK cells using indicated markers were measured (G, n = 3–7 mice). (H) FACS histogram overlays of indicated chemokine receptor expression on pDCs from Py-infected versus naïve mice (n = 3 mice/condition). Experiments were replicated 2–4 times. P-values are indicated when applicable.
Fig 4
Fig 4. Production of systemic type I IFN during severe murine blood stage malaria requires both MyD88 and STING sensing pathways.
WT, Myd88 -/- or Sting Gt/Gt B6 mice crossed to Ifnb-Yfp +/+ reporter mice were inoculated i.v. with 2x10⁵ Py 17X YM iRBCs. 1.5 days later, levels of IFNα (A, n = 4–10 mice/genotype) and frequencies of YFP+ cells among pDCs, as well as absolute numbers (B), in the blood and bone marrow were determined (n = 3–15 mice/genotype). (C) Blood cells were stained for the cell-surface lineage markers CD11b, Ly6C, NKp46, BST2, Siglec-H, CD45, and indicated activation markers. Expression of activation markers on Ly6C+ monocytes, NK cells and pDCs in the blood of Py-infected compared to uninfected mice is shown (n = 3–8 mice/genotype). Experiments were replicated 2–3 times. P-values are indicated when applicable.
Fig 5
Fig 5. Plasmacytoid dendritic cells produce immune-activating type I IFN via TLR7/MyD88 but not STING.
(A) Frequencies of WT (CD45.1+) or KO (Myd88 -/-, Tlr7 -/-, Sting Gt/Gt) YFP+ pDCs in the bone marrow of Py-infected WT/KO Ifnb-Yfp +/+ mixed chimeras (n = 4–6 mice/chimera). Bar graphs average all individual mice across 2 replicate experiments. (B) Frequency of YFP+ pDCs in the bone marrow of WT and Tlr7 -/- Ifnb-Yfp +/+ reporter mice 1.5 day post Py infection (n = 4 mice/genotype). Bar graphs summarize the frequencies of YFP+ pDCs in the blood and bone marrow. (C) IFNα levels in the blood and the bone marrow of Py-infected Tlr7 -/-, Tlr9 -/-, WT mice or uninfected mice (n = 4–8 mice/genotype). (D) Bdca2-Dtr +/-/Tlr7 -/-, Bdca2-Dtr +/-/Tlr9 -/-, Bdca2-Dtr +/-/Sting Gt/Gt or control WT/KO (ratios 50:50 or 30:70, see S5 Fig) mixed bone marrow chimeras (n = 3–5 mice/chimera) were treated with DT prior Py infection, and activation profiles of blood Ly6C+ monocytes and NK cells in the blood using indicated markers were measured. Experiments were replicated 2–4 times. P-values are indicated when applicable.
Fig 6
Fig 6. CD169+ macrophages control early pDC activation in the bone marrow of infected mice.
(A) DT-treated WT and Cd169-Dtr +/- Ifnb-Yfp +/+reporter mice (n = 7–14 mice/genotype) were inoculated i.v. with 2x10⁵ Py 17X YM iRBCs and blood and bone marrow cells were stained with the lineage markers CD11b, BST2 and Siglec-H and frequencies of YFP+ pDCs is shown. In (B), levels of IFNα in the blood and bone marrow of these mice were quantified and (C) shows the activation profiles of Ly6C+ monocytes, NK cells and pDCs using indicated markers (n = 3–7 mice/condition). (D) WT or Cd169-Dtr +/- recipient mice (n = 7 mice/chimera) reconstituted with bone-marrow cells from WT Ifnb-Yfp +/+ mice were DT-treated and frequencies of YFP+ pDCs in the bone marrow was determined 1.5 days post Py infection. (E) Frequencies of YFP+ pDCs in the bone marrow of indicated Py-infected WT or Sting Gt/Gt reciprocal chimeras n = 4 mice/chimera). Experiments were replicated 2–4 times. P-values are indicated when applicable.
Fig 7
Fig 7. CD169+ macrophages form stable long-lasting interactions with pDCs in the bone marrow of P. yoelii-infected mice.
(A) Tracking time in which individual pDCs were either moving or arrested in the bone marrow among total time monitored using intravital microscopy in Py-infected or uninfected live Ptcra-Gfp +/+ mice (n = 5 mice/condition). Bar graph summarizes the tracking time (30″/frame) recorded per individual pDC during intravital microscopy of the bone marrow. Each open symbol on the bar graph corresponds to individual pDCs. (B) Bar graph summarizes the percentage of time in which individual pDCs were moving among total time monitored by intravital microscopy of the bone marrow. (C) Total contact time of pDCs arrested over observation time. (D) Frame of an intravital microscopy movie showing pDCs (green, highlighted with yellow arrows) interacting with CD169+ macrophages (red). (E) Frequency of F4/80hiCD169+ macrophages detected in the bone-marrow at various times post Py infection (n = 5 mice). P-values are indicated when applicable.
Fig 8
Fig 8. Mechanistic model summarizing findings.

References

    1. White NJ, Pukrittayakamee S, Hien TT, Faiz MA, Mokuolu OA, Dondorp AM. Malaria. Lancet. 2014;383(9918):723–35. 10.1016/S0140-6736(13)60024-0 - DOI - PubMed
    1. Crompton PD, Moebius J, Portugal S, Waisberg M, Hart G, Garver LS, et al. Malaria immunity in man and mosquito: insights into unsolved mysteries of a deadly infectious disease. Annu Rev Immunol. 2014;32:157–87. PubMed Central PMCID: PMC4075043. 10.1146/annurev-immunol-032713-120220 - DOI - PMC - PubMed
    1. Manning L, Laman M, Davis WA, Davis TM. Clinical features and outcome in children with severe Plasmodium falciparum malaria: a meta-analysis. PLoS One. 2014;9(2):e86737 10.1371/journal.pone.0086737 - DOI - PMC - PubMed
    1. Miller LH, Ackerman HC, Su XZ, Wellems TE. Malaria biology and disease pathogenesis: insights for new treatments. Nat Med. 2013;19(2):156–67. 10.1038/nm.3073 - DOI - PMC - PubMed
    1. Rts SCTP, Agnandji ST, Lell B, Fernandes JF, Abossolo BP, Methogo BG, et al. A phase 3 trial of RTS,S/AS01 malaria vaccine in African infants. N Engl J Med. 2012;367(24):2284–95. 10.1056/NEJMoa1208394 - DOI - PMC - PubMed