. 2016 Nov 15;7(46):74435-74447.
doi: 10.18632/oncotarget.12908.

Absence of ERK5/MAPK7 delays tumorigenesis in Atm-/- mice

Affiliations

Absence of ERK5/MAPK7 delays tumorigenesis in Atm-/- mice

Alba Granados-Jaén et al. Oncotarget. .

Abstract

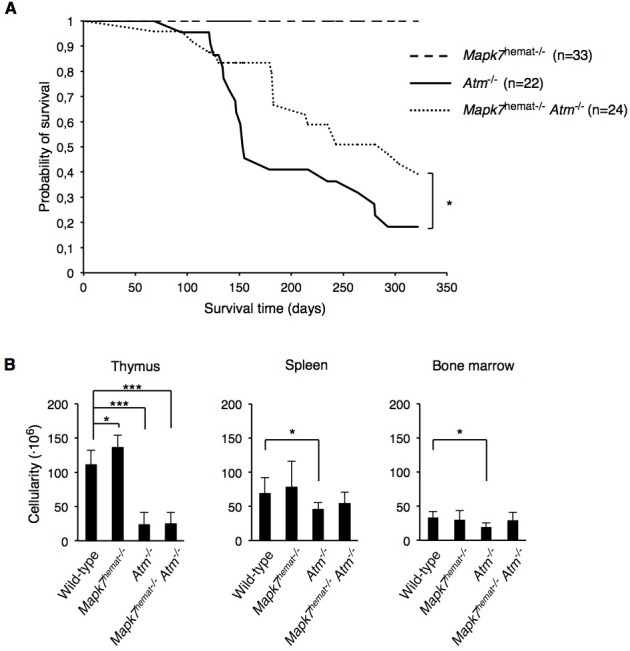
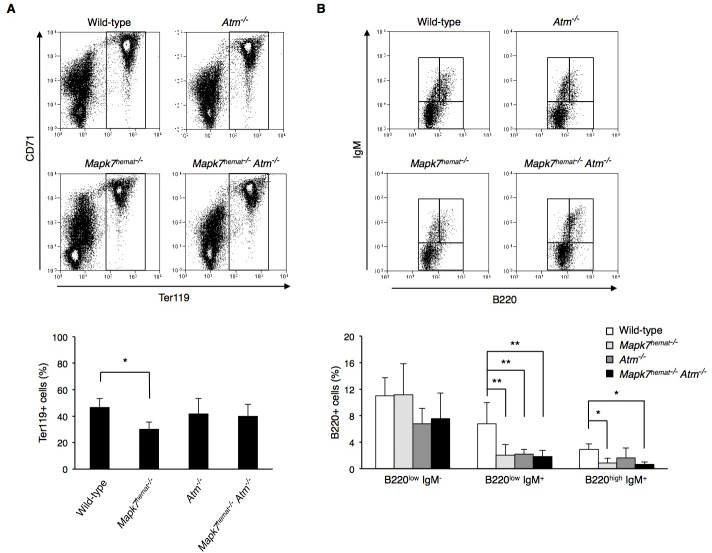
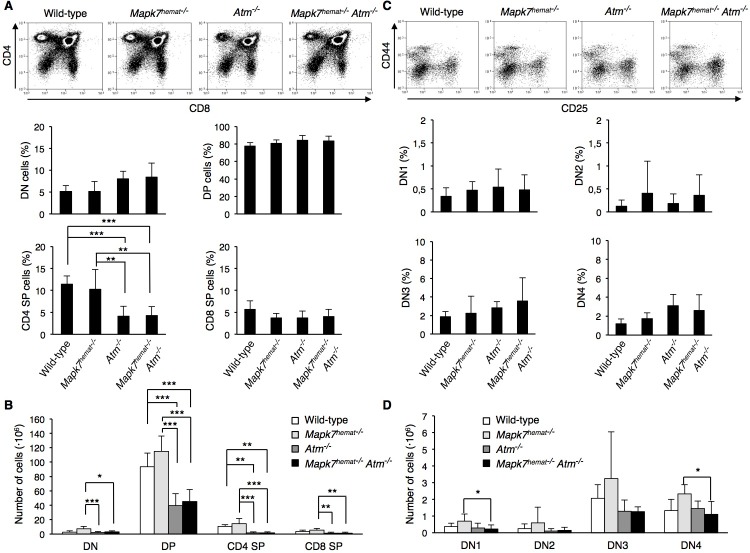
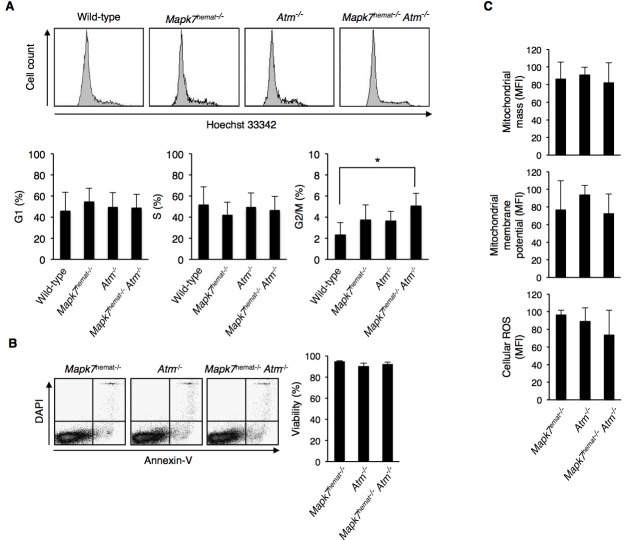
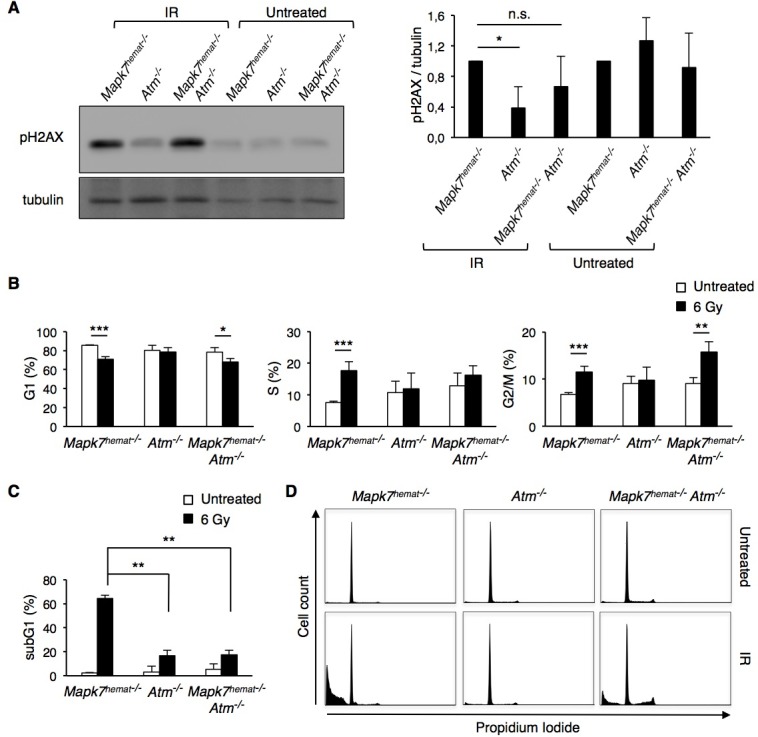
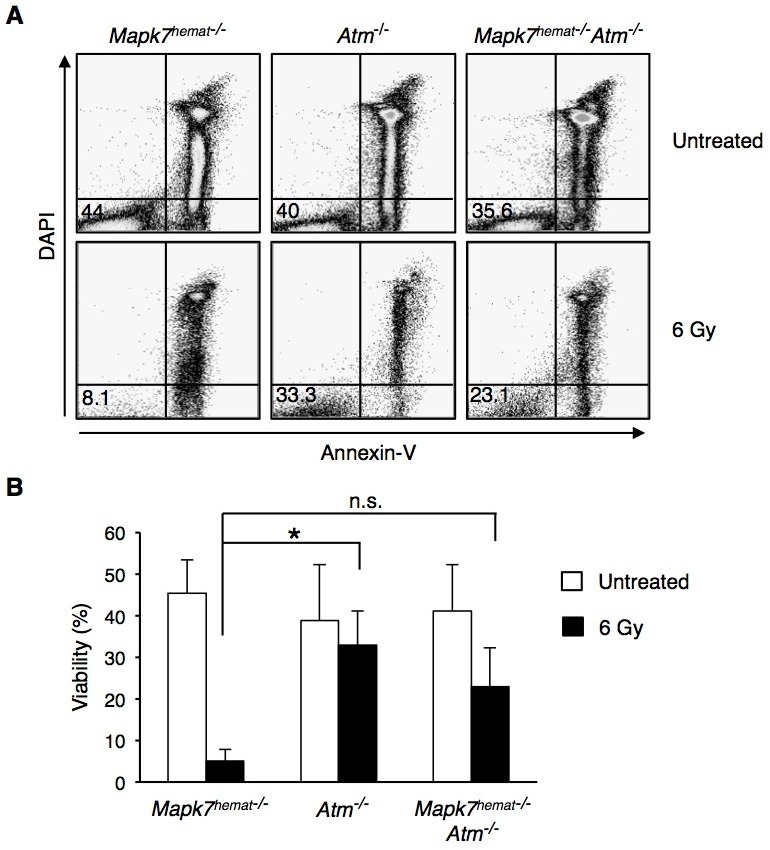
Ataxia-telangiectasia mutated (ATM) is a cell cycle checkpoint kinase that upon activation by DNA damage leads to cell cycle arrest and DNA repair or apoptosis. The absence of Atm or the occurrence of loss-of-function mutations in Atm predisposes to tumorigenesis. MAPK7 has been implicated in numerous types of cancer with pro-survival and pro-growth roles in tumor cells, but its functional relation with tumor suppressors is not clear. In this study, we show that absence of MAPK7 delays death due to spontaneous tumor development in Atm-/- mice. Compared with Atm-/- thymocytes, Mapk7-/-Atm-/- thymocytes exhibited an improved response to DNA damage (increased phosphorylation of H2AX) and a restored apoptotic response after treatment of mice with ionizing radiation. These findings define an antagonistic function of ATM and MAPK7 in the thymocyte response to DNA damage, and suggest that the lack of MAPK7 inhibits thymic lymphoma growth in Atm-/- mice by partially restoring the DNA damage response in thymocytes.

Keywords: BMK1; DNA damage response; thymic lymphoma; thymocyte; γH2AX.


Conflict of interest statement

CONFLICTS OF INTEREST

No potential conflicts of interest were disclosed.

Figures

Figure 1
Figure 1. Absence of MAPK7 delays tumorigenesis in Atm−/− mice
A. Kaplan-Meier survival curves of Mapk7hemat−/− (n = 33), Atm−/− (n = 22) and Mapk7hemat−/−Atm−/− (n = 24) mice over 320 days. P values were obtained by the log-rank test. B. Total cellularity of wild-type (n ≥ 5), Mapk7hemat−/− (n = 7), Atm−/− (n = 7) and Mapk7hemat−/−Atm−/− (n ≥ 8), in the indicated organs.
Figure 2
Figure 2. Normal erythropoiesis in Mapk7hemat−/−Atm−/−mice and impaired B cell development in Atm and Mapk7hemat−/− Atm−/− mice
A. Representative flow cytometry profiles representing the erythroid population in the bone marrow. Dot plots representing erythroid precursor distribution based on ter119 and CD71 expression (top). Percentage of ter119+ population in wild-type (n = 3), Mapk7hemat−/− (n = 7), Atm−/− (n = 3) and Mapk7hemat−/−Atm−/− (n = 6) bone marrow (bottom). B. Representative flow cytometry profiles representing B cell precursor distribution (B220lowIgM, B220lowIgM+, B220highIgM+) in the bone marrow population (top). Percentage of bone marrow B cell precursors in wild-type (n = 3), Mapk7hemat−/− (n = 7), Atm−/− (n = 3) and Mapk7hemat−/−Atm−/− (n = 6) mice.
Figure 3
Figure 3. Equivalent thymic cellular distribution in Atm−/− and Mapk7hemat−/−Atm−/− mice
A. Representative flow cytometry profiles representing thymic cell distribution based on CD4 and CD8 expression (top). Percentage of thymic cell subsets (bottom). Thymocytes were isolated from 4- or 5-week-old wild-type (n = 6), Mapk7hemat−/− (n = 7), Atm−/− (n = 7) and Mapk7hemat−/− Atm−/− (n = 8) mice, stained with anti-CD4-APC and anti-CD8-FITC, and then analyzed by flow cytometry. Data represent mean +/− SD of CD4CD8 DN, CD4+CD8+ DP and SP CD4+ and CD8+ cell subsets. B. Number of thymocytes in each developmental stage, for the same mice analyzed in A.. C. Representative flow cytometry profiles of thymic DN population based on CD44 and CD25 expression (top). Percentage of DN thymocyte cell subsets (bottom). Thymocytes were isolated from 4- and 5-week-old wild-type (n = 6), Mapk7hemat−/− (n = 7), Atm−/− (n = 7) and Mapk7hemat−/−Atm−/− (n = 8) mice, stained with anti-CD4-APC, anti-CD8-alexa 488, anti-CD44-PerCP and anti-CD25-PE, and then analyzed by flow cytometry. Data represent mean +/− SD of CD44+CD25 (DN1), CD44+CD25+ (DN2), CD44CD25+ (DN3) and CD44CD25 (DN4) subsets. D. Number of thymocytes in each DN cell subset for the same mice analyzed in C..
Figure 4
Figure 4. Increased G2/M cell cycle phase accumulation in DN thymocytes of Mapk7hemat−/−Atm−/− mice
A. Representative flow cytometry profiles of DNA content in DN thymocytes based on Hoechst staining (top). Percentage of DN thymocytes in each cell cycle phase (bottom). Thymocytes were fixed in 1% paraformaldehyde, labeled with anti-CD4 and anti-CD8 antibodies as indicated in Figure 3 and stained with Hoechst 33342. B. Percentage of live thymocytes measured immediately after thymic extraction. Representative dot plots (left); quantification of FACS staining (right, n ≥ 3 for each genotype). Apoptosis was measured by staining with annexin V and DAPI followed by flow cytometry analysis. C. The mitochondrial mass, membrane potential and cellular ROS in thymocytes were determined by staining with mitoTracker-green, mitoTracker-red and dihydrorhodamine-123, respectively, and analyzed by flow cytometry (n ≥ 3 for each genotype). The MFI in arbitrary units is shown.
Figure 5
Figure 5. Absence of Mapk7 in Atm−/− mice restores the DNA damage response to ionizing irradiation
Mice were treated with 6 Gy and two hours later, thymocytes were isolated and lysed in SDS-buffer or fixed for cell cycle analysis. A. Phosphorylation of H2AX (pH2AX) in thymocytes isolated from irradiated (IR) mice. Representative Western blot with pH2AX and tubulin as loading control (left); pH2AX:tubulin ratio normalized to control Mapk7hemat−/− (right; n ≥ 3 for each genotype). n.s., not significant. B. Cell cycle distribution of live thymocytes isolated from the same mice evaluated in A., as analyzed by PI staining. C. Cell death of the same thymocyte samples evaluated in B. (sub-G1 fraction). D. Representative flow cytometry profiles of DNA content in thymocytes based on PI staining. The quantitation of these results is represented in B. for live thymocytes and in C. for dead cells.
Figure 6
Figure 6. Absence of Mapk7 in Atm−/− mice restores the apoptotic response to ionizing irradiation
Percentage of live thymocytes after isolation from irradiated mice (6 Gy) and culturing for 20 h. Representative flow cytometry profiles A. and quantification of FACS staining (percentage of live cells) B.. Cell death was measured by staining with annexin V and DAPI followed by flow cytometry (n ≥ 3 for each genotype). n.s., not significant.

Comment in

  • ATM/MAPK7 crosstalk in cancer.
    Yélamos J. Yélamos J. Oncotarget. 2017 Feb 28;8(9):14271-14272. doi: 10.18632/oncotarget.15367. Oncotarget. 2017. PMID: 28212585 Free PMC article. No abstract available.

Similar articles

Cited by

References

    1. Aird KM, Worth AJ, Snyder NW, Lee JV, Sivanand S, Liu Q, Blair IA, Wellen KE, Zhang R. ATM couples replication stress and metabolic reprogramming during cellular senescence. Cell Rep. 2015;11:893–901. - PMC - PubMed
    1. Alexander A, Cai S-L, Kim J, Nanez A, Sahin M, MacLean KH, Inoki K, Guan K-L, Shen J, Person MD, Kusewitt D, Mills GB, Kastan MB, Walker CL. ATM signals to TSC2 in the cytoplasm to regulate mTORC1 in response to ROS. Proc Natl Acad Sci USA. 2010;107:4153–4158. - PMC - PubMed
    1. Guo Z, Kozlov S, Lavin MF, Person MD, Paull TT. ATM activation by oxidative stress. Science. 2010;330:517–521. - PubMed
    1. Valentin-Vega YA, MacLean KH, Tait-Mulder J, Milasta S, Steeves M, Dorsey FC, Cleveland JL, Green DR, Kastan MB. Mitochondrial dysfunction in ataxia-telangiectasia. Blood. 2012;119:1490–1500. - PMC - PubMed
    1. D'souza AD, Parish IA, Krause DS, Kaech SM, Shadel GS. Reducing Mitochondrial ROS Improves Disease-related Pathology in a Mouse Model of Ataxia-telangiectasia. Mol Ther. 2012;21:42–48. - PMC - PubMed

MeSH terms

Substances