. 2016 Nov 29;7(48):78226-78241.
doi: 10.18632/oncotarget.12909.

Hedgehog pathway dysregulation contributes to the pathogenesis of human gastrointestinal stromal tumors via GLI-mediated activation of KIT expression

Affiliations

Hedgehog pathway dysregulation contributes to the pathogenesis of human gastrointestinal stromal tumors via GLI-mediated activation of KIT expression

Chih-Min Tang et al. Oncotarget. .

Abstract

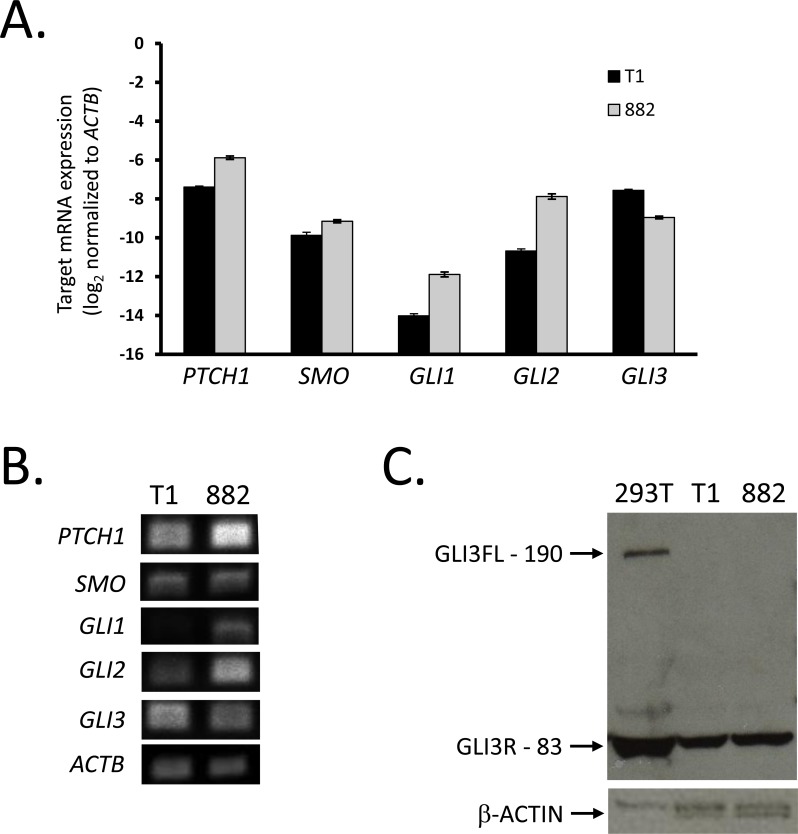
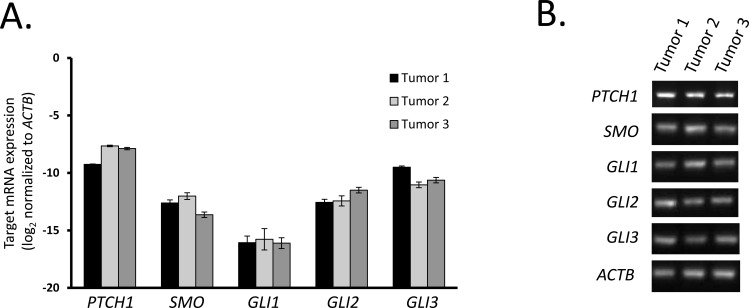
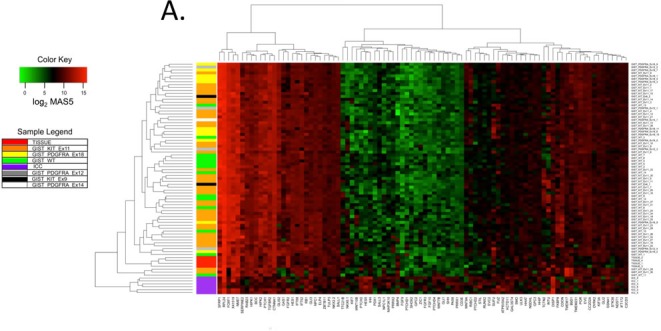
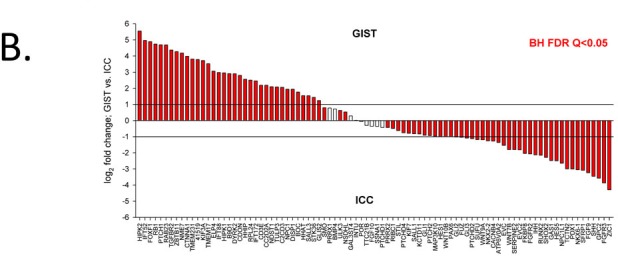
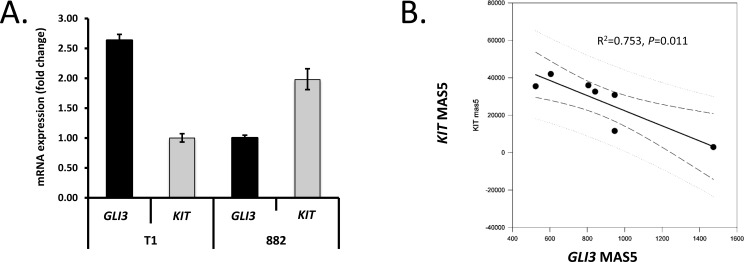
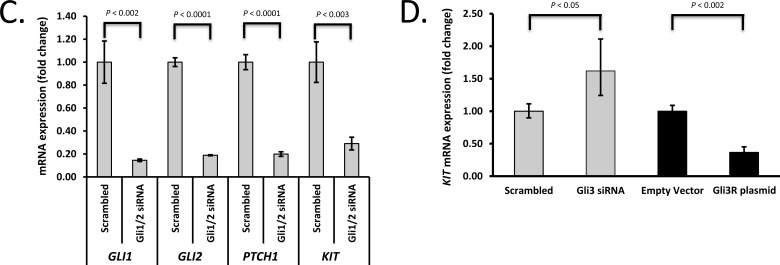
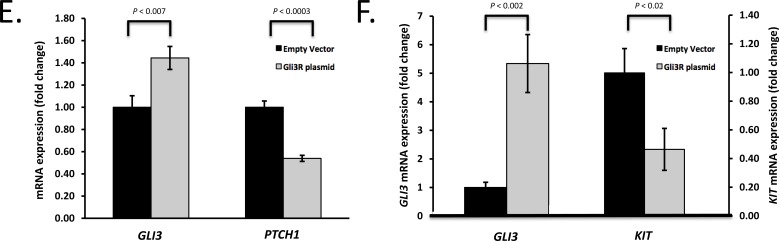
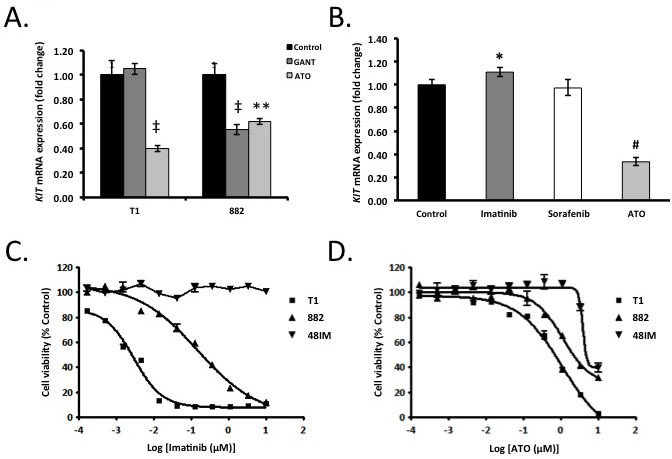
Gastrointestinal stromal tumors (GIST) arise within the interstitial cell of Cajal (ICC) lineage due to activating KIT/PDGFRA mutations. Both ICC and GIST possess primary cilia (PC), which coordinate PDGFRA and Hedgehog signaling, regulators of gastrointestinal mesenchymal development. Therefore, we hypothesized that Hedgehog signaling may be altered in human GIST and controls KIT expression. Quantitative RT-PCR, microarrays, and next generation sequencing were used to describe Hedgehog/PC-related genes in purified human ICC and GIST. Genetic and pharmacologic approaches were employed to investigate the effects of GLI manipulation on KIT expression and GIST cell viability. We report that Hedgehog pathway and PC components are expressed in ICC and GIST and subject to dysregulation during GIST oncogenesis, irrespective of KIT/PDGFRA mutation status. Using genomic profiling, 10.2% of 186 GIST studied had potentially deleterious genomic alterations in 5 Hedgehog-related genes analyzed, including in the PTCH1 tumor suppressor (1.6%). Expression of the predominantly repressive GLI isoform, GLI3, was inversely correlated with KIT mRNA levels in GIST cells and non-KIT/non-PDGFRA mutant GIST. Overexpression of the 83-kDa repressive form of GLI3 or small interfering RNA-mediated knockdown of the activating isoforms GLI1/2 reduced KIT mRNA. Treatment with GLI1/2 inhibitors, including arsenic trioxide, significantly increased GLI3 binding to the KIT promoter, decreased KIT expression, and reduced viability in imatinib-sensitive and imatinib-resistant GIST cells. These data offer new evidence that genes necessary for Hedgehog signaling and PC function in ICC are dysregulated in GIST. Hedgehog signaling activates KIT expression irrespective of mutation status, offering a novel approach to treat imatinib-resistant GIST.

Keywords: GIST; GLI; ICC; arsenic trioxide; imatinib-resistant.


Conflict of interest statement

CONFLICTS OF INTEREST

Juliann Chmielecki, Kai Wang, Deborah Morosini, and Jeffrey Ross are employees of and equity holders in Foundation Medicine, Inc., the provider of the FoundationOne™ and FoundationOne Heme™ assays utilized in this study. Jason Sicklick receives research funds from Foundation Medicine, Inc., Novartis Pharmaceuticals, and Blueprint Medicines. The other authors have nothing to disclose.

Figures

Figure 1
Figure 1. GIST cell lines express Hedgehog signaling components
A. Following RNA extraction from GIST-T1 and GIST882, real-time RT-PCR analysis was performed for Hedgehog signaling components using the ΔCt method and ACTB as reference. Both cell lines were studied in three independent experiments, and each experiment was performed in triplicate. B. Agarose gel electrophoresis of two-step RT-PCR products shows expression of Hedgehog signaling components. C. Western blot analyses performed in whole cell lysates from GIST-T1, GIST882, and HEK293T cells (positive control) showing full length (FL, 190 kDa) or repressor (R, 83 kDa) isoforms of GLI3. β-actin served as loading control.
Figure 2
Figure 2. Tumor tissues from human GIST express Hedgehog signaling components
A. Following RNA extraction from 3 human GIST tumors, real-time RT-PCR analysis was performed for Hedgehog signaling components. mRNA expression was quantified by the ΔCt method using ACTB as reference. B. Agarose gel electrophoresis of two-step RT-PCR products shows expression of Hedgehog signaling components.
Figure 3
Figure 3. Hedgehog signaling-related genes are differentially expressed by human gastric GIST, purified human ICC and their source tissue by microarray analysis
The list of Hedgehog-signaling-related genes was assembled by searching the Affymetrix Human Genome U133 Plus 2.0 microarray annotation file (na33) for Gene Ontology (GO) terms containing “smoothened” (biological process) and “hedgehog” (molecular function) (see specific GO terms in http://www.ebi.ac.uk/GOA). A. Heat map and unsupervised hierarchical cluster analysis of 69 human gastric GIST of various genotypes from the NCBI GEO series GSE17743 [32], GSE8167 [33], and GSE20708 [19] (see Supplementary Table S2 for details), FACS-sorted human ICC (n = 6), and unfractionated gastric tunica muscularis tissues (Tissue; n = 4). Expression values were determined using the MAS5 statistical algorithm. Significance of expression was determined by Wilcoxon signed-rank test. Heatmaps were assembled using probe set expression values with the lowest P value. Red and green colors specify high and low expression, respectively. Mutation status of each human GIST is indicated (WT: wild-type as defined in the referenced studies). Cluster analysis of Hedgehog-related genes differentiated GIST from ICC but not GIST with different genotypes. B. Differential expression of Hedgehog signaling-related genes detected by microarray analysis in human gastric KIT-mutant GIST from the NCBI GEO series GSE17743 [32] (n = 15) and FACS-purified human ICC (n = 6). Expression values were determined by RMA. Unique gene lists were created by identifying the probe sets with the lowest Benjamini-Hochberg false discovery rate (BH FDR) Q values. Horizontal lines indicate threshold for significant log2 fold changes; red fill indicates Q < 0.05 from BH FDR. Differential expression with log2 fold change < −1 or >1 and Q < 0.05 was considered significant. Thirty-five Hedgehog-related genes were significantly overexpressed in GIST including Hedgehog signaling pathway and transcriptional target genes, as well as genes encoding for proteins responsible for anterograde cargo transport in PC. Notably, the 29 genes significantly overexpressed in ICC included the Hedgehog ligands SHH and IHH.
Figure 4
Figure 4. Genetic modulation of GLI transcription factors controls KIT expression
A. Using quantitative RT-PCR, GLI3 and KIT expression were analyzed in two GIST cell lines (n = 3 independent experiments). Note inverse relationship between GLI3 and KIT mRNA in GIST-T1 and GIST882 cells. B. KIT mRNA expression is inversely correlated with GLI3 mRNA expression in the wild-type (WT) subset (n = 7) of GIST microarrays in the NCBI GEO series GSE17743 [32] and GSE20708 [19]. Results from linear regression (solid line) and Pearson product moment correlation are shown. Dashed and dotted lines represent 95% confidence intervals for the regression and the population, respectively. C. Genetic inhibition of GLI1 and GLI2 reduces expression of PTCH1 and KIT in GIST cells. GIST882 cells were co-transfected with GLI1 and GLI2 siRNA or corresponding scrambled sequences (n = 3) and analyzed for GLI1, GLI2, PTCH1 and KIT expression by quantitative RT-PCR 48 h later. D. GLI3 moderates KIT expression in KIT+ GIST cells. GIST882 cells were electroporated with GLI3 siRNA, corresponding scrambled sequence, GLI3R plasmid or empty vector. At 48 h, GLI3 was successfully knocked down with resultant increased KIT mRNA expression as compared to scrambled siRNA (n = 3). In contrast, in GIST882 cells electroporated with GLI3R plasmid, KIT mRNA decreased at 48 h relative to empty vector (n = 3). E. GLI3R inhibits PTCH1 expression in GIST cells. GIST882 cells were transfected with GLI3R plasmid or empty vector and GLI3 and PTCH1 mRNA expression was analyzed at 48 h. F. GLI3R inhibits KIT expression in imatinib-resistant, KIT+ GIST cells. GIST48IM cells were transfected with GLI3R plasmid or empty vector and GLI3 and KIT mRNA expression was analyzed at 48 h. P-values are indicated in the panels.
Figure 5
Figure 5. Pharmacologic modulation of Gli transcription factors decreases KIT expression and cell viability
A. GIST-T1 and GIST882 cells were treated for 48h with 10 μM GANT61 or 4 μM arsenic trioxide (ATO). By qRT-PCR, GLI1/2 pan-inhibition reduced KIT mRNA expression versus 0.1% DMSO control in GIST-T1 (ATO only) and GIST882 cells (both GANT61 and ATO). P < 0.002. ** P < 0.005; n = 3/cell line/treatment/group. B. Imatinib- and sorafenib-resistant GIST48IM cells were treated with imatinib (10 μM), sorafenib (10 μM) or ATO (4 μM) for 48 h. By qRT-PCR, ATO but not imatinib or sorafenib inhibited KIT mRNA expression versus 0.1% DMSO control. * P < 0.05, # P < 0.0002; n = 3/group. C.-D. Eleven-point dose-response curves in GIST-T1, GIST882 and GIST48IM cells treated with 10 μM-169 nM imatinib (C) or ATO (D) for 72, 120 and 120 h, respectively. Cell viability was assessed by MTT assay. ATO dose-dependently inhibited GIST-T1, GIST882 and GIST48IM cell viability.

Similar articles

Cited by

References

    1. Ma GL, Murphy JD, Martinez ME, Sicklick JK. Epidemiology of gastrointestinal stromal tumors in the era of histology codes: results of a population-based study. Cancer Epidemiol Biomarkers Prev. 2015;24:298–302. doi: 10.1158/1055-9965.EPI-14-1002. - DOI - PMC - PubMed
    1. Corless CL, Barnett CM, Heinrich MC. Gastrointestinal stromal tumours: origin and molecular oncology. Nat Rev Cancer. 2011;11:865–78. doi: 10.1038/nrc3143. - DOI - PubMed
    1. Ordog T, Zornig M, Hayashi Y. Targeting Disease Persistence in Gastrointestinal Stromal Tumors. Stem Cells Transl Med. 2015;4:702–7. doi: 10.5966/sctm.2014-0298. - DOI - PMC - PubMed
    1. Bardsley MR, Horvath VJ, Asuzu DT, Lorincz A, Redelman D, Hayashi Y, Popko LN, Young DL, Lomberk GA, Urrutia RA, Farrugia G, Rubin BP, Ordog T. Kitlow stem cells cause resistance to Kit/platelet-derived growth factor alpha inhibitors in murine gastrointestinal stromal tumors. Gastroenterology. 2010;139:942–52. doi: 10.1053/j.gastro.2010.05.083. - DOI - PMC - PubMed
    1. Lorincz A, Redelman D, Horvath VJ, Bardsley MR, Chen H, Ordog T. Progenitors of interstitial cells of cajal in the postnatal murine stomach. Gastroenterology. 2008;134:1083–93. doi: 10.1053/j.gastro.2008.01.036. - DOI - PMC - PubMed

MeSH terms