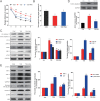
. 2016 Nov 29;7(48):78455-78472.
doi: 10.18632/oncotarget.12925.

Endoplasmic reticulum stress-induced neuronal inflammatory response and apoptosis likely plays a key role in the development of diabetic encephalopathy

Affiliations

Endoplasmic reticulum stress-induced neuronal inflammatory response and apoptosis likely plays a key role in the development of diabetic encephalopathy

Zhouguang Wang et al. Oncotarget. .

Abstract

We assumed that diabetic encephalopathy (DEP) may be induced by endoplasmic reticulum (ER)-mediated inflammation and apoptosis in central nervous system. To test this notion, here we investigated the neuronal ER stress and associated inflammation and apoptosis in a type 2 diabetes model induced with high-fat diet/streptozotocin in Sprague-Dawley rats. Elevated expressions of ER stress markers, including glucose-regulated protein 78 (GRP78), activating transcription factor-6 (ATF-6), X-box binding protein-1 (XBP-1), and C/EBP homologous protein, and phosphor-Jun N-terminal kinase (p-JNK) were evident in the hippocampus CA1 of diabetic rats. These changes were also accompanied with the activation of NF-κB and the increased levels of inflammatory cytokines, tumor necrosis factor-α (TNF-α) and Interleukin-6 (IL-6). Mechanistic study with in vitro cultured hippocampus neurons exposed to high glucose (HG), which induced a diabetes-like effects, shown by increased ER stress, JNK and NF-κB activation, and inflammatory response. Inhibition of ER stress by 4-phenylbutyrate (4-PBA) or blockade of JNK activity by specific inhibitor or transfection of DN-JNK attenuated HG-induced inflammation and associated apoptosis. To validate the in vitro finding, in vivo application of 4-PBA resulted in a significant reduction of diabetes-induced neuronal ER stress, inflammation and cell death, leading to the prevention of DEP. These results suggest that diabetes-induced neuronal ER stress plays the critical role for diabetes-induced neuronal inflammation and cell death, leading to the development of DEP.

Keywords: ER stress; apoptosis; diabetes; inflammation; p-JNK.


Conflict of interest statement

CONFLICTS OF INTEREST

The authors do not have any conflict interest to disclosure

Figures

Figure 1
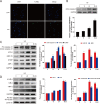
Figure 1. Chronic T2DM (T2D) caused cognitive deficits and neural cells apoptosis
A. The performance of spatial memory acquisition phase 4 weeks after hyperglycemia onset in T2D and age-matched CON groups. B. The mean percentage of time spent in the target quadrant of CON and T2D groups, in which the platform had previously been located during acquisition. C. The results of H&E staining and Nissl staining in the hippocampal CA1 region for the CON and T2D groups. D. Western blot analysis to determine the expression of active caspase-3 in the hippocampal CA1 region of CON and T2D rats. Data were presented as mean ± SD from 8 mice in each group (n = 8). *P < 0.05, **P < 0.01 versus the CON group.
Figure 2
Figure 2. Hippocampal ER stress and inflammatory response were involved in T2D
A. Protein extracts prepared from hippocampal region cells were subjected to immunoblotting to determine the expression of caspase-12, ATF-6, GRP78, CHOP, and XBP-1 in the hippocampal CA1 region of CON and T2D rats, and the optical density analysis of caspase-12, ATF-6, GRP78, CHOP, and XBP-1. B. Western blot analysis to determine the expression of p-IκB, IκBα, TNFα, IL-6 and NF-κB (p65) in the hippocampal region. C. Immunohistochemistry analysis for CHOP in hippocampal CA1 region of CON and T2D rats group. And the quantitative analysis of relative amount of CHOP in hippocampal CA1 region. D. Immunohistochemistry analysis for p-JNK in hippocampal CA1 region of CON and T2D rats group. Data were presented as mean ± SD (n = 8). *P < 0.05, **P < 0.01, ***P < 0.001 versus the CON group.
Figure 3
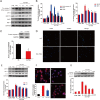
Figure 3. HG-induced apoptosis, ER stress, and inflammatory response in primary hippocampal neurons
A. TUNEL assay was performed to assess apoptosis induction in the primary hippocampal neurons after high glucose (HG) treatment for 36 hours. B. Followed by incubation with HG (52.5 mM vs LG: 30.5 mM) for different time points (0, 12, 24 or 36 hours), the levels of activated caspase-3 in total lysates were determined by western blot analysis. The column figures show the normalized optical density from the data more than 3 independent experiments. C. Immunoblot and optical density analysis for the expression of caspase-12, ATF-6, GRP-78, CHOP, and XBP-1 in primary hippocampal neurons after HG treatment for the indicated time periods. D. The protein expression of TNFα, IL-6, p-IκB/IκBα, and NF-κB (p65) in primary hippocampal neurons after incubation with HG for the indicated time periods. Data were presented as mean ± SD of three independent experiments with duplicate samples at least for each condition in each experiment. *P < 0.05, **P < 0.01, ***P < 0.001 versus the 0 hour group.
Figure 4
Figure 4. PBA administration reduced the HG-induced apoptosis, ER stress, and inflammatory response in primary hippocampal neurons
A.-B. Immunoblot analysis of the caspase-12, ATF-6, GRP78, CHOP, and XBP-1 proteins expression in primary hippocampal neurons following incubation with HG and indicated doses of PBA (0, 0.1, 0.5 or 1 mM). C. The level of activated caspase-3 in total lysates was determined by western blot analysis. D. Cells were treated with HG or HG with PBA for 36 hours, TUNEL assay was performed to detect the anti-apoptosis effect of PBA in the primary hippocampal neurons. E. Primary hippocampal neurons were incubation with HG for 36 hours compound with different doses of PBA. Total protein was extracted and TNFα, IL-6, p-IκB/IκBα, and NF-κB (p65) proteins were subjected to western blot analysis. F.-G. An immunofluorescence-labeled staining and western blot for NF-κB p65 translocation in primary hippocampal neurons after incubated with HG and different doses of PBA for 36 hours. Data were presented as mean ± SD of three independent experiments with duplicate samples at least for each condition in each experiment. *P < 0.05, **P < 0.01, ***P < 0.001 versus the CON group, #P < 0.05, ##P < 0.01 versus the HG treatment group.
Figure 5
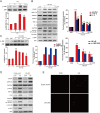
Figure 5. PBA administration inhibited the HG-induced p-JNK activation which was required for HG-induced inflammatory protein expression
A. Western blot analysis for the expression and optical density analysis of p-JNK in primary hippocampal neurons after incubated with HG for the indicated period of time (0, 12, 24 or 36 hours). B. The expression of GRP78, CHOP, TNF-α, IL-6, NF-κB (p65), p-IκB, p-JNK and JNK in primary hippocampal neurons after incubated with HG and different doses of SP600125 (0, 1, or 10 μM). C. The expression and optical density analysis of p-JNK in primary hippocampal neurons after incubated with HG lone or in combination with indicated doses of PBA (0, 0.1, 0.5 or 1 mM). D. The expression of GRP78, CHOP, TNF-a, IL-6, NF-κB (p65), p-IκB, p-JNK and JNK in primary hippocampal neurons transferred with DN-JNK or vector after incubated with HG. E. The DN-JNK reduced the HG-induced primary hippocampal neurons apoptosis, when neurons were transferred with DN-JNK plasmid or vector for 24 hours before the incubation with HG for 36 hours. Data were presented as mean ± SD of three independent experiments with duplicate samples at least for each condition in each experiment. *P < 0.05, **P < 0.01, ***P < 0.001 versus the CON group, #P < 0.05, ##P < 0.01 versus the HG treatment group.
Figure 6
Figure 6. PBA administration inhibited the expression of ER-stress and inflammatory protein in the primary hippocampal neurons which induced by thapsigargin (TG) and tumicamycin (TN)
A. Western blot expression of ATF-6, GRP78, CHOP, XBP-1 in primary hippocampal neurons after treated with TG, TN alone or with PBA. B. The optical density analysis of ATF-6, GRP78. C. The optical density analysis of CHOP, XBP-1. D. The expression of p-JNK, p-IκB and NF-κB (p65) in primary hippocampal neurons after treated with TG, TN alone or with PBA. (E-F). The optical density of p-JNK, NF-κB and p-IκB. Data were presented as mean ± SD (n = 8). *P < 0.05, **P < 0.01, ***P < 0.001 versus the sham group, #P < 0.05, ##P < 0.01 versus the TG, TN treatment group.
Figure 7
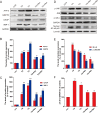
Figure 7. PBA administration protected chronic T2D from cognitive deficits which is associated with the neural cells apoptosis via inhibited the ER stress and inflammatory response
A. The effect of PBA on the performance of spatial memory acquisition phase in T2D rats. B. The mean percentage of time spent in the target quadrant, in which the platform had previously been located during acquisition. C. Protein extracts prepared from hippocampi were subjected to immunoblotting to determine the expression of caspase-12, ATF-6, GRP78, CHOP, p-Perk and XBP-1 in the CON, T2D rats or T2D rats treated with PBA groups. D. Total proteins extracted from hippocampal region were subjected to western blot analysis for the determination of activated caspase-3. E. Western blot analysis to determine the expression of p-IκB, IκBα, TNFα, and IL-6 in the hippocampal CA1 region. The column figures show the normalized optical density from the data more than 3 independent experiments. Data were presented as mean ± SD (n = 16). *P < 0.05, **P < 0.01, ***P < 0.001 versus the CON group, #P < 0.05, ##P < 0.01 versus the T2D rats group.
Figure 8
Figure 8. PBA administration protects the neural cells in the CA1 region of the T2D rats, and inhibits the expressions of CHOP and p-JNK protein
A. Immunohistochemistry analysis for CHOP. B. Analysis of the optical density of CHOP in the hippocampal CA1 area. C.-D. The results of Nissl staining for the CON, T2D and T2D treated with PBA groups. E. Immunohistochemistry analysis for p-JNK. F. Analysis of the optical density of p-JNK protein in the hippocampal CA1 area. G. A schematic diagram depicting the potential molecular mechanisms underlying HG-induced cell death and PBA protection via alleviating ER stress and NF-κB activation. Data were presented as mean ± SD (n = 8). *P < 0.05, **P < 0.01 versus the CON group, #P < 0.05 versus the T2D group.

Similar articles

Cited by

References

    1. Sima AA, Li ZG. The effect of C-peptide on cognitive dysfunction and hippocampal apoptosis in type 1 diabetic rats. Diabetes. 2005;54:1497–1505. - PubMed
    1. Mijnhout GS, Scheltens P, Diamant M, Biessels GJ, Wessels AM, Simsek S, Snoek FJ, Heine RJ. Diabetic encephalopathy: A concept in need of a definition. Diabetologia. 2006;49:1447–1448. - PubMed
    1. Tirassa P, Maccarone M, Florenzano F, Cartolano S, De Nicolo S. Vascular and Neuronal Protection Induced by the Ocular Administration of Nerve Growth Factor in Diabetic-Induced Rat Encephalopathy. CNS Neurosci Ther. 2013;19:307–318. - PMC - PubMed
    1. Reinhard H, Garde E, Skimminge A, Akeson P, Ramsoy TZ, Winther K, Parving HH, Rossing P, Jacobsen PK. Plasma NT-proBNP and white matter hyperintensities in type 2 diabetic patients. Cardiovasc Diabetol. 2012:11. - PMC - PubMed
    1. de Bresser J, Tiehuis AM, van den Berg E, Reijmer YD, Jongen C, Kappelle LJ, Mali WP, Viergever MA, Biessels GJ. Progression of cerebral atrophy and white matter hyperintensities in patients with type 2 diabetes. Diabet Care. 2010;33:1309–1314. - PMC - PubMed

MeSH terms